MIRA
INFORM REPORT
|
Report Date : |
09.08.2014 |
IDENTIFICATION DETAILS
|
Name : |
KCG CORPORATION CO., LTD. |
|
|
|
|
Formerly Known As : |
IMPERIAL GENERAL
FOODS INDUSTRY CO., LTD |
|
|
|
|
Registered Office : |
3059, 3059/1-3 Sukhumvit
Road, Bangchak, Prakanong,
|
|
|
|
|
Country : |
|
|
|
|
|
Financials (as on) : |
31.12.2012 |
|
|
|
|
Date of Incorporation : |
24.05.1985 |
|
|
|
|
Com. Reg. No.: |
0105528018144 |
|
|
|
|
Legal Form : |
Private Limited Company |
|
|
|
|
Line of Business : |
Subject is engaged in manufacturing and
distributing of dairy
foods and food
products, such as
jam, jelly, whipping
cream, chocolate, and
bakery ingredient |
|
|
|
|
No. of Employees : |
1,200 |
RATING & COMMENTS
|
MIRA’s Rating : |
Ba |
|
|||
|
RATING |
STATUS |
PROPOSED CREDIT LINE |
||||
|
41-55 |
Ba |
Overall operation is considered normal. Capable to meet normal
commitments. |
Satisfactory |
|||
|
Status : |
Satisfactory |
|
Payment Behaviour : |
No complaints |
|
Litigation : |
Clear |
NOTES :
Any query related to this report can be made
on e-mail : infodept@mirainform.com
while quoting report number, name and date.
ECGC Country Risk Classification List – June 01, 2014
|
Country Name |
Previous Rating (31.03.2014) |
Current Rating (01.06.2014) |
|
|
B1 |
B1 |
|
Risk Category |
ECGC
Classification |
|
Insignificant |
A1 |
|
Low |
A2 |
|
Moderate |
B1 |
|
High |
B2 |
|
Very High |
C1 |
|
Restricted |
C2 |
|
Off-credit |
D |
THAILAND - ECONOMIC OVERVIEW
With a well-developed infrastructure, a free-enterprise
economy, generally pro-investment policies, and strong export industries,
Thailand achieved steady growth due largely to industrial and agriculture
exports - mostly electronics, agricultural commodities, automobiles and parts,
and processed foods. Thailand is trying to maintain growth by encouraging
domestic consumption and public investment to offset weak exports in 2012.
Unemployment, at less than 1% of the labor force, stands as one of the lowest levels
in the world, which puts upward pressure on wages in some industries. Thailand
also attracts nearly 2.5 million migrant workers from neighboring countries.
The Thai government is implementing a nation-wide 300 baht ($10) per day
minimum wage policy and deploying new tax reforms designed to lower rates on
middle-income earners. The Thai economy has weathered internal and external
economic shocks in recent years. The global economic crisis severely cut
Thailand's exports, with most sectors experiencing double-digit drops. In 2009,
the economy contracted 2.3%. However, in 2010, Thailand's economy expanded
7.8%, its fastest pace since 1995, as exports rebounded. In late 2011 growth
was interrupted by historic flooding in the industrial areas in Bangkok and its
five surrounding provinces, crippling the manufacturing sector. Industry
recovered from the second quarter of 2012 onward with GDP growth at 5.5% in
2012. The government has approved flood mitigation projects worth $11.7
billion, which were started in 2012, to prevent similar economic damage, and an
additional $75 billion for infrastructure over the next seven years with a plan
to start in 2013
|
Source
: CIA |
Company name
KCG CORPORATION
CO., LTD.
[FORMER
: IMPERIAL GENERAL
FOODS INDUSTRY CO.,
LTD.]
SUMMARY
BUSINESS
ADDRESS : 3059, 3059/1-3 SUKHUMVIT
ROAD,
BANGCHAK, PRAKANONG,
BANGKOK 10260,
THAILAND
TELEPHONE : [66] 2332-8040-9,
2331-6968-70
FAX :
[66] 2331-6891,
2331-6911
E-MAIL
ADDRESS : nifo@kcgcorporation.com
REGISTRATION
ADDRESS : SAME
AS BUSINESS ADDRESS
ESTABLISHED
: 1985
REGISTRATION
NO. : 0105528018144
TAX
ID NO. : 3101347197
CAPITAL REGISTERED : BHT. 330,000,000
CAPITAL PAID-UP : BHT.
330,000,000
SHAREHOLDER’S PROPORTION : THAI : 100%
FISCAL YEAR CLOSING DATE : DECEMBER 31
LEGAL
STATUS : PRIVATE LIMITED
COMPANY
EXECUTIVE : MR. TONG DHIRANUSORNKIT, THAI
PRESIDENT AND
CHIEF EXECUTIVE OFFICER
NO.
OF STAFF : 1,200
LINES
OF BUSINESS : FOOD
PRODUCTS
MANUFACTURER, IMPORTER
AND DISTRIBUTOR
CORPORATE PROFILE
OPERATING
TREND : STABLE
PRESENT
SITUATION : OPERATING NORMALLY
REPUTATION : GOOD
WITH NORMAL BUSINESS
ENGAGEMENT
MANAGEMENT
STANDARD : MANAGEMENT WITH
GOOD PERFORMANCE
HISTORY
The
subject was established
on May 24,
1985 as a
private limited company
under the originally
registered name “Imperial
General Foods Industry
Co., Ltd.”, by
Thai groups. It
is a member of
Kim Chua Group of
Companies. On October
14, 2013, its
registered name was changed
to KCG CORPORATION CO., LTD. Its
business objective is to manufacture,
import and distribute
wide range of
foods products to
domestic market. It
currently employs approximate
1,200 staff.
In
January 2014, The
Kim Chua Group
Co., Ltd., has
restructured its internal
businesses for business
competency and efficiency
by changing the
company name to “KCG
Corporation Co., Ltd.”
Therefore, the companies
within Kim Chua
Group have changed
the company name
accordingly as follows:
- “Imperial General
Foods Industry Co., Ltd.”
changed its name to
“KCG Corporation Co.,
Ltd.” (Bangplee Branch)
- “United
Diary Foods Co.,
Ltd.” changed its name to “KCG
Corporation Co., Ltd.”
(Bangna Branch) and
(Theparak Branch)
- “United
Dairy Farm Co., Ltd.”
changed its name to
“KCG Corporation Co.,
Ltd.” (Dairy Business
Department)
- “Imperial Bakery Equipment Co.,
Ltd.” changed its name to “KCG Corporation Co.,
Ltd.” (Bakery Equipment
Department)
- “Imperial Bakery
and Food Culinary
School” changed its
name to “KCG
Corporation Co., Ltd.”
(Sukhumvit 64 Branch)
- “Chiangmai Distribution Center” changed its
name to “KCG
Corporation Co., Ltd.”
(Chiangmai Branch)
- “Khon
Kaen Distribution Center”
changed its name
to “KCG Corporation Co.,
Ltd.” (Khon Kaen Branch).
The
subject achieved many certified standards
such as ISO 9001 : 2008, GMP, HACCP,
HAL-Q, and HALAL
standards.
The subject’s registered address
is 3059-3059/1-3 Sukhumvit
Road, Bangchak, Prakanong,
Bangkok 10260, and
this is the
subject’s current operation
address.
THE
BOARD OF DIRECTOR
|
Name |
|
Nationality |
Age |
|
|
|
|
|
|
Mr. Tong Dhiranusornkit |
|
Thai |
71 |
|
Mr. Damrongkij Vipawatanakul |
|
Thai |
50 |
|
Mr. Pumin Dhiranusornkit |
|
Thai |
39 |
|
Mr. Thawach Dhiranusornkit |
|
Thai |
46 |
|
Mr. Monsan Dhiranusornkit |
|
Thai |
44 |
|
Mr. Damrong Vipawatanakul |
|
Thai |
54 |
|
Mr. Damrongchai Vipawatanakul |
|
Thai |
51 |
AUTHORIZED PERSON
Any two of
the above directors
can jointly sign
on behalf of
the subject with
company’s affixed.
MANAGEMENT
Mr. Tong Dhiranusornkit is
the President and
Chief Executive Officer.
He is Thai
nationality with the
age of 71
years old.
Mr. Damrong Vipawatanakul is
the Senior Executive
Vice President of
Strategic Planning and
Business Development.
He is Thai
nationality with the
age of 54
years old.
Mr. Pumin Dhiranusornkit is
the Executive Vice
President of International
Business.
He is Thai
nationality with the
age of 39
years old.
Mr. Weerayut Kusolsongserm is
the Vice President
of Corporate Communication.
He is Thai
nationality.
Mr. Damrongchai Vipawatanakul is
the Vice President
of Sales.
He is Thai
nationality with the
age of 51
years old.
Mr. Monsan Dhiranusornkit is
the Vice President
of Logistics.
He is Thai
nationality with the
age of 44
years old.
Mrs. Lalana Dhiranusornkit is
the Vice President
of Food Innovation
Research and Development.
She is Thai
nationality.
BUSINESS OPERATIONS
The subject
is engaged in
manufacturing and distributing
of dairy foods
and food products,
such as jam,
jelly, whipping cream,
chocolate, and bakery
ingredient as well
as importing and
distributing wide range of
foods and beverage products,
such as balsamic
vinegar, cake, chocolate,
crackers, filling cake,
French fries, fruits & nut, honey & syrups, margarine & shortening, milk
powder & milk replace,
pasta, tomato products, waffle
crisps, cheese equipment,
coffee, cream, flour & premix, frozen
dough, gelatin, improver & yeast, seafood,
topping & grace, butter &
spreads, cheese, cookies & biscuit, filling & jam, ham & sausage, jelly,
meat, olive oil & salad dressing,
sugar, wafer and
etc.
BRAND NAME
“FRICO”, “ANGEY BAY”,
“INDEPENDENT”, “SUNQUICK”, “MEGGLE”,
“EMMI”, “GALBANI”, “KERRY”,
“LARNAUDIE”, “COON”, “CORMAN”,
“KAWAN”,
“LA ESPANOLA”, “MEADOWLEA”
“IMPERIAL” and etc.
PURCHASE
Raw materials are
purchased from local
suppliers, while the
products are imported
from Argentina, Australia,
Austria, Belgium, Republic
of China, Denmark,
U.K., France, Germany,
Netherlands, Indonesia, Ireland,
Italy, Japan, New
Zealand, Norway, Spain,
Switzerland, Turkey, U.S.A.
and others.
MAJOR
SUPPLIERS
ConAgra
Foods Lamb Weston
Inc. : U.S.A.
Uni
Clover Co., Ltd. : Japan
Anzco
Foods Ltd. : Norway
Compagnia
Mercantile D’Oltremare S.r.L. : Italy
DMK
Deutsches Milchkontor GmbH. : Germany
SALES
100% of the
products is sold
locally to wholesalers
and end-users.
MAJOR CUSTOMERS
D.K. Bakery Mart
Trading Co., Ltd.
CP Ram Co.,
Ltd.
SUBSIDIARY AND AFFILIATED
COMPANY
The subject is
not found to
have any subsidiary
or affiliated company
here in Thailand.
LITIGATION
Bankruptcy and Receivership
There are no
litigation on bankruptcy
and receivership cases
filed against the
subject found at
Legal Execution Department
for the past
five years.
Others
There
are no legal
suits filed against
the subject for
the past two
years.
CREDIT
Sales are by
cash or on
the credits term
of 30-60 days.
Local bills are paid
by cash or
on the credits
term of 30-60
days.
Imports are by
L/C at sight
or T/T.
BANKING
Bank
of Ayudhya Public
Co., Ltd.
Bangkok
Bank Public Co.,
Ltd.
Kasikornbank
Public Co., Ltd.
Krung
Thai Bank Public
Co., Ltd.
EMPLOYMENT
The
subject currently employs
approximate 1,200 staff.
LOCATION
DETAILS
The
premise is owned for
administrative office at
the heading address.
Premise is located
in commercial/residential area.
Factories:
-
879 Soi Buakerd,
Bangna-Trad Road, Bangna,
Prakanong, Bangkok 10260.
-
228 Moo 11,
Theparak Road, Bangplee
Yai, Bangplee, Samutprakarn
10540.
-
79 Moo 11,
Theparak Road, Bangplee,
Samutprakarn 10540.
Branches:
-
2312-2314
Sukhumvit Road, Bangchak,
Prakanong, Bangkok 10260.
-
Sukhumvit
64 Road, Bangkok
-
Chiangmai
-
Khon Kaen
COMMENT
The
subject is engaged
in manufacturing and
distributing dairy foods
and food products.
Its products are
well recognized and
widely accepted in
the local market.
The subject’s operating
performance in 2012
was strong with
an increase in
both sales revenue
and net profit
comparing to the previous
year’s level. With a
recent business restructuring
within Kim Chua
Group of companies,
the subject expects
for business competency,
efficiently and more
profitability in the
long-term prospect.
FINANCIAL INFORMATION
The capital
was registered at Bht. 5,000,000 divided
into 5,000 shares of Bht.
1,000 each with fully
paid.
The
capital was increased
later as follows:
Bht. 90,000,000
on July
18, 1995
Bht. 170,000,000
on September
30, 1997
Bht. 280,000,000
on June
12, 2007
Bht. 330,000,000
on December 12,
2013
The
latest registered capital
was increased to Bht. 330
million, divided into 330,000
shares of Bht. 1,000
each with fully
paid.
THE
SHAREHOLDERS LISTED WERE
: [as at December
12, 2013]
|
NAME |
HOLDING |
% |
|
|
|
|
|
United Dairy Foods
Co., Ltd. Nationality: Thai Address : 879
Soi Buakerd, Bangna,
Bangkok |
200,000 |
60.61 |
|
Kim Chua Group
Co., Ltd. Nationality: Thai Address : 3059, 3059/1-3 Sukhumvit Road, Bangchak,
Prakanong, Bangkok |
120,000 |
36.36 |
|
Mr. Vijai Vipawatanakul Nationality: Thai Address : 958/14
Moo 12, Bangna,
Bangkok |
1,000 |
|
|
Mr. Tong Dhiranusornkit Nationality: Thai Address : 81
Soi Chalemprakiat R.9,
Dokmai,
Prawet, Bangkok |
1,000 |
|
|
Mr. Damrong Vipawatanakul Nationality: Thai Address : 3059, 3059/3 Sukhumvit
Road, Bangchak,
Prakanong, Bangkok |
1,000 |
|
|
Mr. Thawach Dhiranusornkit Nationality: Thai Address : 147
Soi Chalemprakiat R.9,
Dokmai,
Prawet, Bangkok |
1,000 |
= 3.03 |
|
Mrs. Suwanna Mahakarn Nationality: Thai Address : 369
Bangna-Trad 27 Road,
Bangna, Bangkok |
1,000 |
|
|
Mr. Damrongchai Vipawatanakul Nationality: Thai Address : 100/122
Moo 11, Bangpla,
Bangplee, Samutprakarn
|
1,000 |
|
|
Mr. Damrongkij Vipawatanakul Nationality: Thai Address : 958/14
Moo 12, Bangna,
Bangkok |
1,000 |
|
|
Mr. Monsan Dhiranusornkit Nationality: Thai Address : 145
Soi Chalemprakiat R.9,
Dokmai,
Prawet, Bangkok |
1,000 |
|
|
Mrs. Pojanan Suksantpanthep Nationality: Thai Address : 69/135
Moo 3, Dokmai,
Prawet, Bangkok |
1,000 |
|
|
Mr. Pumin Dhiranusornkit Nationality: Thai Address : 149
Soi Chalemprakiat R.9,
Dokmai,
Prawet, Bangkok |
1,000 |
|
Total Shareholders : 12
Share Structure [as
at December 12, 2013]
|
Nationality |
Shareholders |
No. of Share |
% Shares |
|
|
|
|
|
|
Thai |
12 |
330,000 |
100.00 |
|
Foreign |
- |
- |
- |
|
Total |
12 |
330,000 |
100.00 |
NAME OF AUDITOR
& CERTIFIED PUBLIC
ACCOUNTANT NO. :
Ms. Suwanna Srihong No.
0421
BALANCE SHEET [BAHT]
The
latest financial figures
published for December
31, 2012, 2011
& 2010 were:
ASSETS
|
Current Assets |
2012 |
2011 |
2010 |
|
|
|
|
|
|
Cash and Cash Equivalents |
235,178.41 |
194,782.71 |
182,574.29 |
|
Trade Accounts Receivable |
121,203,328.55 |
156,086,863.47 |
118,028,321.46 |
|
Inventories |
54,526,863.55 |
69,907,367.41 |
30,562,327.48 |
|
Other Receivable |
- |
- |
1,267,072.22 |
|
Other Current Assets
|
1,852,719.20 |
13,255,744.80 |
- |
|
Total Current Assets
|
177,818,089.71 |
239,444,758.39 |
150,040,295.45 |
|
Long-term Investment |
110,000,000.00 |
110,000,000.00 |
110,000,000.00 |
|
Intangible Assets |
983,922.21 |
- |
- |
|
Fixed Assets |
420,770,391.95 |
328,669,908.62 |
303,202,869.14 |
|
Total Assets |
709,572,403.87 |
678,114,667.01 |
563,253,164.59 |
LIABILITIES & SHAREHOLDERS' EQUITY [BAHT]
|
Current
Liabilities |
2012 |
2011 |
2010 |
|
|
|
|
|
|
Bank Overdraft &
Loan from Bank |
111,849,155.35 |
112,817,026.78 |
100,672,449.76 |
|
Trade Accounts & Other Payable |
122,959,989.85 |
187,549,183.46 |
75,952,343.69 |
|
Current Portion of Long-term
Loans |
22,880,000.00 |
34,400,000.00 |
34,800,000.00 |
|
Accrued Income Tax |
13,637,939.46 |
2,940,403.01 |
- |
|
Other Current Liabilities |
1,948,195.49 |
1,675,214.78 |
3,633,410.01 |
|
Total Current Liabilities |
273,275,280.15 |
339,381,828.03 |
215,058,203.46 |
|
Hire-purchase payable, Net
of Current Portion |
357,140.25 |
783,628.83 |
610,253.21 |
|
Long-term Loans, Net
of Current Portion |
68,770,000.00 |
24,099,612.91 |
44,499,612.91 |
|
Total Liabilities |
342,402,420.40 |
364,265,069.77 |
260,168,069.58 |
|
|
|
|
|
|
Shareholders' Equity |
|
|
|
|
|
|
|
|
|
Share capital : Baht 1,000
par value authorized, issued
and fully paid share
capital 280,000 shares |
280,000,000.00 |
280,000,000.00 |
280,000,000.00 |
|
Capital Paid |
280,000,000.00 |
280,000,000.00 |
280,000,000.00 |
|
Premium on Share Capital |
112,253,016.53 |
112,423,000.00 |
112,423,000.00 |
|
Retained Earning -
Unappropriated |
[25,253,016.53 ] |
[78,573,402.76] |
[89,337,904.99] |
|
Total Shareholders' Equity |
367,169,983.47 |
313,849,597.24 |
303,085,095.01 |
|
Total Liabilities &
Shareholders' Equity |
709,572,403.87 |
678,114,667.01 |
563,253,164.59 |
PROFIT & LOSS
ACCOUNT
|
Revenue |
2012 |
2011 |
2010 |
|
|
|
|
|
|
Sales |
1,158,620,539.16 |
863,937,048.64 |
668,036,354.91 |
|
Other Income |
3,950,534.21 |
4,581,459.45 |
3,622,180.79 |
|
Total Revenues |
1,162,571,073.37 |
868,518,508.09 |
671,658,535.70 |
|
Expenses |
|
|
|
|
|
|
|
|
|
Cost of Goods
Sold |
1,047,012,086.77 |
820,715,014.42 |
631,171,976.01 |
|
Selling Expenses |
13,449,992.24 |
4,774,481.73 |
5,337,111.24 |
|
Administrative Expenses |
21,357,731.49 |
18,761,666.06 |
16,385,067.04 |
|
Total Expenses |
1,081,819,810.50 |
844,251,162.21 |
652,894,154.29 |
|
Profit / [Loss] before
Financial Cost & Income Tax |
80,751,262.87 |
24,267,345.88 |
18,764,381.41 |
|
Financial Cost |
[11,302,337.18] |
[8,799,240.64] |
[7,230,538.83] |
|
Profit / [Loss] before Income
Tax |
69,448,925.69 |
15,468,105.24 |
11,533,842.58 |
|
Income Tax |
[16,128,539.45] |
[4,703,603.01] |
[3,639,667.40] |
|
Net Profit / [Loss] |
53,320,386.23 |
10,764,502.23 |
7,894,175.18 |
FINANCIAL ANALYSIS
|
ITEM |
UNIT |
2012 |
2011 |
2010 |
|
|
|
|
|
|
|
LIQUIDITY RATIO |
|
|
|
|
|
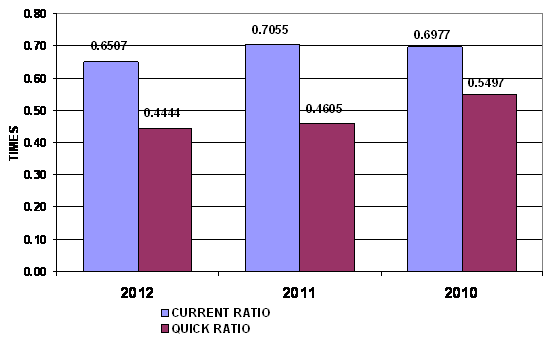
CURRENT RATIO |
TIMES |
0.65 |
0.71 |
0.70 |
|
QUICK RATIO |
TIMES |
0.44 |
0.46 |
0.55 |
|
|
|
|
|
|
|
ACTIVITY RATIO |
|
|
|
|
|
FIXED ASSETS TURNOVER |
TIMES |
2.75 |
2.63 |
2.20 |
|
TOTAL ASSETS TURNOVER |
TIMES |
1.63 |
1.27 |
1.19 |
|
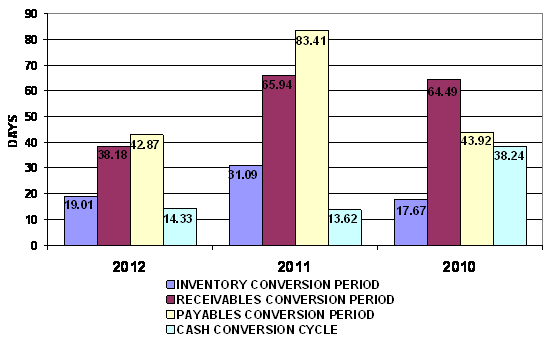
INVENTORY CONVERSION PERIOD |
DAYS |
19.01 |
31.09 |
17.67 |
|
INVENTORY TURNOVER |
TIMES |
19.20 |
11.74 |
20.65 |
|
RECEIVABLES CONVERSION PERIOD |
DAYS |
38.18 |
65.94 |
64.49 |
|
RECEIVABLES TURNOVER |
TIMES |
9.56 |
5.53 |
5.66 |
|
PAYABLES CONVERSION PERIOD |
DAYS |
42.87 |
83.41 |
43.92 |
|
CASH CONVERSION CYCLE |
DAYS |
14.33 |
13.62 |
38.24 |
|
|
|
|
|
|
|
PROFITABILITY
RATIO |
|
|
|
|
|
COST OF GOODS SOLD |
% |
90.37 |
95.00 |
94.48 |
|
SELLING & ADMINISTRATION |
% |
3.00 |
2.72 |
3.25 |
|
INTEREST |
% |
0.98 |
1.02 |
1.08 |
|
GROSS PROFIT MARGIN |
% |
9.97 |
5.53 |
6.06 |
|
NET PROFIT MARGIN BEFORE EX. ITEM |
% |
6.97 |
2.81 |
2.81 |
|
NET PROFIT MARGIN |
% |
4.60 |
1.25 |
1.18 |
|
RETURN ON EQUITY |
% |
14.52 |
3.43 |
2.60 |
|
RETURN ON ASSET |
% |
7.51 |
1.59 |
1.40 |
|
EARNING PER SHARE |
BAHT |
190.43 |
38.44 |
28.19 |
|
|
|
|
|
|
|
LEVERAGE RATIO |
|
|
|
|
|
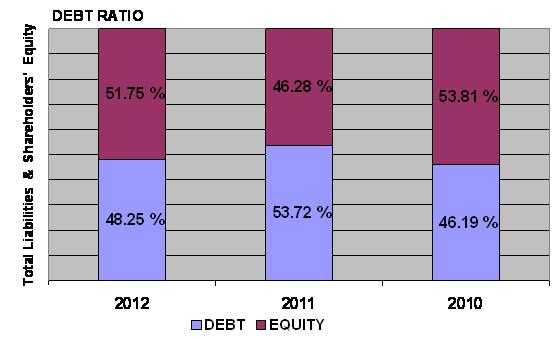
DEBT RATIO |
TIMES |
0.48 |
0.54 |
0.46 |
|
DEBT TO EQUITY RATIO |
TIMES |
0.93 |
1.16 |
0.86 |
|
TIME INTEREST EARNED |
TIMES |
7.14 |
2.76 |
2.60 |
|
|
|
|
|
|
|
ANNUAL GROWTH |
|
|
|
|
|
SALES GROWTH |
% |
34.11 |
29.32 |
|
|
OPERATING PROFIT |
% |
232.76 |
29.33 |
|
|
NET PROFIT |
% |
395.34 |
36.36 |
|
|
FIXED ASSETS |
% |
28.02 |
8.40 |
|
|
TOTAL ASSETS |
% |
4.64 |
20.39 |
|
ANNUAL GROWTH :
EXCELLENT
An annual sales growth is 34.11%. Turnover has increased from THB
PROFITABILITY :
ACCEPTABLE

PROFITABILITY
RATIO
|
Gross Profit Margin |
9.97 |
Deteriorated |
Industrial
Average |
91.36 |
|
Net Profit Margin |
4.60 |
Acceptable |
Industrial
Average |
6.21 |
|
Return on Assets |
7.51 |
Acceptable |
Industrial
Average |
11.69 |
|
Return on Equity |
14.52 |
Acceptable |
Industrial
Average |
21.94 |
Gross Profit Margin used to assess a firm's financial health by
revealing the proportion of money left over from revenues after accounting for
the cost of goods sold. Gross profit margin serves as the source for paying
additional expenses and future savings. The company's figure is 9.97%. When
compared with the industry average, the ratio of the company was lower. This
indicated that company may have problems with control over its costs.
Net Profit Margin is the indicator of the company's efficiency in that
net profit takes into consideration all expenses of the company. A low profit
margin indicates a low margin of safety, higher risk that a decline in sales
will erase profits and result in a net loss. The company's figure is 4.6%. When
compared with the industry average, the ratio of the company was lower.
Return on Assets measures how efficiently profits are being generated
from the assets employed in the business when compared with the ratios of firms
in a similar business. A low ratio in comparison with industry averages
indicates an inefficient use of business assets. When compared with the
industry average, it was lower, the company's figure is 7.51%.
Return on Equity indicates how profitable a company is by comparing its
net income to its average shareholders' equity, ROE measures how much the
shareholders earned for their investment in the company. When compared with the
industry average, it was lower, the company's figure is 14.52%.
Trend of the
average competitors in the same industry for last 5 years
Return on Assets Uptrend
Return on Equity Uptrend
LIQUIDITY : ACCEPTABLE
LIQUIDITY RATIO
|
Current Ratio |
0.65 |
Risky |
Industrial
Average |
1.00 |
|
Quick Ratio |
0.44 |
|
|
|
|
Cash Conversion Cycle |
14.33 |
|
|
|
The Current Ratio is to ascertain whether a company's short-term assets are
readily available to pay off its short-term liabilities. The company's figure
is 0.65 times in 2012, decrease from 0.71 times, then the company may not be
efficiently using its current assets. When compared with the industry average,
the ratio of the company was lower.
The Quick Ratio is a liquidity indicator that further refines the
current ratio by measuring the amount of the most liquid current assets there
are to cover current liabilities. The company's figure is 0.44 times in 2012,
decrease from 0.46 times, then the company has not enough current assets that
presumably can be quickly converted to cash for pay financial obligations.
The Cash Conversion Cycle measures the number of days a company's cash
is tied up in the production and sales process of its operations and the
benefit from payment terms from its creditors. It meant the company could
survive when no cash inflow was received from sale for 15 days.
Trend of the
average competitors in the same industry for last 5 years
Current Ratio Uptrend
LEVERAGE :
IMPRESSIVE

LEVERAGE RATIO
|
Debt Ratio |
0.48 |
Acceptable |
Industrial
Average |
0.45 |
|
Debt to Equity Ratio |
0.93 |
Impressive |
Industrial
Average |
0.81 |
|
Times Interest Earned |
7.14 |
Impressive |
Industrial
Average |
- |
Debt to Equity Ratio a measurement of how much suppliers, lenders,
creditors and obligors have committed to the company versus what the
shareholders have committed. A lower the percentage means that the company is
using less leverage and has a stronger equity position.
Times Interest Earned measuring a company's ability to meet its debt
obligations. Ratio is 7.15 higher than 1, so the company can pay interest
expenses on outstanding debt.
Debt Ratio shows the proportion of a company's assets which are financed
through debt. The company's figure is 0.48 less than 0.5, most of the company's
assets are financed through equity.
Trend of the
average competitors in the same industry for last 5 years
Debt Ratio Uptrend
Times Interest Earned Stable
ACTIVITY :
IMPRESSIVE
ACTIVITY RATIO
|
Fixed Assets Turnover |
2.75 |
Impressive |
Industrial
Average |
- |
|
Total Assets Turnover |
1.63 |
Satisfactory |
Industrial
Average |
1.88 |
|
Inventory Conversion Period |
19.01 |
|
|
|
|
Inventory Turnover |
19.20 |
Impressive |
Industrial
Average |
12.79 |
|
Receivables Conversion Period |
38.18 |
|
|
|
|
Receivables Turnover |
9.56 |
Impressive |
Industrial
Average |
7.92 |
|
Payables Conversion Period |
42.87 |
|
|
|
The company's Account Receivable Ratio is calculated as 9.56 and
Inventory Turnover in Days Ratio indicates the liquidity of inventory.
It estimates the number of days that it will take to sell the current
inventory. Inventory is particularly sensitive to change in business
activities. The inventory turnover in days has decreased from 31 days at the
end of 2011 to 19 days at the end of 2012. This represents a positive trend.
And Inventory turnover has increased from 11.74 times in year 2011 to 19.2
times in year 2012.
The company's Total Asset Turnover is calculated as 1.63 times and 1.27
times in 2012 and 2011 respectively. This ratio is determined by dividing total
assets into total sales turnover. The ratio measures the activity of the assets
and the ability of the firm to generate sales through the use of the assets.
Trend of the
average competitors in the same industry for last 5 years
Fixed Assets Turnover Stable
Total Assets Turnover Uptrend
Inventory Turnover Uptrend
Receivables Turnover Uptrend
FOREIGN EXCHANGE RATES
|
Currency |
Unit
|
Indian Rupees |
|
US Dollar |
1 |
Rs.61.55 |
|
|
1 |
Rs.103.50 |
|
Euro |
1 |
Rs.82.41 |
INFORMATION DETAILS
|
Report Prepared
by : |
PDT |
RATING EXPLANATIONS
|
RATING |
STATUS |
PROPOSED CREDIT LINE |
|
|
>86 |
Aaa |
Possesses an extremely sound financial base with the strongest
capability for timely payment of interest and principal sums |
Unlimited |
|
71-85 |
Aa |
Possesses adequate working capital. No caution needed for credit
transaction. It has above average (strong) capability for payment of interest
and principal sums |
Large |
|
56-70 |
A |
Financial & operational base are regarded healthy. General unfavourable
factors will not cause fatal effect. Satisfactory capability for payment of
interest and principal sums |
Fairly Large |
|
41-55 |
Ba |
Overall
operation is considered normal. Capable to meet normal commitments. |
Satisfactory |
|
26-40 |
B |
Capability to overcome financial difficulties seems comparatively
below average. |
Small |
|
11-25 |
Ca |
Adverse factors are apparent. Repayment of interest and principal sums
in default or expected to be in default upon maturity |
Limited with full
security |
|
<10 |
C |
Absolute credit risk exists. Caution needed to be exercised |
Credit not
recommended |
|
-- |
NB |
New Business |
-- |
This score serves as a reference to assess SC’s credit risk and
to set the amount of credit to be extended. It is calculated from a composite
of weighted scores obtained from each of the major sections of this report. The
assessed factors and their relative weights (as indicated through %) are as
follows:
Financial
condition (40%) Ownership
background (20%) Payment
record (10%)
Credit history
(10%) Market trend
(10%) Operational
size (10%)
This report is issued at your request without any
risk and responsibility on the part of MIRA INFORM PRIVATE LIMITED (MIPL)
or its officials.