![]()
1. Summary Information
|
|
|
Country |
|
|
Company Name |
Jotun Powder Coatings India Private Limited is amalgamated with Jotun
India Private Limited |
Principal Name 1 |
Mr. Esben Hersve |
|
Status |
Moderate |
Principal Name 2 |
Mr. Richard Roger Chapman |
|
|
|
Registration # |
11-160431 |
|
Street Address |
502, 5th Floor, |
||
|
Established Date |
10.03.2006 |
SIC Code |
-- |
|
Telephone# |
91-22-28224600 / 67872100 / 26848932 |
Business Style 1 |
Manufacturer |
|
Fax # |
91-22-28205900 / 26848920 |
Business Style 2 |
Exporter |
|
Homepage |
Product Name 1 |
Liquid Paints |
|
|
# of employees |
400
(Approximately) |
Product Name 2 |
Powder Coatings |
|
Paid up capital |
Rs. 1430,417,000/- |
Product Name 3 |
-- |
|
Shareholders |
Foreign holdings – 100% |
Banking |
CITI Bank |
|
Public Limited Corp. |
No |
Business Period |
8 years |
|
IPO |
No |
International Ins. |
-- |
|
Public Enterprise |
No |
Rating |
B
(26) |
|
Related
Company |
|||
|
Relation
|
Country
|
Company
Name |
CEO |
|
Holding
Company |
Norway |
Jotun AS |
-- |
|
Note |
-- |
||
2. Summary
Financial Statement
|
Balance Sheet as of |
31.03.2013 |
(Unit: Indian Rs.) |
|
|
Assets |
Liabilities |
||
|
Current Assets |
1882,283,000 |
Current Liabilities |
719,024,000 |
|
Inventories |
656,419,000 |
Long-term Liabilities |
1660,163,000 |
|
Fixed Assets |
626,036,000 |
Other Liabilities |
41,127,000 |
|
Deferred Assets |
0,000 |
Total Liabilities |
2420,314,000 |
|
Invest& other Assets |
84,041,000 |
Retained Earnings |
(601,952,000) |
|
|
|
Net Worth |
828,465,000 |
|
Total Assets |
3248,779,000 |
Total Liab. & Equity |
3248,779,000 |
|
Total Assets (Previous Year) |
3,047,931,000 |
|
|
|
P/L Statement as of |
31.03.2013 |
(Unit: Indian Rs.) |
|
|
Sales |
2802,364,000 |
Net Profit/ (Loss) |
(461,899,000) |
|
Sales(Previous yr) |
3,045,444,000 |
Net Profit
/ (Loss) (Prev.yr) |
(410,212,000) |
|
Report Date : |
12.08.2014 |
IDENTIFICATION DETAILS
|
Name : |
JOTUN INDIA PRIVATE LIMITED JOTUN POWDER COATINGS INDIA PRIVATE LIMITED IS AMALGAMATED WITH JOTUN
INDIA PRIVATE LIMITED |
|
|
|
|
Registered
Office : |
502, 5th Floor, |
|
|
|
|
Country : |
India |
|
|
|
|
Financials (as
on) : |
31.03.2013 |
|
|
|
|
Date of
Incorporation : |
10.03.2006 |
|
|
|
|
Com. Reg. No.: |
11-160431 |
|
|
|
|
Capital
Investment / Paid-up Capital : |
Rs. 1430.417
Millions |
|
|
|
|
CIN No.: [Company Identification
No.] |
U24224MH2006PTC160431 |
|
|
|
|
TAN No.: [Tax Deduction &
Collection Account No.] |
MUMJ12022D |
|
|
|
|
PAN No.: [Permanent Account No.] |
AABCJ6665J |
|
|
|
|
Legal Form : |
Private Limited Liability Company |
|
|
|
|
Line of Business
: |
Manufacturer of Liquid Paints and Powder Coatings. |
|
|
|
|
No. of Employees
: |
400 (Approximately) |
RATING & COMMENTS
|
MIRA’s Rating : |
B (26) |
|
RATING |
STATUS |
PROPOSED CREDIT LINE |
|
|
26-40 |
B |
Capability to overcome financial difficulties seems comparatively
below average. |
Small |
|
Maximum Credit Limits: |
USD 3400000 |
|
|
|
|
Status : |
Moderate |
|
|
|
|
Payment Behaviour : |
Slow but correct |
|
|
|
|
Litigation : |
Clear |
|
|
|
|
Comments : |
Subject is an established company having a moderate track record. There seems huge accumulated losses recorded by the company. However, trade relation are fair. Business is active. Payment terms
are slow but correct. The company can be considered for business dealing with some
caution. |
NOTES :
Any query related to this report can be made
on e-mail : infodept@mirainform.com
while quoting report number, name and date.
ECGC Country Risk Classification List – June 1, 2014
|
Country Name |
Previous Rating (31.03.2014) |
Current Rating (01.06.2014) |
|
India |
A1 |
A1 |
|
Risk Category |
ECGC
Classification |
|
Insignificant |
A1 |
|
Low |
A2 |
|
Moderate |
B1 |
|
High |
B2 |
|
Very High |
C1 |
|
Restricted |
C2 |
|
Off-credit |
D |
INDIAN ECONOMIC OVERVIEW
NEWS
As per the latest IMF study, the total weigh of emerging markets in the
GDP of the world on a purchasing power parity basis has seen a sizeable shift.
It highlights how as against 51 % in 2005, the emerging economies now account
for close to 56 % of the global purchasing power GDP as per the latest survey.
And with the emerging economies growing at a faster rate than their developed
counterparts, there are every possibility that the their share goes up further
in the coming years. China may surpass the US over the next few years.
Politics and economics are very intricately connected. They tend to
influence each other in ways that could be very complex and far-reaching. The
prospects of the India’s economy have been seriously compromised due to
political corruption. High inflation, poor standard of living are to a great
extent a result of rampant corruption in the country. China on the other hand,
seems to be facing diametrically opposite challenge. American hedge fund manager
Jim Chanos has been keenly following the political and economic development in
the dragon economy and has figured out something that is quite worrying. He is
of the view that the Chinese economy could be heading toward trouble on account
of new Chinese President Xi Jingping’s very aggressive anti-corruption drive.
Chanos believes tat many things such as apartment sales, luxury products, etc.
were largely bought with dirty money. And it is now beginning to impact
consumption. This may indeed be bad news for an economy that is struggling to
transition from an investment-driven export-oriented economy to a domestic
consumption-driven economy.
A study published by Firstpost has revealed that asset classes like real
estate and equities were the biggest beneficiaries of the liberalization
policies. A firm called Ciane Analytics studied returns from assets
including equities, gold, fixed deposits, G-Secs and real estate since 1991.
Real estate outperformed every other asset classes during the 23-year period
with an annualized return of 20 % ! Equities came in second with annualized
return of 15.5 % ! However, while these returns may seem mouthwatering, the
fact is that the return from equities adjusted for inflation came down to just
7.1 %.
Some brief news are as under
. R-Power to buy Jaypee’s hydro assets
. Investors await justice in NSEL case
. India seeks MFN status from Pakistan ahead of meeting
. Ukrain’s clashes with rebels hinder MH17 crash investigation
. India exploring merger of state-owned hydro PSUs
..Higher costs weigh down profit growth to slowest in 9 quarters
..Wal-Mart to expand wholesale business in India
. GMR group moves to strengthen balance sheet
. Central Bank to sell 4 % stake to Life Insurance Corporation
. Tata Chemicals plans to raise up to Rs 10000 mn.
RBI DEFAULTERS’ LIST STATUS
Subject’s name is not enlisted as a defaulter
in the publicly available RBI Defaulters’ list.
EPF (Employee Provident Fund) DEFAULTERS’ LIST STATUS
Subject’s name is not enlisted as a defaulter
in the publicly available EPF (Employee Provident Fund) Defaulters’ list as of
31-03-2014.
INFORMATION DECLINED
Management Non-Cooperative
Contact No.: 91-22-28224600
LOCATIONS
|
Registered Office : |
502, 5th Floor, |
|
Tel No.: |
91-22-28224600 / 67872100 / 26848932 |
|
Fax No.: |
91-22-28205900 / 26848920 |
|
E-Mail : |
|
|
Website : |
|
|
|
|
|
Factory : |
D- 280, MIDC, Ranjangaon, Shirur, Pune – 419204, |
|
Tel. No.: |
91-2138-671300 / 230300 |
|
Fax No.: |
91-2138-671399 / 230399 |
|
E-Mail : |
|
|
|
|
|
Warehouse : |
Located at: · Bhiwandi |
|
|
|
|
Sales Office : |
|
|
Tel No.: |
91-44-28419420/ 28510861 |
|
Fax No.: |
91-44-28419513 |
|
Email : |
|
|
|
|
|
Branch Office : |
Located at · Surat Delhi Chennai |
DIRECTORS
AS ON 27.09.2013
|
Name : |
Mr. Esben Hersve |
|
Designation : |
Director |
|
Address : |
Orneveien17,
Sadefjord, 003209, Norway |
|
Date of Birth/Age : |
27.06.1960 |
|
Qualification : |
Bachelor Degree
In International Management (BI) |
|
Date of Appointment : |
06.06.2007 |
|
DIN No.: |
02012551 |
|
|
|
|
Name : |
Mr. Richard Roger Chapman |
|
Designation : |
Director |
|
Address : |
6a, Sudbrooke
Road, Scothern, Lincoln, Ln2 2uz, London, United Kingdom |
|
Date of Birth/Age : |
27.04.1966 |
|
Date of Appointment : |
26.03.2013 |
|
DIN No.: |
06520916 |
|
|
|
|
Name : |
Mr. Baard Tonning |
|
Designation : |
Director |
|
Address : |
Frydenlund, 24
D, 3238 Sandefjord, Norway, Norway |
|
Date of Birth/Age : |
26.05.1968 |
|
Date of Appointment : |
26.03.2013 |
|
DIN No.: |
06530790 |
|
|
|
|
Name : |
Mr. Peder Anders Bohlin |
|
Designation : |
Director |
|
Address : |
Villa No. 12,
Street 51, Off Beach Road, Jumeirah,, Dubai, United Arab Emirates, Dubai,
United Arab Emirates |
|
Date of Birth/Age : |
02.06.1952 |
|
Date of Appointment : |
26.03.2013 |
|
DIN No.: |
06536797 |
KEY EXECUTIVES
|
Name : |
Ms. Flora Das |
|
Designation : |
Secretary |
|
Address : |
C/201, Laxmi Narayan Apartment, Jesal Park, Bhayendar, Mumbai -
401105, Maharashtra, India |
|
Date of Birth/Age : |
19.08.1986 |
|
Date of Appointment : |
12.03.2012 |
|
PAN No.: |
ALXPD8563B |
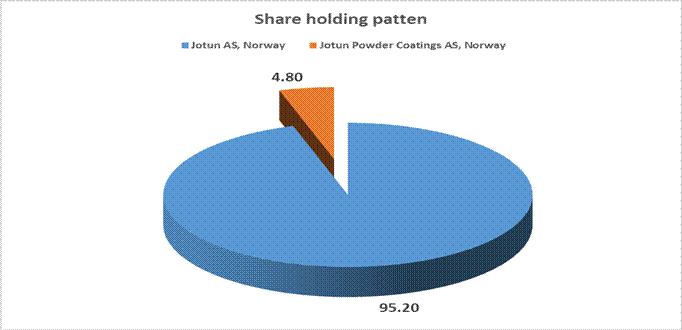
MAJOR SHAREHOLDERS / SHAREHOLDING PATTERN
AS ON 27.09.2013
|
Names of Shareholders |
No. of Shares |
% age |
|
Jotun AS, Norway |
136181668 |
95.20 |
|
Jotun Powder Coatings AS, Norway |
6860000 |
4.80 |
|
TOTAL
|
143041668 |
100.00 |
Equity Share Break up (Percentage of Total Equity)
AS ON 27.09.2013
|
Category |
Percentage |
|
Foreign holdings( Foreign institutional investor(s),
Foreign companie(s) Foreign financial institution(s), Non-resident Indian(s)
or Overseas Corporate bodies or Others |
100.00 |
|
Total |
100.00 |
BUSINESS DETAILS
|
Line of Business : |
Manufacturer of Liquid Paints and Powder Coatings. |
||||||
|
|
|
||||||
|
Products : |
|
||||||
|
|
|
PRODUCTION STATUS (AS ON 31.03.2011)
|
Particulars |
Unit |
Installed
Capacity |
Actual
Production |
|
Paint |
Ltrs |
16,000,000 |
10,399,271 |
|
Powder |
Kgs |
4,000,000 |
2,872,540 |
NOTE
Licensed capacity
for the product manufactured by the company is not mandated and hence not
disclosed. Installed Capacity as stated above is as per management estimate and
has not been verified by auditor as same being technical matter.
GENERAL INFORMATION
|
No. of Employees : |
400 (Approximately) |
|
|
|
|
Bankers : |
CITI Bank N.A., CITI Group Centre, Bandra Kurla Complex, Bandra (East),
Mumbai – 400051, Maharashtra, India |
|
|
|
|
Banking
Relations : |
-- |
|
|
|
|
Auditors : |
|
|
Name : |
S. R. Batliboi and Company Chartered Accountants |
|
Address : |
14th Floor,
The Ruby, 29 Senapati Bapat Marg, Dadar (West), Mumbai – 400028, Maharashtra,
India |
|
PAN N Income-tax PAN of auditor or auditor's firm : |
AALFS0506L |
|
|
|
|
Holding company: |
·
Jotun AS, Norway |
|
|
|
|
Fellow
Subsidiary company: |
·
Jotun Singapore Pte. Limited ·
Jotun Australia Pty. Limited ·
Jotun Abu Dhabi Limited. (L.L.C.) ·
Jotun Paints Europe Limited. ·
Jotun (Malaysia) Sdn. Bhd ·
Jotun Powder Coatings (M) Sdn Bhd ·
Jotun Paints (Vietnam) Company Limited ·
Jotun Thailand Limited ·
Jotun U.A.E. Limited (L.L.C.) ·
Jotun F.Z.E. ·
Jotun Cosco Marine Coatings (HK) Company Limited ·
Jotun Italia S.p.A ·
El-Mohandes Jotun Egypt (S.A.E.) ·
Chokwang Jotun Limited ·
Jotun Paints South Africa (Pty) Limited ·
Jotun Powder Coatings (Thailand) Limited ·
Jotun Powder Coatings UAE Limited (L.L.C.) ·
Jotun Cosco Marine Coatings (GZ) Company Limited ·
Jotun Coatings (Zhangjiagang) Company Limited ·
Jotun Paints Company. L.L.C ·
Jotun Danmark A/S ·
Jotun Powder Coatings (N) AS ·
Jotun Brasil Imp.Exp and Industria de Tintas Ltda ·
P.T. Jotun Indonesia ·
Jotun Boya San. Ve Tic A.S ·
Jotun Saudia Company Limited ·
Jotun Iberica S.A. ·
Jotun Powder Coatings Saudi Arabia Company
Limited ·
Jotun (Phillipines) Inc ·
Jotun Paints, Inc. ·
Jotun Cosco Marine Coatings (Qingdio) Company
Limited ·
Jotun Hellas Limited ·
Nor-Maali OY (Jotun Finland) ·
Jotun Sverige AB |
CAPITAL STRUCTURE
AFTER 27.09.2013
Authorised Capital : Rs.2000.000 Millions
Issued, Subscribed & Paid-up Capital : Rs. 1697.083
Millions
AS ON 31.03.2013
Authorised Capital :
|
No. of Shares |
Type |
Value |
Amount |
|
|
|
|
|
|
150000000 |
Equity Shares |
Rs.10/- each |
Rs. 1500.000 Millions |
|
|
|
|
|
Issued, Subscribed & Paid-up Capital :
|
No. of Shares |
Type |
Value |
Amount |
|
|
|
|
|
|
143041668 |
Equity Shares |
Rs.10/- each |
Rs. 1430.417
Millions |
|
|
|
|
|
FINANCIAL DATA
[all figures are
in Rupees Millions]
ABRIDGED BALANCE
SHEET
|
SOURCES OF FUNDS |
|
|
31.03.2013 |
|
I.
EQUITY
AND LIABILITIES |
|
|
|
|
(1)Shareholders' Funds |
|
|
|
|
(a) Share Capital |
|
|
1430.417 |
|
(b) Reserves & Surplus |
|
|
(601.952) |
|
(c) Money
received against share warrants |
|
|
0.000 |
|
|
|
|
|
|
(2) Share Application money pending allotment |
|
|
0.000 |
|
Total Shareholders’
Funds (1) + (2) |
|
|
828.465 |
|
|
|
|
|
|
(3)
Non-Current Liabilities |
|
|
|
|
(a) long-term borrowings |
|
|
868.320 |
|
(b) Deferred tax liabilities (Net) |
|
|
0.000 |
|
(c) Other long term liabilities |
|
|
8.086 |
|
(d) long-term provisions |
|
|
5.705 |
|
Total Non-current Liabilities (3) |
|
|
882.111 |
|
|
|
|
|
|
(4) Current Liabilities |
|
|
|
|
(a) Short term borrowings |
|
|
791.843 |
|
(b) Trade payables |
|
|
491.968 |
|
(c) Other current
liabilities |
|
|
227.056 |
|
(d) Short-term provisions |
|
|
27.336 |
|
Total Current Liabilities (4) |
|
|
1538.203 |
|
|
|
|
|
|
TOTAL |
|
|
3248.779 |
|
|
|
|
|
|
II.
ASSETS |
|
|
|
|
(1) Non-current assets |
|
|
|
|
(a) Fixed Assets |
|
|
|
|
(i) Tangible assets |
|
|
622.464 |
|
(ii) Intangible Assets |
|
|
3.572 |
|
(iii) Capital
work-in-progress |
|
|
84.041 |
|
(iv)
Intangible assets under development |
|
|
0.000 |
|
(b) Non-current Investments |
|
|
0.000 |
|
(c) Deferred tax assets (net) |
|
|
0.000 |
|
(d) Long-term Loan and Advances |
|
|
50.404 |
|
(e) Other Non-current assets |
|
|
0.098 |
|
Total Non-Current Assets |
|
|
760.579 |
|
|
|
|
|
|
(2) Current assets |
|
|
|
|
(a) Current investments |
|
|
0.000 |
|
(b) Inventories |
|
|
656.419 |
|
(c) Trade receivables |
|
|
1129.263 |
|
(d) Cash and cash
equivalents |
|
|
494.328 |
|
(e) Short-term loans and
advances |
|
|
207.556 |
|
(f) Other current assets |
|
|
0.634 |
|
Total Current Assets |
|
|
2488.200 |
|
|
|
|
|
|
TOTAL |
|
|
3248.779 |
|
SOURCES OF FUNDS |
|
31.03.2012 |
31.03.2011 |
|
|
SHAREHOLDERS FUNDS |
|
|
|
|
|
1] Share Capital |
|
1111.817 |
1111.817 |
|
|
2] Share Application Money |
|
68.600 |
0.000 |
|
|
3] Reserves & Surplus |
|
(640.053) |
(229.840) |
|
|
4] (Accumulated Losses) |
|
0.000 |
0.000 |
|
|
NETWORTH |
|
540.364 |
881.977 |
|
|
LOAN FUNDS |
|
|
|
|
|
1] Secured Loans |
|
0.000 |
80.000 |
|
|
2] Unsecured Loans |
|
1699.726 |
790.228 |
|
|
TOTAL BORROWING |
|
1699.726 |
870.228 |
|
|
DEFERRED TAX LIABILITIES |
|
0.000 |
0.000 |
|
|
|
|
|
|
|
|
TOTAL |
|
2240.090 |
1752.205 |
|
|
|
|
|
|
|
|
APPLICATION OF FUNDS |
|
|
|
|
|
|
|
|
|
|
|
FIXED ASSETS [Net Block] |
|
710.204 |
717.053 |
|
|
Capital work-in-progress |
|
6.894 |
1.418 |
|
|
|
|
|
|
|
|
INVESTMENT |
|
0.000 |
0.000 |
|
|
DEFERREX TAX ASSETS |
|
0.000 |
0.000 |
|
|
|
|
|
|
|
|
CURRENT ASSETS, LOANS & ADVANCES |
|
|
|
|
|
|
Inventories |
|
904.192
|
595.697
|
|
|
Sundry Debtors |
|
1068.074
|
765.472
|
|
|
Cash & Bank Balances |
|
61.251
|
177.263
|
|
|
Other Current Assets |
|
0.239
|
0.811
|
|
|
Loans & Advances |
|
297.077
|
199.202
|
|
Total
Current Assets |
|
2330.833
|
1738.445 |
|
|
Less : CURRENT
LIABILITIES & PROVISIONS |
|
|
|
|
|
|
Sundry Creditors |
|
572.429
|
509.813
|
|
|
Other Current Liabilities |
|
182.488
|
170.907
|
|
|
Provisions |
|
52.924
|
23.991
|
|
Total
Current Liabilities |
|
807.841
|
704.711 |
|
|
Net Current Assets |
|
1522.992
|
1033.734
|
|
|
|
|
|
|
|
|
MISCELLANEOUS EXPENSES |
|
0.000 |
0.000 |
|
|
|
|
|
|
|
|
TOTAL |
|
2240.090 |
1752.205 |
|
PROFIT & LOSS
ACCOUNT
|
|
PARTICULARS |
31.03.2013 |
31.03.2012 |
31.03.2011 |
|
|
|
SALES |
|
|
|
|
|
|
|
Income |
2802.364 |
3045.444 |
2567.053 |
|
|
|
Other Income |
151.829 |
8.240 |
5.560 |
|
|
|
TOTAL |
2954.193 |
3053.684 |
2572.613 |
|
|
|
|
|
|
|
|
Less |
EXPENSES |
|
|
|
|
|
|
|
Expenses including Depreciation |
|
|
|
|
|
|
Prior Period Adjustment for communication expenses |
|
|
|
|
|
|
TOTAL |
3119.619 |
3212.197 |
2598.251 |
|
|
|
|
|
|
|
|
|
PROFIT
/ (LOSS) BEFORE TAX, DEPRECIATION |
(165.456) |
(158.513) |
(25.638) |
|
|
|
|
|
|
|
|
|
Less |
DEPRECIATION |
296.443 |
249.846 |
212.808 |
|
|
|
|
|
|
|
|
|
|
PROFIT / (LOSS)
BEFORE TAX AND AMALGAMATION ADJUSTMENT |
(461.899) |
(408.359) |
(238.446) |
|
|
|
|
|
|
|
|
|
|
AMALGAMATION
ADJUSTMENT |
0.000 |
(1.853) |
0.000 |
|
|
|
|
|
|
|
|
|
|
PROFIT / (LOSS)
BEFORE TAX |
(461.899) |
(410.212) |
(238.446) |
|
|
|
|
|
|
|
|
|
Less |
TAX |
0.000 |
0.000 |
0.000 |
|
|
|
|
|
|
|
|
|
|
PROFIT / (LOSS)
AFTER TAX |
(461.899) |
(410.212) |
(238.446) |
|
|
|
|
|
|
|
|
|
Add |
PREVIOUS
YEARS’ BALANCE BROUGHT FORWARD |
(1487.426) |
(1077.214) |
(838.768) |
|
|
|
|
|
|
|
|
|
|
BALANCE CARRIED
TO THE B/S |
NA |
(1487.426) |
(1077.214) |
|
|
|
|
|
|
|
|
|
|
EARNINGS IN
FOREIGN CURRENCY |
|
|
|
|
|
|
|
Exports (FOB) |
NA |
19.531 |
29.541 |
|
|
|
Sales Support Fee |
NA |
1.312 |
8.921 |
|
|
|
Rental income assets |
NA |
1.193 |
1.711 |
|
|
|
Technical service fees |
NA |
0.182 |
0.787 |
|
|
TOTAL EARNINGS |
NA |
22.218 |
40.960 |
|
|
|
|
|
|
|
|
|
|
IMPORTS |
|
|
|
|
|
|
|
Capital Goods |
NA |
4.103 |
7.184 |
|
|
|
Raw Materials |
NA |
1394.877 |
913.628 |
|
|
|
Traded Goods |
NA |
204.149 |
138.693 |
|
|
TOTAL IMPORTS |
NA |
1603.129 |
1059.505 |
|
|
|
|
|
|
|
|
|
|
Earnings Per
Share (Rs.) |
(3.23) |
(3.48) |
(2.50) |
|
KEY RATIOS
|
PARTICULARS |
|
31.03.2013 |
31.03.2012 |
31.03.2011 |
|
PAT / Total Income |
(%) |
(15.64)
|
(13.43) |
(9.27) |
|
|
|
|
|
|
|
Net Profit Margin (PBT/Sales) |
(%) |
(16.48)
|
(13.47) |
(9.29) |
|
|
|
|
|
|
|
Return on Total Assets (PBT/Total Assets} |
(%) |
(14.60)
|
(13.49) |
(9.71) |
|
|
|
|
|
|
|
Return on Investment (ROI) (PBT/Networth) |
|
(0.56)
|
(0.76) |
(0.27) |
|
|
|
|
|
|
|
Debt Equity Ratio (Total Debt /Networth) |
|
2.00
|
3.15 |
0.99 |
|
|
|
|
|
|
|
Current Ratio (Current Asset/Current Liability) |
|
1.62
|
2.89
|
2.47 |
FINANCIAL ANALYSIS
[all figures are
in Rupees Millions]
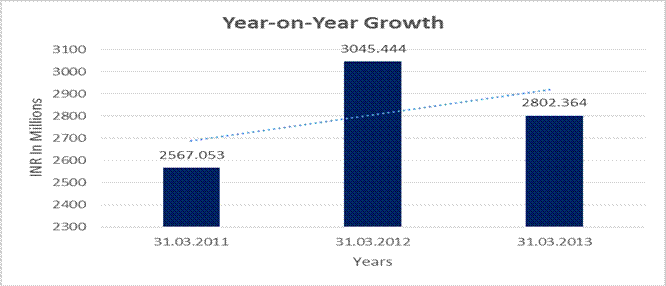
YEAR-ON-YEAR GROWTH
|
Year
on Year Growth |
31.03.2011 |
31.03.2012 |
31.03.2013 |
|
|
(Rs.
In Millions) |
(Rs.
In Millions) |
(Rs.
In Millions) |
|
Income |
2567.053 |
3045.444 |
2802.364 |
|
|
|
18.636 |
(7.982) |
NET PROFIT MARGIN
|
Net
Profit Margin |
31.03.2011 |
31.03.2012 |
31.03.2013 |
|
|
(Rs.
In Millions) |
(Rs.
In Millions) |
(Rs.
In Millions) |
|
Income |
2567.053 |
3045.444 |
2802.364 |
|
Profit/(Loss) After Tax |
(238.446) |
(410.212) |
(461.899) |
|
|
(9.29%) |
(13.47%) |
(16.48%) |
LOCAL AGENCY FURTHER INFORMATION
|
Sr. No. |
Check List by Info Agents |
Available in
Report (Yes / No) |
|
1] |
Year of Establishment |
Yes |
|
2] |
Locality of the firm |
Yes |
|
3] |
Constitutions of the firm |
Yes |
|
4] |
Premises details |
No |
|
5] |
Type of Business |
Yes |
|
6] |
Line of Business |
Yes |
|
7] |
Promoter's background |
Yes |
|
8] |
No. of employees |
No |
|
9] |
Name of person contacted |
No |
|
10] |
Designation of contact
person |
No |
|
11] |
Turnover of firm for last
three years |
Yes |
|
12] |
Profitability for last
three years |
Yes |
|
13] |
Reasons for variation
<> 20% |
-- |
|
14] |
Estimation for coming
financial year |
No |
|
15] |
Capital in the business |
Yes |
|
16] |
Details of sister
concerns |
Yes |
|
17] |
Major suppliers |
No |
|
18] |
Major customers |
No |
|
19] |
Payments terms |
Yes |
|
20] |
Export / Import details (if
applicable) |
Yes |
|
21] |
Market information |
-- |
|
22] |
Litigations that the firm
/ promoter involved in |
-- |
|
23] |
Banking Details |
Yes |
|
24] |
Banking facility details |
Yes |
|
25] |
Conduct of the banking
account |
-- |
|
26] |
Buyer visit details |
-- |
|
27] |
Financials, if provided |
Yes |
|
28] |
Incorporation details, if
applicable |
Yes |
|
29] |
Last accounts filed at
ROC |
Yes |
|
30] |
Major Shareholders, if
available |
Yes |
|
31] |
Date of Birth of Proprietor/Partner/Director,
if available |
Yes |
|
32] |
PAN of
Proprietor/Partner/Director, if available |
No |
|
33] |
Voter ID No of
Proprietor/Partner/Director, if available |
No |
|
34] |
External Agency Rating,
if available |
No |
PERFORMANCE
At macro level,
the year was a challenging for the country due to tough market conditions,
falling rupee and the cascading effect is on local manufacturers in India in terms
of increase in cost of input materials and services. Key reason for lowered
performance of the company is delays in major projects in market. Depreciation
of Indian Rupee is compounding the problem and increases the cost of input
materials and services. This triggered increase of finished goods prices across
all segments. Despite these factors, they are deploying our resources in the
best possible way to increase the volumes and the Management is confident that
the company will improve its performance significantly in the coming years.
CORPORATE INFORMATION
Subject was
incorporated on 10th March, 2006 as a subsidiary of Jotun AS, Norway (or 'the
holding Company'). The Company is into operation of manufacturing Liquid Paints
and Powder Coatings.
UNSECURED LOAN
|
PARTICULARS |
31.03.2013 (Rs.
in Millions) |
31.03.2012 (Rs.
in Millions) |
|
Long-term
Borrowings |
|
|
|
Borrowing from foreign institutional
agencies |
868.320 |
457.380 |
|
Short-term
borrowings |
|
|
|
Working capital loans from banks |
730.000 |
1104.000 |
|
Other loans and advances, others |
61.843 |
138.346 |
|
Total |
1660.163 |
1699.726 |
INDEX OF CHARGES
|
S.NO. |
CHARGE ID |
DATE OF CHARGE
CREATION/MODIFICATION |
CHARGE AMOUNT
SECURED |
CHARGE HOLDER |
ADDRESS |
SERVICE REQUEST
NUMBER (SRN) |
|
1 |
10123388 |
04/08/2008 |
350,000,000.00 |
CITIBANK N.A. |
CITIGROUP
CENTRE, BANDRA KURLA COMPLEX, BANDRA (EAST), MUMBAI, MAHARASHTRA - 400051,
INDIA |
A45588142 |
|
2 |
90384114 |
21/07/2005 |
22,900,000.00 |
CITI BANK N.A. |
MUMBAI, MUMBAI,
MAHARASHTRA, INDIA |
- |
|
3 |
90372082 |
21/07/2005 |
22,900,000.00 |
CITI BANK N.A. |
MUMBAI, MUMBAI,
MAHARASHTRA, INDIA |
- |
|
4 |
90384084 |
09/10/1999 |
700,000.00 |
UNION BANK OF INDIA |
CHANDRA
SEKKARPUR BRANCH, BHUBNESHWAR, ORISSA, INDIA |
- |
FIXED ASSETS
Tangible Assets
·
Land
·
Buildings
·
Plant and equipment
·
Furniture and fixtures
·
Office equipment
·
Leasehold improvements
Intangible assets
·
Goodwill
·
Computer software
CMT REPORT (Corruption, Money Laundering & Terrorism]
The Public Notice information has been collected from various sources
including but not limited to: The Courts,
1] INFORMATION ON
DESIGNATED PARTY
No exist designating subject or any of its beneficial owners,
controlling shareholders or senior officers as terrorist or terrorist
organization or whom notice had been received that all financial transactions
involving their assets have been blocked or convicted, found guilty or against
whom a judgement or order had been entered in a proceedings for violating
money-laundering, anti-corruption or bribery or international economic or
anti-terrorism sanction laws or whose assets were seized, blocked, frozen or ordered
forfeited for violation of money laundering or international anti-terrorism
laws.
2] Court Declaration :
No exist to suggest that subject is or was
the subject of any formal or informal allegations, prosecutions or other official
proceeding for making any prohibited payments or other improper payments to
government officials for engaging in prohibited transactions or with designated
parties.
3] Asset Declaration :
No records exist to suggest that the property or assets of the subject
are derived from criminal conduct or a prohibited transaction.
4] Record on Financial
Crime :
Charges or conviction
registered against subject: None
5] Records on Violation of
Anti-Corruption Laws :
Charges or investigation
registered against subject: None
6] Records on Int’l
Anti-Money Laundering Laws/Standards :
Charges or
investigation registered against subject: None
7] Criminal Records
No
available information exist that suggest that subject or any of its principals
have been formally charged or convicted by a competent governmental authority
for any financial crime or under any formal investigation by a competent
government authority for any violation of anti-corruption laws or international
anti-money laundering laws or standard.
8] Affiliation with
Government :
No record
exists to suggest that any director or indirect owners, controlling
shareholders, director, officer or employee of the company is a government
official or a family member or close business associate of a Government
official.
9] Compensation Package :
Our market
survey revealed that the amount of compensation sought by the subject is fair
and reasonable and comparable to compensation paid to others for similar
services.
10] Press Report :
No press reports / filings exists on
the subject.
CORPORATE GOVERNANCE
MIRA INFORM as part of its Due Diligence do provide comments on
Corporate Governance to identify management and governance. These factors often
have been predictive and in some cases have created vulnerabilities to credit
deterioration.
Our Governance Assessment focuses principally on the interactions
between a company’s management, its Board of Directors, Shareholders and other
financial stakeholders.
CONTRAVENTION
Subject is not known to have contravened any existing local laws,
regulations or policies that prohibit, restrict or otherwise affect the terms
and conditions that could be included in the agreement with the subject.
FOREIGN EXCHANGE RATES
|
Currency |
Unit
|
Indian Rupees |
|
US Dollar |
1 |
Rs. 61.12 |
|
|
1 |
Rs. 103.54 |
|
Euro |
1 |
Rs. 81.87 |
INFORMATION DETAILS
|
Information
Gathered by : |
PRT |
|
|
|
|
Analysis Done by
: |
RAS |
|
|
|
|
Report Prepared by
: |
SNT |
SCORE & RATING EXPLANATIONS
|
SCORE FACTORS |
RANGE |
POINTS |
|
HISTORY |
1~10 |
3 |
|
PAID-UP CAPITAL |
1~10 |
3 |
|
OPERATING SCALE |
1~10 |
3 |
|
FINANCIAL CONDITION |
|
|
|
--BUSINESS SCALE |
1~10 |
3 |
|
--PROFITABILIRY |
1~10 |
2 |
|
--LIQUIDITY |
1~10 |
3 |
|
--LEVERAGE |
1~10 |
3 |
|
--RESERVES |
1~10 |
3 |
|
--CREDIT LINES |
1~10 |
3 |
|
--MARGINS |
-5~5 |
-- |
|
DEMERIT POINTS |
|
|
|
--BANK CHARGES |
YES/NO |
YES |
|
--LITIGATION |
YES/NO |
NO |
|
--OTHER ADVERSE INFORMATION |
YES/NO |
NO |
|
MERIT POINTS |
|
|
|
--SOLE DISTRIBUTORSHIP |
YES/NO |
NO |
|
--EXPORT ACTIVITIES |
YES/NO |
YES |
|
--AFFILIATION |
YES/NO |
YES |
|
--LISTED |
YES/NO |
NO |
|
--OTHER MERIT FACTORS |
YES/NO |
YES |
|
DEFAULTER |
|
|
|
--RBI |
YES/NO |
NO |
|
--EPF |
YES/NO |
NO |
|
TOTAL |
|
26 |
This score serves as a reference to assess SC’s credit risk
and to set the amount of credit to be extended. It is calculated from a
composite of weighted scores obtained from each of the major sections of this
report. The assessed factors and their relative weights (as indicated through
%) are as follows:
Financial
condition (40%) Ownership
background (20%) Payment
record (10%)
Credit history
(10%) Market trend
(10%) Operational
size (10%)
RATING EXPLANATIONS
|
RATING |
STATUS |
PROPOSED CREDIT LINE |
|
|
>86 |
Aaa |
Possesses an extremely sound financial base with the strongest
capability for timely payment of interest and principal sums |
Unlimited |
|
71-85 |
Aa |
Possesses adequate working capital. No caution needed for credit
transaction. It has above average (strong) capability for payment of interest
and principal sums |
Large |
|
56-70 |
A |
Financial & operational base are regarded healthy. General unfavourable
factors will not cause fatal effect. Satisfactory capability for payment of
interest and principal sums |
Fairly Large |
|
41-55 |
Ba |
Overall operation is considered normal. Capable to meet normal
commitments. |
Satisfactory |
|
26-40 |
B |
Capability to overcome financial difficulties seems comparatively
below average. |
Small |
|
11-25 |
Ca |
Adverse factors are apparent. Repayment of interest and principal sums
in default or expected to be in default upon maturity |
Limited with full
security |
|
<10 |
C |
Absolute credit risk exists. Caution needed to be exercised |
Credit not
recommended |
|
-- |
NB |
New Business |
-- |
This report is issued at your request without any
risk and responsibility on the part of MIRA INFORM PRIVATE LIMITED (MIPL) or
its officials.