![]()
|
Report Date : |
12.08.2014 |
IDENTIFICATION DETAILS
|
Name : |
REPSOL QUIMICA SA |
|
|
|
|
Registered Office : |
C/ Mendez Alvaro, 44. - |
|
|
|
|
Country : |
|
|
|
|
|
Financials (as on) : |
31.12.2012 |
|
|
|
|
Date of Incorporation : |
23.09.1963 |
|
|
|
|
Legal Form : |
Public Company |
|
|
|
|
Line of Business : |
· Manufacture of plastics in primary forms · Subject is engaged in the manufacture of chemicals derived from petroleum |
|
|
|
|
No. of Employees : |
1210 |
RATING & COMMENTS
|
MIRA’s Rating : |
B |
|
RATING |
STATUS |
PROPOSED CREDIT LINE |
|
|
26-40 |
B |
Capability to overcome financial difficulties seems comparatively
below average. |
Small |
|
Status : |
Moderate |
|
Payment Behaviour : |
Slow but correct |
|
Litigation : |
Clear |
NOTES :
Any query related to this report can be made
on e-mail : infodept@mirainform.com
while quoting report number, name and date.
ECGC Country Risk Classification List – June 1, 2014
|
Country Name |
Previous Rating (31.03.2014) |
Current Rating (01.06.2014) |
|
Spain |
A2 |
A2 |
|
Risk Category |
ECGC
Classification |
|
Insignificant |
A1 |
|
Low |
A2 |
|
Moderate |
B1 |
|
High |
B2 |
|
Very High |
C1 |
|
Restricted |
C2 |
|
Off-credit |
D |
SPAIN - ECONOMIC OVERVIEW
After almost 15 years of above average GDP growth, the Spanish economy began to slow in late 2007 and entered into a recession in the second quarter of 2008. GDP contracted by 3.7% in 2009, ending a 16-year growth trend, and by another 0.3% in 2010; GDP expanded 0.4% in 2011, before contracting 1.4% in 2012. The economy has once again fallen into recession as deleveraging in the private sector, fiscal consolidation, and continued high unemployment weigh on domestic demand and investment, even as exports have shown signs of resiliency. The unemployment rate rose from a low of about 8% in 2007 to 26.0% in 2012. The economic downturn has also hurt Spain's public finances. The government budget deficit peaked at 11.2% of GDP in 2010 and the process to reduce this imbalance has been slow despite the central government's efforts to raise new tax revenue and cut spending. Spain reduced its budget deficit to 9.4% of GDP in 2011, and roughly 7.4% of GDP in 2012, above the 6.3% target negotiated between Spain and the EU. Although Spain''s large budget deficit and poor economic growth prospects remain a source of concern for foreign investors, the government''s ongoing efforts to cut spending and introduce flexibility into the labor markets are intended to assuage these concerns. The government is also taking steps to shore up the banking system, namely by using up to $130 billion in EU funds to recapitalize struggling banks exposed to the collapsed domestic construction and real estate sectors
|
Source
: CIA |
EXECUTIVE SUMMARY
|
Name: |
REPSOL QUIMICA SA |
|
NIF / Fiscal code: |
A28122992 |
|
Status: |
ACTIVE |
|
Incorporation Date: |
23/09/1963 |
|
Register Data |
Register Section 8 Sheet 23221 |
|
Last Publication in BORME: |
18/12/2013 [Appointments] |
|
Last Published Account Deposit: |
2012 |
|
Share Capital: |
60.461.817,70 |
|
|
|
|
Localization: |
C/ MENDEZ ALVARO, 44. - MADRID - 28045 - MADRID |
|
Telephone - Fax - Email - Website: |
Ph.:. 913488000 - 917538100 Website. www.repsol.com |
|
|
|
|
Activity: |
|
|
NACE: |
2016 - Manufacture of plastics in primary forms |
|
Registered Trademarks: |
|
|
Audited / Opinion: |
Si / |
|
Tenders and Awards: |
0 for a total cost of 0 |
|
Subsidies: |
4 for a total cost of 11609000 |
|
Quality Certificate: |
No |
Defaults, Legal Claims and Insolvency Proceedings
|
|
|
|
|
Number |
Amount (€) |
Most Recent Entry |
|
Insolvency Proceedings, Bankruptcy and Suspension of Payments |
|
Unpublished |
--- |
--- |
|
Defaults on debt with Financial Institutions and Large Companies |
|
None |
--- |
--- |
|
Judicial Claims (Notices, Executive Proceedings, Attachments, Auctions, Bad Debt) |
|
1 |
0 |
--- |
|
Proceedings heard by the Civil Court |
|
Unpublished |
0 |
--- |
|
Proceedings heard by the Labour Court |
|
Unpublished |
0 |
--- |
|
|
|
Partners: |
|
|
|
REPSOL SA |
|
|
|
Shares: |
12 |
|
|
Other Links: |
11 |
|
|
No. of Active Corporate Bodies: |
SINGLE ADMINISTRATOR 1 |
|
|
Ratios |
2012 |
2011 |
Change |
|
|
|
|
|
Guarantees: |
|
|
Properties Registered: |
Company NO, Administrator NO |
|
Financing / Guarantee Sources : |
Sources YES, Guarantees YES |
INVESTIGATION SUMMARY
|
It is a large size company engaged in the manufacture of chemicals derived from petroleum. It belongs to an important corporate Group of the petrochemical sector, which has been operating for several years, without incidents. |
identification |
|
|
Social Denomination: |
REPSOL QUIMICA SA |
|
NIF / Fiscal code: |
A28122992 |
|
Corporate Status: |
ACTIVE |
|
Start of activity: |
1963 |
|
Registered Office: |
C/ MENDEZ ALVARO, 44. |
|
Locality: |
MADRID |
|
Province: |
MADRID |
|
Postal Code: |
28045 |
|
Telephone: |
913488000 - 917538100 |
|
Fax: |
913489494 |
|
Website: |
www.repsol.com |
|
Activity |
|
|
NACE: |
2016 |
|
Additional Information: |
Manufacture of chemicals derived from petroleum: copolymers, polyols, polypropylene, polyethylene glycols, and basic petrochemicals. It belongs to the petrochemical group Repsol. |
|
Additional Address: |
Méndez Álvaro 44 28045 Madrid, registered office and central offices, rented. Pso Castellana 280 28046 Madrid, offices, rented. Tarragona 149 08015 Barcelona delegation, rented. Daniel Balaciart 4 46020 Valencia, delegation, rented. Santiago de Compostela 12 48003 Bilbao (Vizcaya), delegation, rented. Lg Complejo Repsol sn 13500 Puertollano (Ciudad Real), chemical plant, believed to be owned by the subject. Afueras sn 43700 El Morell (Tarragona), chemical plant, believed to be owned by the subject. Afueras sn 43152 Perafort (Tarragona), chemical plant, believed to be owned by the subject. |
|
Import / export: |
EXPORTS |
|
Future Perspective: |
Face recession |
|
Industry situation: |
Decline |
Number of Employees |
|
|
|
|
|
|
Year |
No. of employees |
Established |
Incidentals |
|
|
|
2014 |
1210 |
|
|
|
Chronological Summary |
|||
|
|
|
|
|
|
|
Year |
Act |
|
|
|
1990 |
Accounts deposit (ejer. 1989) Appointments/ Re-elections (6) Cessations/ Resignations/ Reversals (9) |
|
|
|
1991 |
Accounts deposit (ejer. 1990) Adaptation to Law (1) Appointments/ Re-elections (16) Cessations/ Resignations/ Reversals (11) Statutory Modifications (1) |
|
|
|
1992 |
Accounts deposit (ejer. 1991) Appointments/ Re-elections (6) Cessations/ Resignations/ Reversals (3) |
|
|
|
1993 |
Accounts deposit (ejer. 1992) Appointments/ Re-elections (24) Cessations/ Resignations/ Reversals (11) Change of Social address (1) Increase of Capital (1) Statutory Modifications (2) |
|
|
|
1994 |
Accounts deposit (ejer. 1993) Appointments/ Re-elections (12) Cessations/ Resignations/ Reversals (10) Increase of Capital (1) Statutory Modifications (1) |
|
|
|
1995 |
Accounts deposit (ejer. 1994) Appointments/ Re-elections (12) Cessations/ Resignations/ Reversals (5) |
|
|
|
1996 |
Accounts deposit (ejer. 1995) Appointments/ Re-elections (12) Cessations/ Resignations/ Reversals (11) |
|
|
|
1997 |
Accounts deposit (ejer. 1996) Appointments/ Re-elections (12) Cessations/ Resignations/ Reversals (5) Statutory Modifications (1) |
|
|
|
1998 |
Accounts deposit (ejer. 1997) Appointments/ Re-elections (15) Cessations/ Resignations/ Reversals (4) |
|
|
|
1999 |
Accounts deposit (ejer. 1998) Appointments/ Re-elections (8) Cessations/ Resignations/ Reversals (4) |
|
|
|
2000 |
Accounts deposit (ejer. 1999) Appointments/ Re-elections (10) Cessations/ Resignations/ Reversals (5) Other Concepts/ Events (1) |
|
|
|
2001 |
Accounts deposit (ejer. 2000) Appointments/ Re-elections (13) Cessations/ Resignations/ Reversals (15) Statutory Modifications (1) |
|
|
|
2002 |
Accounts deposit (ejer. 2001) Appointments/ Re-elections (5) Cessations/ Resignations/ Reversals (4) |
|
|
|
2003 |
Accounts deposit (ejer. 2002) Appointments/ Re-elections (9) Cessations/ Resignations/ Reversals (2) |
|
|
|
2004 |
Accounts deposit (ejer. 2003) Appointments/ Re-elections (14) Cessations/ Resignations/ Reversals (5) |
|
|
|
2005 |
Accounts deposit (ejer. 2004) Appointments/ Re-elections (16) Cessations/ Resignations/ Reversals (7) |
|
|
|
2006 |
Accounts deposit (ejer. 2005) Appointments/ Re-elections (6) |
|
|
|
2007 |
Accounts deposit (ejer. 2006) Appointments/ Re-elections (12) Cessations/ Resignations/ Reversals (5) |
|
|
|
2008 |
Accounts deposit (ejer. 2007) Appointments/ Re-elections (17) Cessations/ Resignations/ Reversals (10) |
|
|
|
2009 |
Appointments/ Re-elections (15) Cessations/ Resignations/ Reversals (5) |
|
|
|
2010 |
Accounts deposit (ejer. 2008, 2009) Appointments/ Re-elections (14) Cessations/ Resignations/ Reversals (9) |
|
|
|
2011 |
Accounts deposit (ejer. 2010) Appointments/ Re-elections (8) Cessations/ Resignations/ Reversals (6) |
|
|
|
2012 |
Accounts deposit (ejer. 2011) Appointments/ Re-elections (5) Cessations/ Resignations/ Reversals (2) Change of Social address (1) Other Concepts/ Events (1) Statutory Modifications (1) |
|
|
|
2013 |
Accounts deposit (ejer. 2012) Appointments/ Re-elections (23) Cessations/ Resignations/ Reversals (7) |
|
Breakdown of Owners' Equity |
|
|
Registered Capital: |
60.461.817,70 |
|
Paid up capital: |
60.461.817,70 |
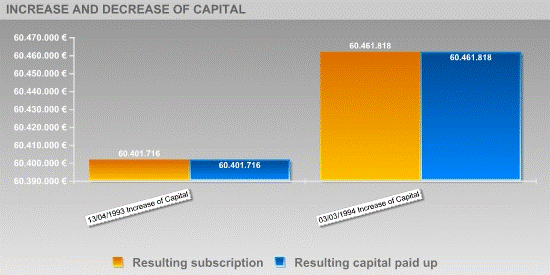
Updated Evolution of the Subscribed and Paid-in Capital
|
|
|||||
|
|
|
|
|
|
|
|
Publishing Date |
Registration Type |
Capital Subscribed |
Paid up capital |
Underwritten result |
Disbursed Result |
|
13/04/1993 |
Increase of Capital |
66.712 |
66.712 |
60.401.716 |
60.401.716 |
|
03/03/1994 |
Increase of Capital |
60.101 |
60.101 |
60.461.818 |
60.461.818 |
Active Social Bodies
|
Post published |
Social Body's Name |
Appointment Date |
Other Positions in this Company |
|
SINGLE ADMINISTRATOR |
IMAZ SAN MIGUEL JOSU JON |
08/02/2013 |
1 |
|
ACCOUNTS' AUDITOR / HOLDER |
DELOITTE SL |
13/08/2013 |
9 |
|
Historical Social Bodies |
|
|
|
|
|
Social Body's Name |
Post published |
End Date |
Other Positions in this Company |
|
ARREGUI JIMENEZ ANDRES |
MEMBER OF THE BOARD |
27/09/1991 |
1 |
|
ARTHUR ANDERSEN Y CIA S COM |
ACCOUNTS' AUDITOR / HOLDER |
09/07/1998 |
6 |
|
|
ACCOUNTS' AUDITOR / HOLDER |
16/07/1999 |
|
|
|
ACCOUNTS' AUDITOR / HOLDER |
25/10/2000 |
|
|
|
ACCOUNTS' AUDITOR / HOLDER |
09/05/2001 |
|
|
|
ACCOUNTS' AUDITOR / HOLDER |
14/06/2002 |
|
|
|
ACCOUNTS' AUDITOR / HOLDER |
23/06/2003 |
|
|
BADOSA PAGES JUAN |
MEMBER OF THE BOARD |
26/04/1993 |
10 |
|
|
MEMBER OF THE BOARD |
16/09/1993 |
|
|
|
MEMBER OF THE BOARD |
02/11/1993 |
|
|
|
MEMBER OF THE BOARD |
03/04/2001 |
|
|
|
MEMBER OF THE BOARD |
24/06/2002 |
|
|
|
PRESIDENT |
02/11/1993 |
|
|
|
PRESIDENT |
24/06/2002 |
|
|
BAJO MARTINEZ PABLO |
MEMBER OF THE BOARD |
09/07/1992 |
2 |
|
|
MEMBER OF THE BOARD |
20/10/1994 |
|
|
BELTRAN ROJO FERNANDO |
MEMBER OF THE BOARD |
04/09/1991 |
1 |
|
BONNARDEAUX CHADBURN JAMES |
MEMBER OF THE BOARD |
26/07/1990 |
1 |
|
BOSCH BOSQUE FERNANDO |
MEMBER OF THE BOARD |
21/03/1994 |
1 |
|
CARBALLEIRA BAO ROBERTO |
MEMBER OF THE BOARD |
04/12/1996 |
1 |
|
CARRASCO PRIETO ANGEL LUIS |
MEMBER OF THE BOARD |
04/06/1997 |
1 |
|
CORTINA GARCIA JORGE |
MEMBER OF THE BOARD |
06/10/1994 |
2 |
|
|
MEMBER OF THE BOARD |
09/03/1995 |
|
|
DE LA PEÑA DE LA PEÑA JAVIER |
MEMBER OF THE BOARD |
29/07/1992 |
3 |
|
|
PRESIDENT |
29/07/1992 |
|
|
DELOITTE & TOUCHE ESPAÑA SL |
ACCOUNTS' AUDITOR / HOLDER |
23/06/2003 |
3 |
|
|
ACCOUNTS' AUDITOR / HOLDER |
23/07/2004 |
|
|
|
ACCOUNTS' AUDITOR / HOLDER |
07/10/2005 |
|
|
DELOITTE S L |
ACCOUNTS' AUDITOR / HOLDER |
05/09/2006 |
2 |
|
|
ACCOUNTS' AUDITOR / HOLDER |
30/07/2007 |
|
|
DELOITTE SL |
ACCOUNTS' AUDITOR / HOLDER |
07/10/2005 |
9 |
|
|
ACCOUNTS' AUDITOR / HOLDER |
15/07/2008 |
|
|
|
ACCOUNTS' AUDITOR / HOLDER |
05/09/2006 |
|
|
|
ACCOUNTS' AUDITOR / HOLDER |
16/06/2010 |
|
|
|
ACCOUNTS' AUDITOR / HOLDER |
26/07/2011 |
|
|
|
ACCOUNTS' AUDITOR / HOLDER |
06/10/2009 |
|
|
|
ACCOUNTS' AUDITOR / HOLDER |
13/08/2012 |
|
|
|
ACCOUNTS' AUDITOR / HOLDER |
13/08/2013 |
|
|
DOMINGUEZ CARRASCO MARIA ISABEL |
NON CONSELLOR SECRETARY |
13/07/2009 |
3 |
|
|
SECRETARY |
18/11/2002 |
|
|
DURAN HERAS ALICIA |
MEMBER OF THE BOARD |
07/05/1990 |
1 |
|
FERNANDEZ FRIAL PEDRO |
MEMBER OF THE BOARD |
21/07/2006 |
12 |
|
|
MEMBER OF THE BOARD |
26/09/2003 |
|
|
|
CHIEF EXECUTIVE OFFICER |
26/09/2003 |
|
|
|
PRESIDENT |
26/09/2003 |
|
|
|
MEMBER OF THE BOARD |
08/06/2010 |
|
|
|
PRESIDENT |
08/06/2010 |
|
|
|
PRESIDENT |
16/07/2012 |
|
|
|
MEMBER OF THE BOARD |
16/07/2012 |
|
|
FERNANDEZ MATO ENRIQUE |
MEMBER OF THE BOARD |
13/11/1991 |
1 |
|
FERNANDEZ ROBLES ANGEL |
MEMBER OF THE BOARD |
08/07/1991 |
3 |
|
|
MEMBER OF THE BOARD |
16/07/1993 |
|
|
|
MEMBER |
01/10/1990 |
|
|
FRANCISCO POLLEDO JUAN JOSE |
MEMBER OF THE BOARD |
24/07/1997 |
1 |
|
GOMEZ RODRIGUEZ JULIO |
MEMBER OF THE BOARD |
16/10/1991 |
1 |
|
GOMIS SAEZ ANTONIO |
MEMBER OF THE BOARD |
15/07/1994 |
7 |
|
|
MEMBER OF THE BOARD |
12/11/1996 |
|
|
|
MEMBER OF THE BOARD |
18/03/1998 |
|
|
|
MEMBER OF THE BOARD |
21/07/2006 |
|
|
|
MEMBER OF THE BOARD |
23/07/2007 |
|
|
|
CHIEF EXECUTIVE OFFICER |
04/10/2006 |
|
|
|
CHIEF EXECUTIVE OFFICER |
23/07/2007 |
|
|
GONZALEZ ADALID GARCIA ZOZAYA ANTONIO |
MEMBER OF THE BOARD |
24/07/1997 |
7 |
|
|
MEMBER OF THE BOARD |
30/10/2000 |
|
|
|
PRESIDENT |
30/10/2000 |
|
|
GONZALEZ ROMERO ARTURO |
MEMBER OF THE BOARD |
09/07/1992 |
3 |
|
|
MEMBER OF THE BOARD |
12/11/1996 |
|
|
|
MEMBER OF THE BOARD |
24/07/1997 |
|
|
GRAIÑO BERTRAND AMALIO |
MEMBER OF THE BOARD |
19/06/2003 |
3 |
|
|
MEMBER OF THE BOARD |
19/07/2007 |
|
|
|
MEMBER OF THE BOARD |
06/06/2008 |
|
|
GRAIÑO BERTRAND AMALLO |
MEMBER OF THE BOARD |
16/07/2012 |
1 |
|
GUAL DE TORRELLA CORRAL CARLOS |
MEMBER OF THE BOARD |
24/07/1997 |
1 |
|
GUINEA RODRIGUEZ JESUS |
SINGLE ADMINISTRATOR |
08/02/2013 |
8 |
|
|
MEMBER OF THE BOARD |
16/07/2012 |
|
|
|
CHIEF EXECUTIVE OFFICER |
16/07/2012 |
|
|
GUTIERREZ MARTI RICARD |
MEMBER OF THE BOARD |
04/12/1996 |
1 |
|
JUAREZ LLORENTE MARIA ISABEL |
MEMBER OF THE BOARD |
16/07/2012 |
1 |
|
LOCUTURA RUPEREZ ENRIQUE |
MEMBER OF THE BOARD |
06/09/1995 |
13 |
|
|
MEMBER OF THE BOARD |
18/05/1999 |
|
|
|
MEMBER OF THE BOARD |
19/01/2000 |
|
|
|
JOINT CHIEF EXECUTIVE OFFICER |
10/05/1996 |
|
|
|
SOLE CHIEF EXECUTIVE OFFICER |
21/12/1999 |
|
|
MATEU ISTURIZ JOSE FRANCISCO |
NON CONSELLOR SECRETARY |
21/02/2001 |
7 |
|
|
SECRETARY |
18/10/1993 |
|
|
MAZA SABALETE JUAN PEDRO |
MEMBER OF THE BOARD |
28/04/2005 |
3 |
|
|
CHIEF EXECUTIVE OFFICER |
28/04/2005 |
|
|
|
PRESIDENT |
28/04/2005 |
|
|
MENDEZ BARRERA ALVARO |
NON CONSELLOR SECRETARY |
12/02/1993 |
4 |
|
MORENO MARTINEZ FRANCISCO |
MEMBER OF THE BOARD |
03/06/2002 |
2 |
|
|
MEMBER OF THE BOARD |
28/04/2005 |
|
|
OLIET PALA BLAS |
SECRETARY |
16/07/2012 |
1 |
|
ORTEGA DIAZ AMBRONA JUAN ANTONIO |
NON CONSELLOR SECRETARY |
18/11/1994 |
1 |
|
PALOMO SANZ BENJAMIN |
MEMBER OF THE BOARD |
09/07/2009 |
4 |
|
|
CHIEF EXECUTIVE OFFICER |
09/07/2009 |
|
|
PASTOR LOPEZ JOSE |
MEMBER OF THE BOARD |
02/11/1993 |
2 |
|
PAYA RIERA CARLOS |
MEMBER OF THE BOARD |
09/03/1995 |
2 |
|
|
MEMBER OF THE BOARD |
16/07/2012 |
|
|
PEREZ JURADO MANUEL |
MEMBER OF THE BOARD |
16/07/2012 |
1 |
|
REMON GIL MIGUEL ANGEL |
MEMBER OF THE BOARD |
09/07/1992 |
10 |
|
|
MEMBER OF THE BOARD |
06/10/1994 |
|
|
|
MEMBER OF THE BOARD |
16/06/1998 |
|
|
|
MEMBER OF THE BOARD |
19/01/2000 |
|
|
REVILLA PEDREIRA REGINA |
MEMBER OF THE BOARD |
06/10/1994 |
3 |
|
|
MEMBER OF THE BOARD |
06/02/1995 |
|
|
|
MEMBER |
09/07/1992 |
|
|
SANCHEZ DEL CORRAL TOUYA BORJA |
NON CONSELLOR ASSISTANT SECRETARY |
16/07/2012 |
1 |
|
SEGRELLES GARCIA JORGE |
MEMBER OF THE BOARD |
13/05/1994 |
1 |
|
SOLANA GOMEZ GUZMAN |
MEMBER OF THE BOARD |
30/10/1995 |
8 |
|
|
PRESIDENT |
30/10/1995 |
|
|
TRILLO ALVAREZ MANUEL |
MEMBER OF THE BOARD |
06/09/1995 |
2 |
|
|
MEMBER OF THE BOARD |
04/12/1996 |
|
|
TURET CLAPAROLS JOSE |
MEMBER OF THE BOARD |
12/11/1996 |
2 |
|
|
MEMBER OF THE BOARD |
19/01/2000 |
|
|
VADILLO ZABALLOS SIMEON |
MEMBER OF THE BOARD |
03/06/2002 |
6 |
|
|
MEMBER OF THE BOARD |
12/07/2004 |
|
|
|
MEMBER OF THE BOARD |
15/07/2008 |
|
|
|
MEMBER OF THE BOARD |
09/07/2009 |
|
|
VALLS SOLER JOSE |
MEMBER |
23/04/1990 |
2 |
|
VAN ROSMALEN WALTER |
MEMBER OF THE BOARD |
19/01/2000 |
4 |
|
VELASCO ALVAREZ CAMPANA JOSE MARIA |
MEMBER OF THE BOARD |
19/04/1995 |
1 |
|
VELAZQUEZ BUENDIA PALOMA |
MEMBER OF THE BOARD |
09/07/2009 |
1 |
|
Executive board |
||
|
|
|
|
|
Post |
NIF |
Name |
|
ADMINISTRATOR |
|
MIGUEL JOSU JON IMAZ SAN |
|
MANAGING DIRECTOR |
|
ANTONIO GOMIZ SAEZ |
Defaults, Legal Claims and Insolvency Proceedings |
|
|
|
|
Section enabling assessment of the degree of compliance of the company queried with its payment obligations. It provides information on the existence and nature of all stages of Insolvency and Legal Proceedings published with reference to the Company in the country's various Official Bulletins and national newspapers, as well Defaults Registered in the main national credit bureaus (ASNEF Industrial and RAI ).
Chronological summary
|
|
|
Number of Publications |
Amount (_) |
Start date |
End date |
|
Insolvency Proceedings, Bankruptcy and Suspension of Payments |
|
Unpublished |
--- |
--- |
--- |
|
Request/Declaration |
|
0 |
--- |
date |
|
|
Proceedings |
|
--- |
--- |
|
--- |
|
Resolution |
|
--- |
--- |
|
--- |
|
Defaults on debt with Financial Institutions and Large Companies |
Bank and Commercial Delinquency |
None |
0 |
|
|
|
Status: Friendly |
|
--- |
|
|
|
|
Status: Pre-Litigation |
|
--- |
|
|
|
|
Status: Litigation |
|
--- |
|
|
|
|
Status: Non-performing |
|
--- |
|
|
|
|
Status: insolvency proceedings, bankruptcy and suspension of payments |
|
--- |
|
|
|
|
Other status |
|
--- |
|
|
|
|
Legal and Administrative Proceedings |
|
1 |
--- |
20/08/2008 |
20/08/2008 |
|
Notices of defaults and enforcement |
|
1 |
--- |
|
--- |
|
Seizures |
|
--- |
--- |
|
--- |
|
Auctions |
|
--- |
--- |
|
--- |
|
Declarations of insolvency and bad debt |
|
--- |
--- |
|
--- |
|
Proceedings heard by the Civil Court |
|
Unpublished |
--- |
|
|
|
Proceedings heard by the Labour Court |
|
Unpublished |
--- |
|
|
|
Positive Factors |
Adverse Factors |
|
It has been found to have regular payment performance and has paid all of its debts in a timely manner. In fiscal year 2012 , total debts incurred with credit institutions and trade creditors has decreased with respect to the previous fiscal year. The greater the level of indebtedness, the greater the Company's reliance on capital suppliers and the more complicated its financial standing. REPSOL QUIMICA SA's borrowing cost is appropriate according to its volume of external financing sources. Adequate long-term solvency. As the Real Assets of the company exceed its total debts, it offers, in principle, real property guarantee for settlement of its long-term obligations to third parties. Resources are managed more effectively, as turnover has increased with a reduced staff. |
Productivity decrease. The Company's salaried staff productivity has decreased with respect to the previous fiscal year. This productivity decrease is reflected in a decrease in its generated income, a fact that might hinder the Company's financial situation. It has no operating income return. The Company has no return on the investments necessary for its main activity with respect to its assets. The Company's show losses in the development of its ordinary activities in 2012 and in 2011. During 2012 the company renewed its customer portfolio 6.63 times. This reflects an approximate average payment collection term of 90 días days. Average payment term to suppliers is longer than average payment term from customers.This means that the company pays to suppliers later than it receives payment from its customers. This benefits the company from a financial perspective, as it may increase its income; whereas it is risky for suppliers, who are, therefore, financing the company. Related companies with judicial claims. Some type of judicial / administrative claim or serious action by any of the companies related to REPSOL QUIMICA SA has been published in BORME. |
LEGAL CLAIMS |
|
|
|
|
|
|
|
|
||
|
|
|
No se han publicado |
|
|
|
|
No se han publicado |
|
|
|
|
||
|
|
|
No se han publicado |
|
|
|
|
|
|
|
|
|
No se han publicado |
|
|
|
|
No se han publicado |
|
|
|
|
||
|
|
|
No se han publicado |
|
|
|
|
No se han publicado |
|
|
|
|
||
|
|
|
No se han publicado |
|
|
Incidences Detailed |
|
Incidences with the Social Security |
|
|
|
Last Published Stage: |
NOTIFICATION |
|
Record Number: |
03462008021191104 |
|
Amount of the incidence: |
67,37 E |
|
Requested by: |
SEGURIDAD SOCIAL |
|
Published domicile: |
CL CRONISTA CARRERES; VALENCIA C.P.:46003 |
|
Source: |
B.O.P. VALENCIA Nº222, 2008 SUPLEMENTO 2 PAGINA 112 |
|
|
Suppliers |
|
|
|
Name |
NIF |
Telephone |
|
|
|
REPSOL SA |
100 |
|
|
|
Link List |
|
|
|
|
|
BELONGS TO THE ADMINISTRATION BOARD OF: |
2 Entities |
|
HAS IN ITS ADMINISTRATION BOARD TO: |
1 Entities |
|
IS RELATED WITH: |
8 Entities |
|
PARTICIPATES IN: |
12 Entities |
|
SHAREHOLDERS: |
1 Entities |
> Shareholders
|
Relationship |
Entity |
Province |
Shareholding stake |
|
SHAREHOLDERS |
REPSOL SA |
MADRID |
|
|
|
TRANSFORMADORA DE ETILENO AIE |
MADRID |
50 |
|
PARTICIPATES IN |
POLIDUX SOCIEDAD ANONIMA |
MADRID |
99.9 |
|
|
GENERAL QUIMICA SOCIEDAD ANONIMA |
ALAVA |
98.99 |
|
|
DYNASOL GESTION SA |
MADRID |
50 |
|
|
SERVICIOS DE SEGURIDAD MANCOMUNADOS SOCIEDAD ANONIMA |
CIUDAD REAL |
30 |
|
|
SOCIEDAD ESPAÑOLA DE MATERIALES PLASTICOS SEMAP SA |
MADRID |
10 |
|
|
DYNASOL ELASTOMEROS SA |
MADRID |
50.01 |
|
|
REPSOL LUSITANIA SL |
MADRID |
2 |
|
|
REPSOL CHEMIE DEUTSCHLAND, S.A. |
|
100 |
|
|
DYNASOL ELASTOMEROS, SOCIEDAD ANONIMA, DE CV (MEXICO) |
|
50 |
|
|
REPSOL POLIMEROS, S.A. |
|
70 |
|
|
DYNASOL LLC |
|
50 |
> Other relationships
|
Relationship |
Entity |
Province |
Shareholding stake |
|
IS RELATED WITH |
| | |
|
|
|
|
REPSOL SA |
MADRID |
99.99 |
|
|
REPSOL LUBRICANTES Y ESPECIALIDADES SA |
MADRID |
|
|
|
SOLRED SA |
MADRID |
|
|
|
REPSOL COMERCIAL DE PRODUCTOS PETROLIFEROS, S.A. |
MADRID |
|
|
|
REPSOL TRADING SA |
MADRID |
|
|
IS RELATED WITH |
REPSOL LUBRICANTES Y ESPECIALIDADES SA |
MADRID |
|
|
|
REPSOL EXPLORACION ARGELIA SA |
MADRID |
|
|
|
TRATAMIENTOS Y RECUPERACIONES INDUSTRIALES SA |
BARCELONA |
|
|
HAS IN ITS ADMINISTRATION BOARD TO |
REPSOL YPF TESORERIA Y GESTION FINANCIERA SA |
MADRID |
|
|
|
CICLOPLAST SA |
MADRID |
|
|
BELONGS TO THE ADMINISTRATION BOARD OF |
SOCIEDAD ESPAÑOLA DE MATERIALES PLASTICOS SEMAP SA |
MADRID |
|
|
Turnover |
|
|
Total Sales |
3.680.821.000 |
Financial Accounts and Balance Sheets
Financial Years Presented
|
Ejercicio |
Tipo de Cuentas Anuales |
Fecha Presentacion |
|
2012 |
Normales |
August 2013 |
|
2011 |
Normales |
July 2012 |
|
2010 |
Normales |
September 2011 |
|
2009 |
Normales |
June 2010 |
|
2008 |
Normales |
December 2009 |
|
2007 |
Normales |
July 2008 |
|
2006 |
Normales |
August 2007 |
|
2005 |
Normales |
October 2006 |
|
2004 |
Normales |
August 2005 |
|
2003 |
Normales |
July 2004 |
|
2002 |
Normales |
June 2003 |
|
2001 |
Normales |
July 2002 |
|
2000 |
Normales |
May 2001 |
|
1999 |
Normales |
July 2000 |
|
1998 |
Normales |
April 1999 |
|
1997 |
Normales |
May 1998 |
|
1996 |
Normales |
September 1997 |
|
1995 |
Normales |
July 1996 |
|
1994 |
Normales |
August 1995 |
|
1993 |
Normales |
July 1994 |
|
1992 |
Normales |
August 1993 |
|
1991 |
Normales |
August 1992 |
|
1990 |
Normales |
June 1991 |
|
1989 |
Normales |
May 1990 |
The data in the report regarding the last Company Accounts submitted by the company is taken from the TRADE REGISTER serving the region in which the company's address is located 31/12/2012
> Balance en formato Normal de acuerdo al Nuevo Plan General Contable 2007
Information corresponding to the fiscal year 2012 2011 2010 2009 2008 is taken from information submitted to the TRADE REGISTER. Data corresponding to fiscal years before 2012 2011 2010 2009 2008 has been compiled based on the equivalence criteria stipulated in Act JUS/206/2009. Where the provisions of the Act did not establish relevant equivalence criteria, axesor created such criteria using its own methodology. To view details on the methodology.
|
|
ORIGINAL |
ORIGINAL |
ORIGINAL |
ORIGINAL |
ORIGINAL |
|
|
Assets |
2012 |
2011 |
2010 |
2009 |
2008 |
|
|
A) NON-CURRENT ASSETS: 11000 |
526.322.000,00 |
590.145.000,00 |
643.039.000,00 |
714.677.000,00 |
764.711.000,00 |
|
|
I. Intangible fixed assets : 11100 |
10.685.000,00 |
9.604.000,00 |
17.317.000,00 |
22.678.000,00 |
29.229.000,00 |
|
|
1. Development: 11110 |
0,00 |
0,00 |
0,00 |
0,00 |
0,00 |
|
|
2. Concessions: 11120 |
0,00 |
0,00 |
0,00 |
0,00 |
0,00 |
|
|
3. Patents, licencing, trade marks and similar: 11130 |
433.000,00 |
479.000,00 |
666.000,00 |
1.716.000,00 |
3.000.000,00 |
|
|
4. Goodwill: 11140 |
1.408.000,00 |
1.408.000,00 |
1.408.000,00 |
1.408.000,00 |
1.408.000,00 |
|
|
5. IT applications: 11150 |
2.383.000,00 |
2.299.000,00 |
2.877.000,00 |
5.022.000,00 |
6.659.000,00 |
|
|
6. Investigation: 11160 |
0,00 |
0,00 |
0,00 |
0,00 |
0,00 |
|
|
7. Other intangible fixed assets: 11170 |
6.461.000,00 |
5.418.000,00 |
12.366.000,00 |
14.532.000,00 |
18.162.000,00 |
|
|
II. Tangible fixed assets : 11200 |
411.851.000,00 |
407.634.000,00 |
390.589.000,00 |
442.306.000,00 |
484.926.000,00 |
|
|
1. Land and buildings: 11210 |
59.450.000,00 |
62.921.000,00 |
67.626.000,00 |
69.643.000,00 |
73.088.000,00 |
|
|
2. Technical installations and other tangible fixed assets: 11220 |
284.824.000,00 |
289.384.000,00 |
269.871.000,00 |
312.819.000,00 |
404.560.000,00 |
|
|
3. Tangible asset in progress and advances: 11230 |
67.577.000,00 |
55.329.000,00 |
53.092.000,00 |
59.844.000,00 |
7.278.000,00 |
|
|
III. Real estate investment: 11300 |
289.000,00 |
292.000,00 |
296.000,00 |
299.000,00 |
302.000,00 |
|
|
1. Land: 11310 |
222.000,00 |
222.000,00 |
222.000,00 |
222.000,00 |
222.000,00 |
|
|
2. Buildings: 11320 |
67.000,00 |
70.000,00 |
74.000,00 |
77.000,00 |
80.000,00 |
|
|
IV. Long-term investments in Group companies and associates : 11400 |
44.753.000,00 |
126.535.000,00 |
211.142.000,00 |
233.554.000,00 |
235.988.000,00 |
|
|
1. Equity instruments: 11410 |
44.357.000,00 |
124.778.000,00 |
209.357.000,00 |
233.047.000,00 |
235.461.000,00 |
|
|
2. Credits to businesses: 11420 |
396.000,00 |
410.000,00 |
460.000,00 |
507.000,00 |
527.000,00 |
|
|
3. Debt securities: 11430 |
0,00 |
0,00 |
0,00 |
0,00 |
0,00 |
|
|
4. Derivatives : 11440 |
0,00 |
0,00 |
0,00 |
0,00 |
0,00 |
|
|
5. Other financial assets : 11450 |
0,00 |
1.347.000,00 |
1.325.000,00 |
0,00 |
0,00 |
|
|
6. Other investments: 11460 |
0,00 |
0,00 |
0,00 |
0,00 |
0,00 |
|
|
V. Long-term financial investments: 11500 |
601.000,00 |
904.000,00 |
845.000,00 |
665.000,00 |
1.799.000,00 |
|
|
1. Equity instruments: 11510 |
96.000,00 |
191.000,00 |
99.000,00 |
165.000,00 |
165.000,00 |
|
|
2. Credits to third parties : 11520 |
1.000,00 |
212.000,00 |
245.000,00 |
22.000,00 |
22.000,00 |
|
|
3. Debt securities: 11530 |
0,00 |
0,00 |
0,00 |
0,00 |
0,00 |
|
|
4. Derivatives : 11540 |
0,00 |
0,00 |
0,00 |
0,00 |
0,00 |
|
|
5. Other financial assets : 11550 |
504.000,00 |
501.000,00 |
501.000,00 |
0,00 |
1.612.000,00 |
|
|
6. Other investments: 11560 |
0,00 |
0,00 |
0,00 |
478.000,00 |
0,00 |
|
|
VI. Assets for deferred tax : 11600 |
58.143.000,00 |
45.176.000,00 |
22.850.000,00 |
15.175.000,00 |
12.467.000,00 |
|
|
VII. Non-current trade debts : 11700 |
0,00 |
0,00 |
0,00 |
0,00 |
0,00 |
|
|
B) CURRENT ASSETS: 12000 |
1.163.063.000,00 |
994.305.000,00 |
845.749.000,00 |
682.617.000,00 |
655.446.000,00 |
|
|
I. Non-current assets held for sale : 12100 |
0,00 |
0,00 |
0,00 |
0,00 |
0,00 |
|
|
II. Stocks: 12200 |
281.623.000,00 |
288.432.000,00 |
245.437.000,00 |
203.815.000,00 |
194.763.000,00 |
|
|
1. Commercial: 12210 |
165.000,00 |
167.000,00 |
70.000,00 |
597.000,00 |
762.000,00 |
|
|
2. Primary material and other supplies: 12220 |
47.543.000,00 |
51.452.000,00 |
49.399.000,00 |
61.206.000,00 |
71.295.000,00 |
|
|
3. Work in progress: 12230 |
6.280.000,00 |
5.531.000,00 |
4.985.000,00 |
6.040.000,00 |
8.425.000,00 |
|
|
a) Of long-term production cycle : 12231 |
0,00 |
0,00 |
0,00 |
0,00 |
0,00 |
|
|
b) Of short-term production cycle : 12232 |
6.280.000,00 |
5.531.000,00 |
4.985.000,00 |
6.040.000,00 |
8.425.000,00 |
|
|
4. Finished goods: 12240 |
227.199.000,00 |
230.816.000,00 |
190.308.000,00 |
134.834.000,00 |
112.509.000,00 |
|
|
a) Of long-term production cycle : 12241 |
0,00 |
0,00 |
0,00 |
0,00 |
0,00 |
|
|
b) Of short-term production cycle : 12242 |
227.199.000,00 |
230.816.000,00 |
190.308.000,00 |
134.834.000,00 |
112.509.000,00 |
|
|
5. By-products, residues and recycled materials: 12250 |
268.000,00 |
297.000,00 |
505.000,00 |
203.000,00 |
349.000,00 |
|
|
6. Advances to suppliers: 12260 |
168.000,00 |
169.000,00 |
170.000,00 |
935.000,00 |
1.423.000,00 |
|
|
III. Trade debtors and others receivable accounts: 12300 |
561.704.000,00 |
453.523.000,00 |
450.835.000,00 |
355.748.000,00 |
417.667.000,00 |
|
|
1. Trade debtors / accounts receivable: 12310 |
391.881.000,00 |
311.611.000,00 |
337.967.000,00 |
237.440.000,00 |
224.400.000,00 |
|
|
a) Long-term receivables from sales and services supplied : 12311 |
0,00 |
0,00 |
0,00 |
0,00 |
0,00 |
|
|
b) Customers for sales and provisions of services : 12312 |
391.881.000,00 |
311.611.000,00 |
337.967.000,00 |
237.440.000,00 |
224.400.000,00 |
|
|
2. Customers, Group companies and associates : 12320 |
138.990.000,00 |
119.464.000,00 |
93.127.000,00 |
97.237.000,00 |
152.354.000,00 |
|
|
3. Other accounts receivable: 12330 |
17.927.000,00 |
10.658.000,00 |
9.206.000,00 |
12.887.000,00 |
24.732.000,00 |
|
|
4. Personnel: 12340 |
0,00 |
0,00 |
0,00 |
0,00 |
4.228.000,00 |
|
|
5. Assets for deferred tax: 12350 |
0,00 |
0,00 |
0,00 |
0,00 |
0,00 |
|
|
6. Other debtors, including tax and social security: 12360 |
12.906.000,00 |
11.790.000,00 |
10.535.000,00 |
8.184.000,00 |
11.953.000,00 |
|
|
7. Called up share capital: 12370 |
0,00 |
0,00 |
0,00 |
0,00 |
0,00 |
|
|
IV. Short-term investments in Group companies and associates: 12400 |
316.508.000,00 |
249.843.000,00 |
141.761.000,00 |
114.515.000,00 |
33.882.000,00 |
|
|
1. Equity instruments: 12410 |
0,00 |
0,00 |
0,00 |
0,00 |
0,00 |
|
|
2. Credits to businesses: 12420 |
314.119.000,00 |
249.843.000,00 |
141.761.000,00 |
114.515.000,00 |
33.882.000,00 |
|
|
3. Debt securities: 12430 |
0,00 |
0,00 |
0,00 |
0,00 |
0,00 |
|
|
4. Derivatives : 12440 |
0,00 |
0,00 |
0,00 |
0,00 |
0,00 |
|
|
5. Other financial assets : 12450 |
2.389.000,00 |
0,00 |
0,00 |
0,00 |
0,00 |
|
|
6. Other investments: 12460 |
0,00 |
0,00 |
0,00 |
0,00 |
0,00 |
|
|
V. Short-term financial investments : 12500 |
54.000,00 |
6.000,00 |
6.000,00 |
4.487.000,00 |
4.852.000,00 |
|
|
1. Equity instruments: 12510 |
0,00 |
0,00 |
0,00 |
4.415.000,00 |
4.405.000,00 |
|
|
2. Credits to businesses: 12520 |
0,00 |
0,00 |
0,00 |
0,00 |
0,00 |
|
|
3. Debt securities: 12530 |
0,00 |
0,00 |
0,00 |
0,00 |
0,00 |
|
|
4. Derivatives : 12540 |
0,00 |
0,00 |
0,00 |
0,00 |
0,00 |
|
|
5. Other financial assets : 12550 |
0,00 |
0,00 |
0,00 |
0,00 |
447.000,00 |
|
|
6. Other investments: 12560 |
54.000,00 |
6.000,00 |
6.000,00 |
72.000,00 |
0,00 |
|
|
VI. Short-term accruals: 12600 |
1.973.000,00 |
1.920.000,00 |
2.439.000,00 |
3.603.000,00 |
3.655.000,00 |
|
|
VII. Cash and other equivalent liquid assets : 12700 |
1.201.000,00 |
581.000,00 |
5.271.000,00 |
449.000,00 |
627.000,00 |
|
|
1. Treasury: 12710 |
1.201.000,00 |
581.000,00 |
5.271.000,00 |
449.000,00 |
627.000,00 |
|
|
2. Other equivalent liquid assets: 12720 |
0,00 |
0,00 |
0,00 |
0,00 |
0,00 |
|
|
TOTAL ASSETS (A + B) : 10000 |
1.689.385.000,00 |
1.584.450.000,00 |
1.488.788.000,00 |
1.397.294.000,00 |
1.420.157.000,00 |
|
|
|
ORIGINAL |
ORIGINAL |
ORIGINAL |
ORIGINAL |
ORIGINAL |
|
|
Liabilities and Net Worth |
2012 |
2011 |
2010 |
2009 |
2008 |
|
|
A) NET WORTH: 20000 |
29.083.000,00 |
121.234.000,00 |
-338.561.000,00 |
-321.599.000,00 |
-206.241.000,00 |
|
|
A-1) Shareholders' equity: 21000 |
26.943.000,00 |
118.524.000,00 |
-340.204.000,00 |
-321.599.000,00 |
-206.241.000,00 |
|
|
I. Capital: 21100 |
60.461.000,00 |
60.461.000,00 |
60.461.000,00 |
60.461.000,00 |
60.461.000,00 |
|
|
1. Registered capital : 21110 |
60.461.000,00 |
60.461.000,00 |
60.461.000,00 |
60.461.000,00 |
60.461.000,00 |
|
|
2. (Uncalled capital): 21120 |
0,00 |
0,00 |
0,00 |
0,00 |
0,00 |
|
|
II. Share premium: 21200 |
116.005.000,00 |
116.005.000,00 |
116.005.000,00 |
116.005.000,00 |
116.005.000,00 |
|
|
III. Reserves: 21300 |
295.891.000,00 |
295.891.000,00 |
295.891.000,00 |
295.891.000,00 |
295.891.000,00 |
|
|
1. Legal y estatutarias: 21310 |
12.092.000,00 |
12.092.000,00 |
12.092.000,00 |
12.092.000,00 |
12.092.000,00 |
|
|
2. Other reserves: 21320 |
283.799.000,00 |
283.799.000,00 |
283.799.000,00 |
283.799.000,00 |
283.799.000,00 |
|
|
IV. (Common stock equity): 21400 |
0,00 |
0,00 |
0,00 |
0,00 |
0,00 |
|
|
V. Results from previous periods: 21500 |
-935.260.000,00 |
-893.987.000,00 |
-875.383.000,00 |
-678.598.000,00 |
-498.421.000,00 |
|
|
1. Brought forward: 21510 |
0,00 |
0,00 |
0,00 |
0,00 |
0,00 |
|
|
2. (Negative results from previous periods): 21520 |
-935.260.000,00 |
-893.987.000,00 |
-875.383.000,00 |
-678.598.000,00 |
-498.421.000,00 |
|
|
VI. Other shareholders' contributions: 21600 |
581.427.000,00 |
581.427.000,00 |
81.427.000,00 |
0,00 |
81.426.000,00 |
|
|
VII. Result of the period: 21700 |
-91.581.000,00 |
-41.273.000,00 |
-18.605.000,00 |
-115.358.000,00 |
-261.603.000,00 |
|
|
VIII. (Interim dividend): 21800 |
0,00 |
0,00 |
0,00 |
0,00 |
0,00 |
|
|
IX. Other net worth instruments: 21900 |
0,00 |
0,00 |
0,00 |
0,00 |
0,00 |
|
|
A-2) Adjustments due to changes in value: 22000 |
0,00 |
0,00 |
0,00 |
0,00 |
0,00 |
|
|
I. Financial assets held for sale: 22100 |
0,00 |
0,00 |
0,00 |
0,00 |
0,00 |
|
|
II. Hedge operations: 22200 |
0,00 |
0,00 |
0,00 |
0,00 |
0,00 |
|
|
III. Linked non-current assets and liabilities held for sale : 22300 |
0,00 |
0,00 |
0,00 |
0,00 |
0,00 |
|
|
IV. Exchange rate difference: 22400 |
0,00 |
0,00 |
0,00 |
0,00 |
0,00 |
|
|
V. Other: 22500 |
0,00 |
0,00 |
0,00 |
0,00 |
0,00 |
|
|
A-3) Received subsidies, donations and legacies: 23000 |
2.140.000,00 |
2.710.000,00 |
1.643.000,00 |
0,00 |
0,00 |
|
|
B) NON-CURRENT LIABILITIES: 31000 |
484.361.000,00 |
465.656.000,00 |
477.440.000,00 |
369.814.000,00 |
21.018.000,00 |
|
|
I. Long-term provisions: 31100 |
19.999.000,00 |
7.961.000,00 |
21.737.000,00 |
17.025.000,00 |
16.321.000,00 |
|
|
1. Long-term employee benefits liability: 31110 |
222.000,00 |
1.869.000,00 |
1.794.000,00 |
1.218.000,00 |
0,00 |
|
|
2. Environmental actions: 31120 |
18.187.000,00 |
4.441.000,00 |
4.501.000,00 |
809.000,00 |
671.000,00 |
|
|
3. Restructuring provisions: 31130 |
0,00 |
0,00 |
0,00 |
0,00 |
0,00 |
|
|
4. Other provisions: 31140 |
1.590.000,00 |
1.651.000,00 |
15.442.000,00 |
14.998.000,00 |
15.650.000,00 |
|
|
II Long-term creditors: 31200 |
7.658.000,00 |
6.992.000,00 |
5.896.000,00 |
2.395.000,00 |
970.000,00 |
|
|
1. Liabilities and other securities: 31210 |
0,00 |
0,00 |
0,00 |
0,00 |
0,00 |
|
|
2. Amounts owed to credit institutions: 31220 |
0,00 |
0,00 |
0,00 |
0,00 |
0,00 |
|
|
3. Creditors from financial leasing: 31230 |
0,00 |
0,00 |
0,00 |
0,00 |
0,00 |
|
|
4. Derivatives : 31240 |
0,00 |
0,00 |
0,00 |
0,00 |
0,00 |
|
|
5. Other financial liabilities : 31250 |
7.658.000,00 |
6.992.000,00 |
5.896.000,00 |
2.395.000,00 |
970.000,00 |
|
|
III. Long-term debts with Group companies and associates: 31300 |
0,00 |
0,00 |
0,00 |
0,00 |
0,00 |
|
|
IV. Liabilities for deferred tax: 31400 |
9.704.000,00 |
3.703.000,00 |
2.807.000,00 |
2.801.000,00 |
2.989.000,00 |
|
|
V. Long-term accruals: 31500 |
0,00 |
0,00 |
0,00 |
225.000,00 |
738.000,00 |
|
|
VI. Non-current trade creditors : 31600 |
0,00 |
0,00 |
0,00 |
0,00 |
0,00 |
|
|
VII. Special long-term debts : 31700 |
447.000.000,00 |
447.000.000,00 |
447.000.000,00 |
347.368.000,00 |
0,00 |
|
|
C) CURRENT LIABILITIES : 32000 |
1.175.941.000,00 |
997.560.000,00 |
1.349.909.000,00 |
1.349.079.000,00 |
1.605.380.000,00 |
|
|
I. Liabilities linked to non-current assets held for sale: 32100 |
0,00 |
0,00 |
0,00 |
0,00 |
0,00 |
|
|
II. Short-term provisions: 32200 |
7.104.000,00 |
20.553.000,00 |
21.826.000,00 |
14.300.000,00 |
18.162.000,00 |
|
|
III. Short-term creditors : 32300 |
0,00 |
415.000,00 |
1.079.000,00 |
44.000,00 |
9.368.000,00 |
|
|
1. Liabilities and other securities: 32310 |
0,00 |
0,00 |
0,00 |
43.000,00 |
0,00 |
|
|
2. Amounts owed to credit institutions: 32320 |
0,00 |
415.000,00 |
1.079.000,00 |
0,00 |
8.531.000,00 |
|
|
3. Creditors from financial leasing: 32330 |
0,00 |
0,00 |
0,00 |
0,00 |
0,00 |
|
|
4. Derivatives : 32340 |
0,00 |
0,00 |
0,00 |
0,00 |
392.000,00 |
|
|
5. Other financial liabilities : 32350 |
0,00 |
0,00 |
0,00 |
1.000,00 |
445.000,00 |
|
|
IV. Short-term debts with Group companies and associates: 32400 |
1.063.184.000,00 |
859.981.000,00 |
1.217.556.000,00 |
1.219.706.000,00 |
1.207.307.000,00 |
|
|
V. Trade creditors and other accounts payable: 32500 |
105.653.000,00 |
116.611.000,00 |
109.448.000,00 |
115.029.000,00 |
370.543.000,00 |
|
|
1. Suppliers: 32510 |
48.164.000,00 |
54.624.000,00 |
54.930.000,00 |
56.802.000,00 |
87.211.000,00 |
|
|
a) Long-term debts : 32511 |
0,00 |
0,00 |
0,00 |
0,00 |
0,00 |
|
|
b) Short-term debts : 32512 |
48.164.000,00 |
54.624.000,00 |
54.930.000,00 |
56.802.000,00 |
87.211.000,00 |
|
|
2. Suppliers, Group companies and associates: 32520 |
0,00 |
0,00 |
0,00 |
0,00 |
208.081.000,00 |
|
|
3. Other creditors: 32530 |
46.209.000,00 |
48.507.000,00 |
42.019.000,00 |
46.777.000,00 |
53.421.000,00 |
|
|
4. Personnel (remuneration due): 32540 |
0,00 |
0,00 |
0,00 |
0,00 |
8.900.000,00 |
|
|
5. Liabilities for current tax: 32550 |
0,00 |
0,00 |
0,00 |
0,00 |
0,00 |
|
|
6. Otras deudas con las Administraciones Públicas. : 32560 |
11.280.000,00 |
13.480.000,00 |
12.499.000,00 |
11.450.000,00 |
12.930.000,00 |
|
|
7. Advances from clients: 32570 |
0,00 |
0,00 |
0,00 |
0,00 |
0,00 |
|
|
VI. Short-term accruals: 32600 |
0,00 |
0,00 |
0,00 |
0,00 |
0,00 |
|
|
VII. Special short-term debts : 32700 |
0,00 |
0,00 |
0,00 |
0,00 |
0,00 |
|
|
TOTAL NET WORTH AND LIABILITIES (A + B + C) : 30000 |
1.689.385.000,00 |
1.584.450.000,00 |
1.488.788.000,00 |
1.397.294.000,00 |
1.420.157.000,00 |
|
|
|
ORIGINAL |
ORIGINAL |
ORIGINAL |
ORIGINAL |
ORIGINAL |
|
|
Profit and Loss |
2012 |
2011 |
2010 |
2009 |
2008 |
|
|
1. Net turnover: 40100 |
3.680.821.000,00 |
3.642.232.000,00 |
3.014.091.000,00 |
1.788.523.000,00 |
2.735.139.000,00 |
|
|
a) Sales: 40110 |
3.680.821.000,00 |
3.642.232.000,00 |
3.014.091.000,00 |
1.788.523.000,00 |
2.735.139.000,00 |
|
|
b) Rendering of services: 40120 |
0,00 |
0,00 |
0,00 |
0,00 |
0,00 |
|
|
2. Changes in stocks of finished goods and work in progress: 40200 |
-2.898.000,00 |
40.846.000,00 |
54.720.000,00 |
-46.005.000,00 |
-56.935.000,00 |
|
|
3. Works carried out by the company for its assets: 40300 |
251.000,00 |
9.519.000,00 |
7.423.000,00 |
4.684.000,00 |
9.428.000,00 |
|
|
4. Supplies : 40400 |
-2.665.718.000,00 |
-2.661.882.000,00 |
-2.119.433.000,00 |
-1.357.443.000,00 |
-2.305.308.000,00 |
|
|
a) Stock consumption: 40410 |
-334.783.000,00 |
-369.622.000,00 |
-329.819.000,00 |
-403.260.000,00 |
-643.006.000,00 |
|
|
b) Consumption of raw materials and miscellaneous consumable ones: 40420 |
-2.328.598.000,00 |
-2.292.260.000,00 |
-1.789.614.000,00 |
-1.019.983.000,00 |
-1.601.378.000,00 |
|
|
c) Works carried out by other companies: 40430 |
0,00 |
0,00 |
0,00 |
0,00 |
0,00 |
|
|
d) Impairment of stock, primary material and other supplies: 40440 |
-2.337.000,00 |
0,00 |
0,00 |
65.800.000,00 |
-60.924.000,00 |
|
|
5. Other operating income: 40500 |
42.054.000,00 |
57.332.000,00 |
53.815.000,00 |
71.685.000,00 |
74.764.000,00 |
|
|
a) Auxiliary income and other from current management: 40510 |
41.727.000,00 |
40.409.000,00 |
37.007.000,00 |
51.978.000,00 |
47.628.000,00 |
|
|
b) Operation subsidies included in the Period's result: 40520 |
327.000,00 |
16.923.000,00 |
16.808.000,00 |
19.707.000,00 |
27.136.000,00 |
|
|
6. Personnel costs: 40600 |
-85.716.000,00 |
-93.078.000,00 |
-102.241.000,00 |
-94.480.000,00 |
-107.859.000,00 |
|
|
a) Wages, salaries et al.: 40610 |
-64.285.000,00 |
-69.861.000,00 |
-79.708.000,00 |
-69.678.000,00 |
-81.524.000,00 |
|
|
b) Social security costs: 40620 |
-21.431.000,00 |
-23.217.000,00 |
-22.533.000,00 |
-24.802.000,00 |
-26.335.000,00 |
|
|
c) Provisions : 40630 |
0,00 |
0,00 |
0,00 |
0,00 |
0,00 |
|
|
7. Other operating costs: 40700 |
-981.165.000,00 |
-918.440.000,00 |
-823.047.000,00 |
-430.036.000,00 |
-547.389.000,00 |
|
|
a) External services: 40710 |
-954.193.000,00 |
-902.954.000,00 |
-798.046.000,00 |
-409.653.000,00 |
-514.814.000,00 |
|
|
b) Taxes: 40720 |
-7.176.000,00 |
-7.226.000,00 |
-7.008.000,00 |
-5.589.000,00 |
-7.161.000,00 |
|
|
c) Losses, impairments and variation in provisions from trade operations : 40730 |
-421.000,00 |
-2.079.000,00 |
2.310.000,00 |
424.000,00 |
-4.566.000,00 |
|
|
d) Other current management expenditure : 40740 |
-19.375.000,00 |
-6.181.000,00 |
-20.303.000,00 |
-15.218.000,00 |
-20.848.000,00 |
|
|
8. Amortisation of fixed assets: 40800 |
-28.925.000,00 |
-26.893.000,00 |
-73.152.000,00 |
-85.806.000,00 |
-104.594.000,00 |
|
|
9. Allocation of subsidies of non-financial fixed assets and other: 40900 |
8.725.000,00 |
456.000,00 |
174.000,00 |
0,00 |
0,00 |
|
|
10. Excess provisions : 41000 |
0,00 |
569.000,00 |
0,00 |
0,00 |
36.000,00 |
|
|
11. Impairment and result of transfers of fixed assets: 41100 |
-21.306.000,00 |
-9.015.000,00 |
-12.090.000,00 |
-3.990.000,00 |
-8.253.000,00 |
|
|
a) Impairment and losses : 41110 |
-18.030.000,00 |
-7.501.000,00 |
-14.186.000,00 |
-4.427.000,00 |
-8.061.000,00 |
|
|
b) Results for transfers and other : 41120 |
-3.276.000,00 |
-1.514.000,00 |
2.096.000,00 |
437.000,00 |
-192.000,00 |
|
|
12. Negative difference in combined businesses: 41200 |
0,00 |
0,00 |
0,00 |
0,00 |
0,00 |
|
|
13. Other results : 41300 |
0,00 |
0,00 |
0,00 |
0,00 |
0,00 |
|
|
A.1) OPERATING INCOME (1 + 2 + 3 + 4 + 5 + 6 + 7 + 8 + 9 + 10 + 11 + 12 + 13) : 49100 |
-53.877.000,00 |
41.646.000,00 |
260.000,00 |
-152.868.000,00 |
-310.971.000,00 |
|
|
14. Financial income : 41400 |
5.743.000,00 |
3.361.000,00 |
2.316.000,00 |
1.730.000,00 |
1.780.000,00 |
|
|
a) Of shares in equity instruments : 41410 |
2.427.000,00 |
1.000,00 |
881.000,00 |
818.000,00 |
619.000,00 |
|
|
a 1) In Group companies and associates: 41411 |
2.427.000,00 |
1.000,00 |
881.000,00 |
818.000,00 |
619.000,00 |
|
|
a 2) In third parties: 41412 |
0,00 |
0,00 |
0,00 |
0,00 |
0,00 |
|
|
b) From negotiable securities and other financial instruments : 41420 |
3.316.000,00 |
3.360.000,00 |
1.435.000,00 |
912.000,00 |
1.161.000,00 |
|
|
b 1) From Group companies and associates : 41421 |
3.054.000,00 |
3.014.000,00 |
1.415.000,00 |
817.000,00 |
737.000,00 |
|
|
b 2) From third parties : 41422 |
262.000,00 |
346.000,00 |
20.000,00 |
95.000,00 |
424.000,00 |
|
|
c) Allocation of financial subsidies, donations and legacies : 41430 |
0,00 |
0,00 |
0,00 |
0,00 |
0,00 |
|
|
15. Financial expenditure: 41500 |
-13.839.000,00 |
-19.085.000,00 |
-13.873.000,00 |
-19.007.000,00 |
-50.078.000,00 |
|
|
a) Amounts owed to Group companies and associates : 41510 |
-13.415.000,00 |
-18.379.000,00 |
-12.853.000,00 |
-18.569.000,00 |
-44.766.000,00 |
|
|
b) For debts with third parties : 41520 |
-368.000,00 |
-355.000,00 |
24.000,00 |
38.000,00 |
-4.629.000,00 |
|
|
c) Stock renewal : 41530 |
-56.000,00 |
-351.000,00 |
-1.044.000,00 |
-476.000,00 |
-683.000,00 |
|
|
16. Changes in fair value of financial instruments : 41600 |
0,00 |
4.000,00 |
19.000,00 |
-444.000,00 |
0,00 |
|
|
a) Trading book and other : 41610 |
0,00 |
4.000,00 |
19.000,00 |
-444.000,00 |
0,00 |
|
|
b) Allocation of financial assets held for sale to the result for the period: 41620 |
0,00 |
0,00 |
0,00 |
0,00 |
0,00 |
|
|
17. Exchange rate differences : 41700 |
-454.000,00 |
536.000,00 |
1.821.000,00 |
453.000,00 |
-9.079.000,00 |
|
|
18. Impairment and result for transfers of financial instruments: 41800 |
-86.939.000,00 |
-88.554.000,00 |
-23.757.000,00 |
-2.413.000,00 |
-14.050.000,00 |
|
|
a) Impairment and losses : 41810 |
-86.939.000,00 |
-88.554.000,00 |
-23.757.000,00 |
-2.413.000,00 |
-17.270.000,00 |
|
|
b) Results for transfers and other : 41820 |
0,00 |
0,00 |
0,00 |
0,00 |
3.220.000,00 |
|
|
19. Other financial income and expenditure: 42100 |
0,00 |
0,00 |
0,00 |
0,00 |
0,00 |
|
|
a) Incorporation of financial expenditure to assets: 42110 |
0,00 |
0,00 |
0,00 |
0,00 |
0,00 |
|
|
b) Financial income from arrangement with creditors: 42120 |
0,00 |
0,00 |
0,00 |
0,00 |
0,00 |
|
|
c) Other income and expenditure: 42130 |
0,00 |
0,00 |
0,00 |
0,00 |
0,00 |
|
|
A.2) FINANCIAL REVENUE (14+15+16+17+18+19) : 49200 |
-95.489.000,00 |
-103.738.000,00 |
-33.474.000,00 |
-19.681.000,00 |
-71.427.000,00 |
|
|
A.3) NET RESULT BEFORE TAXES (A.1+A.2) : 49300 |
-149.366.000,00 |
-62.092.000,00 |
-33.214.000,00 |
-172.549.000,00 |
-382.398.000,00 |
|
|
20. Income taxes: 41900 |
57.785.000,00 |
20.819.000,00 |
14.609.000,00 |
57.191.000,00 |
120.795.000,00 |
|
|
A.4) PROFIT AFTER TAXES (A.3+20) : 49400 |
-91.581.000,00 |
-41.273.000,00 |
-18.605.000,00 |
-115.358.000,00 |
-261.603.000,00 |
|
|
21. Result of the year coming from interrupted operations : 42000 |
0,00 |
0,00 |
0,00 |
0,00 |
0,00 |
|
|
A.5) RESULT OF THE PERIOD (A.4+21) : 49500 |
-91.581.000,00 |
-41.273.000,00 |
-18.605.000,00 |
-115.358.000,00 |
-261.603.000,00 |
|
> Normal Balance Sheet under the rules of the 1990 General Accounting Plan (repealed since 1st January of 2008)
Information corresponding to the fiscal year 2012 2011 2010 2009 2008 has been compiled based on the equivalence criteria stipulated in Act JUS/206/2009. Where the provisions of the Act did not establish relevant equivalence criteria, Axesor created such criteria using its own methodology. To view details on the methodology 2012 2011 2010 2009 2008 is taken from information submitted to the TRADE REGISTER.
|
|
EQUIVALENCIA |
EQUIVALENCIA |
EQUIVALENCIA |
EQUIVALENCIA |
EQUIVALENCIA |
|
|
ASSETS |
2012 |
2011 |
2010 |
2009 |
2008 |
|
|
A) SHAREHOLDERS (PARTNERS) BY UNCALLED SUSCRIBED CAPITAL: |
0,00 |
0,00 |
0,00 |
0,00 |
0,00 |
|
|
B) FIXED ASSETS: |
468.179.000,00 |
544.969.000,00 |
620.189.000,00 |
699.502.000,00 |
752.244.000,00 |
|
|
I. Formation expenses: |
0,00 |
0,00 |
0,00 |
0,00 |
0,00 |
|
|
II. Intangible fixed assets: |
10.685.000,00 |
9.604.000,00 |
17.317.000,00 |
22.678.000,00 |
29.229.000,00 |
|
|
1. Research and development costs: |
0,00 |
0,00 |
0,00 |
0,00 |
0,00 |
|
|
2. Concessions, patents, licences, trademarks et al.: |
433.000,00 |
479.000,00 |
666.000,00 |
1.716.000,00 |
3.000.000,00 |
|
|
3. Goodwill: |
1.408.000,00 |
1.408.000,00 |
1.408.000,00 |
1.408.000,00 |
1.408.000,00 |
|
|
4. Key money paid for premises: |
6.461.000,00 |
5.418.000,00 |
12.366.000,00 |
14.532.000,00 |
18.162.000,00 |
|
|
5. Software: |
2.383.000,00 |
2.299.000,00 |
2.877.000,00 |
5.022.000,00 |
6.659.000,00 |
|
|
6. Assets under capital leases: |
0,00 |
0,00 |
0,00 |
0,00 |
0,00 |
|
|
7. Payments on account: |
0,00 |
0,00 |
0,00 |
0,00 |
0,00 |
|
|
8. Provisions: |
0,00 |
0,00 |
0,00 |
0,00 |
0,00 |
|
|
9. Accumulated depreciation: |
0,00 |
0,00 |
0,00 |
0,00 |
0,00 |
|
|
III. Tangible fixed assets: |
412.140.000,00 |
407.926.000,00 |
390.885.000,00 |
442.605.000,00 |
485.228.000,00 |
|
|
1. Land and construction: |
59.739.000,00 |
63.213.000,00 |
67.922.000,00 |
69.942.000,00 |
73.390.000,00 |
|
|
2. Technical installations and machinery: |
279.642.681,00 |
284.119.729,00 |
264.961.695,00 |
307.128.415,00 |
397.200.527,00 |
|
|
3. Other installations, tools and furniture: |
443.086,00 |
450.180,00 |
419.824,00 |
486.636,00 |
629.353,00 |
|
|
4. Payments on account and tangible fixed assets under construction: |
67.577.000,00 |
55.329.000,00 |
53.092.000,00 |
59.844.000,00 |
7.278.000,00 |
|
|
5. Other tangible assets: |
4.738.233,00 |
4.814.092,00 |
4.489.480,00 |
5.203.948,00 |
6.730.120,00 |
|
|
6. Provisions: |
0,00 |
0,00 |
0,00 |
0,00 |
0,00 |
|
|
7. Accumulated depreciation: |
0,00 |
0,00 |
0,00 |
0,00 |
0,00 |
|
|
IV. Financial investments: |
45.354.000,00 |
127.439.000,00 |
211.987.000,00 |
234.219.000,00 |
237.787.000,00 |
|
|
1. Equity investments in group companies: |
39.774.299,00 |
111.886.679,00 |
187.727.480,00 |
208.969.970,00 |
211.134.570,00 |
|
|
2. Receivables from group companies: |
134.481,00 |
139.236,00 |
156.216,00 |
172.177,00 |
178.969,00 |
|
|
3. Equity investment in associated companies: |
4.582.701,00 |
12.891.321,00 |
21.629.520,00 |
24.077.030,00 |
24.326.430,00 |
|
|
4. Credits to associated companies: |
261.519,00 |
270.764,00 |
303.784,00 |
334.823,00 |
348.031,00 |
|
|
5. Long-term securities portfolio: |
96.000,00 |
191.000,00 |
99.000,00 |
165.000,00 |
165.000,00 |
|
|
6. Other receivables: |
1.000,00 |
212.000,00 |
245.000,00 |
500.000,00 |
22.000,00 |
|
|
7. Long term guarantees and deposits: |
504.000,00 |
1.848.000,00 |
1.826.000,00 |
0,00 |
1.612.000,00 |
|
|
8. Provisions: |
0,00 |
0,00 |
0,00 |
0,00 |
0,00 |
|
|
9. Long-term receivables from public bodies: |
0,00 |
0,00 |
0,00 |
0,00 |
0,00 |
|
|
V. Own shares: |
0,00 |
0,00 |
0,00 |
0,00 |
0,00 |
|
|
VI. Long-term trade receivables: |
0,00 |
0,00 |
0,00 |
0,00 |
0,00 |
|
|
C) Deferred expenses: |
0,00 |
0,00 |
0,00 |
0,00 |
0,00 |
|
|
D) CURRENT ASSETS: |
1.221.206.000,00 |
1.039.481.000,00 |
868.599.000,00 |
697.792.000,00 |
667.913.000,00 |
|
|
I. Called-up share capital (not paid): |
0,00 |
0,00 |
0,00 |
0,00 |
0,00 |
|
|
II. Stocks: |
281.623.000,00 |
288.432.000,00 |
245.437.000,00 |
203.815.000,00 |
194.763.000,00 |
|
|
1. Goods for resale: |
165.000,00 |
167.000,00 |
70.000,00 |
597.000,00 |
762.000,00 |
|
|
2. Raw materials and other consumables: |
47.543.000,00 |
51.452.000,00 |
49.399.000,00 |
61.206.000,00 |
71.295.000,00 |
|
|
3. Goods in process and semifinished ones: |
6.280.000,00 |
5.531.000,00 |
4.985.000,00 |
6.040.000,00 |
8.425.000,00 |
|
|
4. Finished products: |
227.199.000,00 |
230.816.000,00 |
190.308.000,00 |
134.834.000,00 |
112.509.000,00 |
|
|
5. Byproducts, scrap and recovered materials: |
268.000,00 |
297.000,00 |
505.000,00 |
203.000,00 |
349.000,00 |
|
|
6. Payments on account: |
168.000,00 |
169.000,00 |
170.000,00 |
935.000,00 |
1.423.000,00 |
|
|
7. Provisions: |
0,00 |
0,00 |
0,00 |
0,00 |
0,00 |
|
|
III. Debtors: |
619.847.000,00 |
498.699.000,00 |
473.685.000,00 |
370.923.000,00 |
430.134.000,00 |
|
|
1. Trade debtors / accounts receivable: |
391.881.000,00 |
311.611.000,00 |
337.967.000,00 |
237.440.000,00 |
224.400.000,00 |
|
|
2. Accounts receivable, Group companies: |
138.473.011,00 |
119.019.640,00 |
92.780.604,00 |
96.875.316,00 |
151.787.302,00 |
|
|
3. Accounts receivable, associated companies: |
516.989,00 |
444.360,00 |
346.396,00 |
361.684,00 |
566.698,00 |
|
|
4. Other debtors: |
17.927.000,00 |
10.658.000,00 |
9.206.000,00 |
12.887.000,00 |
24.732.000,00 |
|
|
5. Staff: |
0,00 |
0,00 |
0,00 |
0,00 |
4.228.000,00 |
|
|
6. Public bodies: |
71.049.000,00 |
56.966.000,00 |
33.385.000,00 |
23.359.000,00 |
24.420.000,00 |
|
|
7. Provisions: |
0,00 |
0,00 |
0,00 |
0,00 |
0,00 |
|
|
IV. Short-term investments: |
316.562.000,00 |
249.849.000,00 |
141.767.000,00 |
119.002.000,00 |
38.734.000,00 |
|
|
1. Equity investments in group companies: |
0,00 |
0,00 |
0,00 |
0,00 |
0,00 |
|
|
2. Receivables from group companies: |
314.119.000,00 |
249.843.000,00 |
141.761.000,00 |
114.515.000,00 |
33.882.000,00 |
|
|
3. Equity investment in associated companies: |
0,00 |
0,00 |
0,00 |
0,00 |
0,00 |
|
|
4. Credits to associated companies: |
0,00 |
0,00 |
0,00 |
0,00 |
0,00 |
|
|
5. Short term securities portfolio: |
0,00 |
0,00 |
0,00 |
4.415.000,00 |
4.405.000,00 |
|
|
6. Other receivables: |
2.443.000,00 |
6.000,00 |
6.000,00 |
72.000,00 |
0,00 |
|
|
7. Shor term guarantees and deposits: |
0,00 |
0,00 |
0,00 |
0,00 |
447.000,00 |
|
|
8. Provisions: |
0,00 |
0,00 |
0,00 |
0,00 |
0,00 |
|
|
V. Short-term treasury shares: |
0,00 |
0,00 |
0,00 |
0,00 |
0,00 |
|
|
VI. Cash at bank and in hand: |
1.201.000,00 |
581.000,00 |
5.271.000,00 |
449.000,00 |
627.000,00 |
|
|
VII. Prepayments and accrued income: |
1.973.000,00 |
1.920.000,00 |
2.439.000,00 |
3.603.000,00 |
3.655.000,00 |
|
|
GENERAL TOTAL (A + B + C + D): |
1.689.385.000,00 |
1.584.450.000,00 |
1.488.788.000,00 |
1.397.294.000,00 |
1.420.157.000,00 |
|
MERCANTILE REGISTRY.
|
|
EQUIVALENCIA |
EQUIVALENCIA |
EQUIVALENCIA |
EQUIVALENCIA |
EQUIVALENCIA |
|
|
LIABILITIES |
2012 |
2011 |
2010 |
2009 |
2008 |
|
|
A) EQUITY: |
45.772.000,00 |
123.778.000,00 |
-335.210.100,00 |
-320.790.000,00 |
-205.178.000,00 |
|
|
I. Subscribed capital: |
60.461.000,00 |
60.461.000,00 |
60.461.000,00 |
60.461.000,00 |
60.461.000,00 |
|
|
II. Share premium: |
116.005.000,00 |
116.005.000,00 |
116.005.000,00 |
116.005.000,00 |
116.005.000,00 |
|
|
III. Revaluation reserves: |
22.021.007,00 |
22.428.684,00 |
22.823.353,00 |
22.888.413,00 |
22.974.144,00 |
|
|
IV. Reserves: |
292.698.993,00 |
278.716.316,00 |
278.061.547,00 |
273.811.587,00 |
273.979.856,00 |
|
|
1. Legal reserve: |
12.092.000,00 |
12.092.000,00 |
12.092.000,00 |
12.092.000,00 |
12.092.000,00 |
|
|
2. Reserves for own shares: |
0,00 |
0,00 |
0,00 |
0,00 |
0,00 |
|
|
3. Reserves for shares of the controlling company: |
0,00 |
0,00 |
0,00 |
0,00 |
0,00 |
|
|
4. Statutory reserves: |
0,00 |
0,00 |
0,00 |
0,00 |
0,00 |
|
|
5. Miscellaneous reserves: |
280.605.981,00 |
266.623.285,00 |
265.968.498,00 |
261.718.535,00 |
261.886.800,00 |
|
|
Differences due to capital adjustement to euros: |
1.012,00 |
1.031,00 |
1.049,00 |
1.052,00 |
1.056,00 |
|
|
V. Profit or loss brought forward: |
-353.833.000,00 |
-312.560.000,00 |
-793.956.000,00 |
-678.598.000,00 |
-416.995.000,00 |
|
|
1. Retained earnings: |
0,00 |
0,00 |
0,00 |
0,00 |
0,00 |
|
|
2. Prior year losses: |
-935.260.000,00 |
-893.987.000,00 |
-875.383.000,00 |
-678.598.000,00 |
-498.421.000,00 |
|
|
3. Partners' contributions so as to compensate losses: |
581.427.000,00 |
581.427.000,00 |
81.427.000,00 |
0,00 |
81.426.000,00 |
|
|
VI. Profit or loss for the financial year: |
-91.581.000,00 |
-41.273.000,00 |
-18.605.000,00 |
-115.358.000,00 |
-261.603.000,00 |
|
|
VII. Interim dividend paid: |
0,00 |
0,00 |
0,00 |
0,00 |
0,00 |
|
|
VIII. Own shares for capital reduction: |
0,00 |
0,00 |
0,00 |
0,00 |
0,00 |
|
|
B) Deferred income: |
1.498.000,00 |
1.897.000,00 |
1.150.100,00 |
0,00 |
0,00 |
|
|
1. Capital grants: |
1.498.000,00 |
1.897.000,00 |
1.150.100,00 |
0,00 |
0,00 |
|
|
2. Unrealised exchange gains: |
0,00 |
0,00 |
0,00 |
0,00 |
0,00 |
|
|
3. Other deferred income: |
0,00 |
0,00 |
0,00 |
0,00 |
0,00 |
|
|
4. Public revenues to distribute in several financial years: |
0,00 |
0,00 |
0,00 |
0,00 |
0,00 |
|
|
C) PROVISIONS FOR LIABILITIES AND CHARGES: |
1.812.000,00 |
3.520.000,00 |
17.236.000,00 |
16.216.000,00 |
15.650.000,00 |
|
|
1. Provisions for pension fund and other similar obligations: |
222.000,00 |
1.869.000,00 |
1.794.000,00 |
1.218.000,00 |
0,00 |
|
|
2. Provisions for taxes: |
1.378.839,00 |
1.431.738,00 |
13.391.215,00 |
13.006.180,00 |
13.571.591,00 |
|
|
3. Other provisions: |
211.161,00 |
219.262,00 |
2.050.785,00 |
1.991.820,00 |
2.078.409,00 |
|
|
4. Reversion fund: |
0,00 |
0,00 |
0,00 |
0,00 |
0,00 |
|
|
D) LONG TERM LIABILITIES: |
464.362.000,00 |
457.695.000,00 |
455.703.000,00 |
352.564.000,00 |
3.959.000,00 |
|
|
I. Issued debentures and other marketable securities: |
0,00 |
0,00 |
0,00 |
0,00 |
0,00 |
|
|
1. Non-convertible debentures: |
0,00 |
0,00 |
0,00 |
0,00 |
0,00 |
|
|
2. Convertible debentures: |
0,00 |
0,00 |
0,00 |
0,00 |
0,00 |
|
|
3. Other debt securities: |
0,00 |
0,00 |
0,00 |
0,00 |
0,00 |
|
|
II. Amounts owed to credit institutions: |
0,00 |
0,00 |
0,00 |
0,00 |
0,00 |
|
|
1. Loans and other liabilities: |
0,00 |
0,00 |
0,00 |
0,00 |
0,00 |
|
|
2. Long-term liabilities from capital leases: |
0,00 |
0,00 |
0,00 |
0,00 |
0,00 |
|
|
III. Debts with companies of the group and affiliated ones: |
0,00 |
0,00 |
0,00 |
0,00 |
0,00 |
|
|
1. Amounts owed to group companies: |
0,00 |
0,00 |
0,00 |
0,00 |
0,00 |
|
|
2. Amounts owed to associated companies: |
0,00 |
0,00 |
0,00 |
0,00 |
0,00 |
|
|
IV. Other creditors: |
464.362.000,00 |
457.695.000,00 |
455.703.000,00 |
352.564.000,00 |
3.959.000,00 |
|
|
1. Long-term bills of exchange payable: |
0,00 |
0,00 |
0,00 |
0,00 |
0,00 |
|
|
2. Other creditors: |
454.658.000,00 |
453.992.000,00 |
452.896.000,00 |
349.763.000,00 |
970.000,00 |
|
|
3. Long term guarantees and deposits received: |
0,00 |
0,00 |
0,00 |
0,00 |
0,00 |
|
|
4. Long term payables to public bodies: |
9.704.000,00 |
3.703.000,00 |
2.807.000,00 |
2.801.000,00 |
2.989.000,00 |
|
|
V. Unpaid portion of equity investment: |
0,00 |
0,00 |
0,00 |
0,00 |
0,00 |
|
|
1. Group companies: |
0,00 |
0,00 |
0,00 |
0,00 |
0,00 |
|
|
2. Associated companies: |
0,00 |
0,00 |
0,00 |
0,00 |
0,00 |
|
|
3. Third parties: |
0,00 |
0,00 |
0,00 |
0,00 |
0,00 |
|
|
VI. Long term trade creditors: |
0,00 |
0,00 |
0,00 |
0,00 |
0,00 |
|
|
E) SHORT TERM CREDITORS: |
1.175.941.000,00 |
997.560.000,00 |
1.349.909.000,00 |
1.349.304.000,00 |
1.605.726.000,00 |
|
|
I. Issued debentures and other marketable securities: |
0,00 |
0,00 |
0,00 |
43.000,00 |
0,00 |
|
|
1. Non-convertible debentures: |
0,00 |
0,00 |
0,00 |
43.000,00 |
0,00 |
|
|
2. Convertible debentures: |
0,00 |
0,00 |
0,00 |
0,00 |
0,00 |
|
|
3. Other debt securities: |
0,00 |
0,00 |
0,00 |
0,00 |
0,00 |
|
|
4. Accrued interest on debentures and other debt securities: |
0,00 |
0,00 |
0,00 |
0,00 |
0,00 |
|
|
II. Amounts owed to credit institutions: |
0,00 |
415.000,00 |
1.079.000,00 |
0,00 |
8.531.000,00 |
|
|
1. Loans and other liabilities: |
0,00 |
415.000,00 |
1.079.000,00 |
0,00 |
8.531.000,00 |
|
|
2. Accrued interest on liabilities with credit institutions: |
0,00 |
0,00 |
0,00 |
0,00 |
0,00 |
|
|
3. Short-term liabilities from capital leases: |
0,00 |
0,00 |
0,00 |
0,00 |
0,00 |
|
|
III. Short-term amounts owed to group and associated companies: |
1.063.184.000,00 |
859.981.000,00 |
1.217.556.000,00 |
1.219.706.000,00 |
1.415.388.000,00 |
|
|
1. Amounts owed to group companies: |
1.063.184.000,00 |
859.981.000,00 |
1.217.556.000,00 |
1.219.706.000,00 |
1.415.388.000,00 |
|
|
2. Amounts owed to associated companies: |
0,00 |
0,00 |
0,00 |
0,00 |
0,00 |
|
|
IV. Trade creditors: |
94.373.000,00 |
103.131.000,00 |
96.949.000,00 |
103.579.000,00 |
140.632.000,00 |
|
|
1. Advanced payments from customers: |
0,00 |
0,00 |
0,00 |
0,00 |
0,00 |
|
|
2. Amounts owed for purchases of goods or services: |
94.373.000,00 |
103.131.000,00 |
96.949.000,00 |
103.579.000,00 |
140.632.000,00 |
|
|
3. Debts represented by notes payable: |
0,00 |
0,00 |
0,00 |
0,00 |
0,00 |
|
|
V. Other creditors: |
11.280.000,00 |
13.480.000,00 |
12.499.000,00 |
11.451.000,00 |
22.275.000,00 |
|
|
1. Public bodies: |
11.280.000,00 |
13.480.000,00 |
12.499.000,00 |
11.450.000,00 |
12.930.000,00 |
|
|
2. Bills of exchange payable: |
0,00 |
0,00 |
0,00 |
0,00 |
0,00 |
|
|
3. Miscellaneous debts: |
0,00 |
0,00 |
0,00 |
816,00 |
362.993,00 |
|
|
4. Wages and salaries payable: |
0,00 |
0,00 |
0,00 |
0,00 |
8.900.000,00 |
|
|
5. Guarantees and deposits received at short term: |
0,00 |
0,00 |
0,00 |
184,00 |
82.007,00 |
|
|
VI. Provisions: |
7.104.000,00 |
20.553.000,00 |
21.826.000,00 |
14.300.000,00 |
18.162.000,00 |
|
|
VII. Prepayments and accrued income: |
0,00 |
0,00 |
0,00 |
225.000,00 |
738.000,00 |
|
|
F) SHORT-TERM PROVISIONS FOR LIABILITIES AND CHARGES: |
0,00 |
0,00 |
0,00 |
0,00 |
0,00 |
|
|
GENERAL TOTAL (A + B + C + D + E + F): |
1.689.385.000,00 |
1.584.450.000,00 |
1.488.788.000,00 |
1.397.294.000,00 |
1.420.157.000,00 |
|
MERCANTILE REGISTRY.
|
|
EQUIVALENCIA |
EQUIVALENCIA |
EQUIVALENCIA |
EQUIVALENCIA |
EQUIVALENCIA |
|
|
DEBIT |
2012 |
2011 |
2010 |
2009 |
2008 |
|
|
A) CHARGES (A.1 to A.15): |
3.829.175.000,00 |
3.796.128.000,00 |
3.155.080.000,00 |
1.982.870.000,00 |
3.327.560.000,00 |
|
|
A.1. Stock reduction of both manufactured goods and the ones in process: |
2.898.000,00 |
0,00 |
0,00 |
46.005.000,00 |
56.935.000,00 |
|
|
A.2. Supplies: |
2.663.381.000,00 |
2.661.882.000,00 |
2.119.433.000,00 |
1.423.243.000,00 |
2.244.384.000,00 |
|
|
a) Stock consumption: |
334.783.000,00 |
369.622.000,00 |
329.819.000,00 |
403.260.000,00 |
643.006.000,00 |
|
|
b) Consumption of raw materials and miscellaneous consumable ones: |
2.328.598.000,00 |
2.292.260.000,00 |
1.789.614.000,00 |
1.019.983.000,00 |
1.601.378.000,00 |
|
|
c) Miscellaneous external expenditure: |
0,00 |
0,00 |
0,00 |
0,00 |
0,00 |
|
|
A.3. Staff costs: |
85.716.000,00 |
93.078.000,00 |
102.241.000,00 |
94.480.000,00 |
107.859.000,00 |
|
|
a) Wages, salaries et al.: |
64.285.000,00 |
69.861.000,00 |
79.708.000,00 |
69.678.000,00 |
81.524.000,00 |
|
|
b) Social security costs: |
21.431.000,00 |
23.217.000,00 |
22.533.000,00 |
24.802.000,00 |
26.335.000,00 |
|
|
A.4. Depreciation expense: |
28.925.000,00 |
26.893.000,00 |
73.152.000,00 |
85.806.000,00 |
104.594.000,00 |
|
|
A.5. Variation of trade provisions and losses of unrecovered receivables: |
2.758.000,00 |
2.079.000,00 |
-2.310.000,00 |
-66.224.000,00 |
65.490.000,00 |
|
|
a) Stock provision variation: |
2.337.000,00 |
0,00 |
0,00 |
-65.800.000,00 |
60.924.000,00 |
|
|
b) Variation in provision and bad debt losses: |
421.000,00 |
2.079.000,00 |
-2.310.000,00 |
-424.000,00 |
4.566.000,00 |
|
|
c) Variation of other trade provisions: |
0,00 |
0,00 |
0,00 |
0,00 |
0,00 |
|
|
A.6. Other operating charges: |
980.744.000,00 |
916.361.000,00 |
825.357.000,00 |
430.460.000,00 |
542.823.000,00 |
|
|
a) External services: |
954.193.000,00 |
902.954.000,00 |
798.046.000,00 |
409.653.000,00 |
514.814.000,00 |
|
|
b) Taxes: |
7.176.000,00 |
7.226.000,00 |
7.008.000,00 |
5.589.000,00 |
7.161.000,00 |
|
|
c) Other operating expenses: |
19.375.000,00 |
6.181.000,00 |
20.303.000,00 |
15.218.000,00 |
20.848.000,00 |
|
|
d) Allocation to revision fund: |
0,00 |
0,00 |
0,00 |
0,00 |
0,00 |
|
|
A.I. OPERATING BENEFITS (B.1+B.2+B.3+B.4-A.1-A.2-A.3-A.4-A.5-A.6): |
0,00 |
50.205.000,00 |
12.176.000,00 |
0,00 |
0,00 |
|
|
A.7. Financial and similar charges: |
13.839.000,00 |
19.085.000,00 |
13.873.000,00 |
19.007.000,00 |
50.078.000,00 |
|
|
a) Due to liabilities with companies of the group: |
13.415.000,00 |
18.379.000,00 |
12.853.000,00 |
18.569.000,00 |
44.766.000,00 |
|
|
b) Due to liabilities with associated companies: |
0,00 |
0,00 |
0,00 |
0,00 |
0,00 |
|
|
c) Due to other debts.: |
424.000,00 |
706.000,00 |
1.020.000,00 |
438.000,00 |
5.312.000,00 |
|
|
d) Losses from financial investments: |
0,00 |
0,00 |
0,00 |
0,00 |
0,00 |
|
|
A.8. Changes in financial investment provisions: |
3.056.230,00 |
3.376.691,00 |
1.446.821,00 |
443.602,00 |
-4.182,00 |
|
|
A.9. Exchange losses: |
454.000,00 |
0,00 |
0,00 |
0,00 |
9.079.000,00 |
|
|
A.II. NET FINANCIAL INCOME (B.5+B.6+B.7+B.8-A.7-A.8-A.9): |
0,00 |
0,00 |
0,00 |
0,00 |
0,00 |
|
|
A.III. PROFIT FROM ORDINARY ACTIVITIES (A.I+A.II-B.I-B.II): |
0,00 |
31.644.309,00 |
1.012.179,00 |
0,00 |
0,00 |
|
|
A.10. Changes in provisions for intangible, tangible and securities portfolio: |
101.912.770,00 |
92.678.309,00 |
36.496.179,00 |
6.840.398,00 |
25.335.182,00 |
|
|
A.11. Losses from tangible and intangible fixed assets and securities portfolio: |
3.276.000,00 |
1.514.000,00 |
0,00 |
0,00 |
192.000,00 |
|
|
A.12. Losses from transactions with own shares and debentures: |
0,00 |
0,00 |
0,00 |
0,00 |
0,00 |
|
|
A.13. Extraordinary expenses: |
0,00 |
0,00 |
0,00 |
0,00 |
0,00 |
|
|
A.14. Expenses and losses of former financial years: |
0,00 |
0,00 |
0,00 |
0,00 |
0,00 |
|
|
A.IV. EXTRAORDINARY PROFIT (B.9+B.10+B.11+B.12+B.13-A.10-A.11-A.12-A.13-A.14): |
0,00 |
0,00 |
0,00 |
0,00 |
0,00 |
|
|
A.V. PROFIT BEFORE TAXES (A.III+A.IV-B.III-B.IV): |
0,00 |
0,00 |
0,00 |
0,00 |
0,00 |
|
|
A.15. Corporation tax: |
-57.785.000,00 |
-20.819.000,00 |
-14.609.000,00 |
-57.191.000,00 |
120.795.000,00 |
|
|
A.16. Miscellaneous taxes: |
0,00 |
0,00 |
0,00 |
0,00 |
0,00 |
|
|
A.VI. FINANCIAL YEAR RESULTS (PROFIT) (A.V-A.15-A.16): |
0,00 |
0,00 |
0,00 |
0,00 |
0,00 |
|
MERCANTILE REGISTRY.
|
|
EQUIVALENCIA |
EQUIVALENCIA |
EQUIVALENCIA |
EQUIVALENCIA |
EQUIVALENCIA |
|
|
CREDIT |
2012 |
2011 |
2010 |
2009 |
2008 |
|
|
B) INCOME ( B.1 to B.13): |
3.737.594.000,00 |
3.754.855.000,00 |
3.136.475.000,00 |
1.867.512.000,00 |
2.824.367.000,00 |
|
|
B.1. Net total sales: |
3.680.821.000,00 |
3.642.232.000,00 |
3.014.091.000,00 |
1.788.523.000,00 |
2.735.139.000,00 |
|
|
a) Sales: |
3.731.004.622,00 |
3.691.889.506,00 |
3.055.184.550,00 |
1.812.907.386,00 |
2.772.429.371,00 |
|
|
b) Rendering of services: |
0,00 |
0,00 |
0,00 |
0,00 |
0,00 |
|
|
Returns and Rappel on sales: |
-50.183.622,00 |
-49.657.506,00 |
-41.093.550,00 |
-24.384.386,00 |
-37.290.371,00 |
|
|
B.2. Stock increase of manufactured goods and products in process: |
0,00 |
40.846.000,00 |
54.720.000,00 |
0,00 |
0,00 |
|
|
B.3. Works performed by the company for fixed assets: |
251.000,00 |
9.519.000,00 |
7.423.000,00 |
4.684.000,00 |
9.428.000,00 |
|
|
B.4. Miscellaneous operating income: |
42.054.000,00 |
57.901.000,00 |
53.815.000,00 |
71.685.000,00 |
74.800.000,00 |
|
|
a) Auxiliary income and other from current management: |
41.727.000,00 |
40.409.000,00 |
37.007.000,00 |
51.978.000,00 |
47.628.000,00 |
|
|
b) Grants: |
327.000,00 |
16.923.000,00 |
16.808.000,00 |
19.707.000,00 |
27.136.000,00 |
|
|
c) Liabilities and charges provisions surplus: |
0,00 |
569.000,00 |
0,00 |
0,00 |
36.000,00 |
|
|
B.I. PÉRDIDAS DE EXPLOTACIÓN (A.1+A.2+A.3+A.4+A.5-A.6-B.1-B.2-B.3-B.4): |
41.296.000,00 |
0,00 |
0,00 |
148.878.000,00 |
302.718.000,00 |
|
|
B.5. Income from equity investment: |
2.427.000,00 |
1.000,00 |
881.000,00 |
818.000,00 |
619.000,00 |
|
|
a) In companies of the group: |
2.427.000,00 |
1.000,00 |
881.000,00 |
818.000,00 |
619.000,00 |
|
|
b) In associated companies: |
0,00 |
0,00 |
0,00 |
0,00 |
0,00 |
|
|
c) Third parties: |
0,00 |
0,00 |
0,00 |
0,00 |
0,00 |
|
|
B.6. Income from other marketable securities and long-term receivables: |
1.094.622,00 |
1.081.590,00 |
505.655,00 |
293.203,00 |
269.539,00 |
|
|
a) From companies of the group: |
1.090.714,00 |
1.076.429,00 |
505.357,00 |
291.786,00 |
263.214,00 |
|
|
b) From associated companies: |
0,00 |
0,00 |
0,00 |
0,00 |
0,00 |
|
|
c) From companies out of the group: |
3.908,00 |
5.161,00 |
298,00 |
1.417,00 |
6.324,00 |
|
|
B.7. Miscellaneous interests or similar income: |
2.221.378,00 |
2.282.410,00 |
948.345,00 |
618.797,00 |
4.111.461,00 |
|
|
a) From companies of the group: |
1.963.286,00 |
1.937.571,00 |
909.643,00 |
525.214,00 |
473.786,00 |
|
|
b) From associated companies: |
0,00 |
0,00 |
0,00 |
0,00 |
0,00 |
|
|
c) Miscellaneous interests: |
258.092,00 |
340.839,00 |
19.702,00 |
93.583,00 |
417.676,00 |
|
|
d) Profit on financial investment: |
0,00 |
4.000,00 |
19.000,00 |
0,00 |
3.220.000,00 |
|
|
B.8. Exchange positive differences: |
0,00 |
536.000,00 |
1.821.000,00 |
453.000,00 |
0,00 |
|
|
B.II. NEGATIVE FINANCIAL RESULTS (A.7+A.8+A.9-B.5-B.6-B.7-B.8): |
11.606.230,00 |
18.560.691,00 |
11.163.821,00 |
17.267.602,00 |
54.152.818,00 |
|
|
B.III. LOSSES ON ORDINARY ACTIVITIES ( B.I + B.II - A.I - A.II ): |
52.902.230,00 |
0,00 |
0,00 |
166.145.602,00 |
356.870.818,00 |
|
|
B.9.Profit on disposal of both tangible and intangible fixed assets and securities portfolio: |
0,00 |
0,00 |
2.096.000,00 |
437.000,00 |
0,00 |
|
|
B.10. Profit on transactions with own shares and debentures: |
0,00 |
0,00 |
0,00 |
0,00 |
0,00 |
|
|
B.11. Capital grants transferred to profit and loss: |
8.725.000,00 |
456.000,00 |
174.000,00 |
0,00 |
0,00 |
|
|
B.12. Extraordinary income: |
0,00 |
0,00 |
0,00 |
0,00 |
0,00 |
|
|
B.13. Income and profit of former financial years: |
0,00 |
0,00 |
0,00 |
0,00 |
0,00 |
|
|
B.IV. NEGATIVE EXTRAORDINARY RESULTS (A.10+A.11+A.12+A.13+A.14-B.9-B.10-B.11-B.12-B.13): |
96.463.770,00 |
93.736.309,00 |
34.226.179,00 |
6.403.398,00 |
25.527.182,00 |
|
|
B.V. LOSSES BEFORE TAXES (B.III+B.IV-A.III-A.IV): |
149.366.000,00 |
62.092.000,00 |
33.214.000,00 |
172.549.000,00 |
382.398.000,00 |
|
|
B.VI. RESULT OF THE PERIOD (LOSSES) (B.V+A.15+A.16): |
91.581.000,00 |
41.273.000,00 |
18.605.000,00 |
115.358.000,00 |
258.383.000,00 |
|
CASHFLOW STATEMENT
Model: Normal
> Source of information: Data contained in this section is taken from the information declared in the Annual Accounts submitted to the Trade Register.
|
|
2012 |
2011 |
2010 |
2009 |
2008 |
|
|
1. Fiscal year result before taxes.: 61100 |
-149.366.000,00 |
-62.092.000,00 |
-33.214.000,00 |
-172.549.000,00 |
-382.398.000,00 |
|
|
2. Results adjustments.: 61200 |
139.909.000,00 |
140.096.000,00 |
149.351.000,00 |
63.657.000,00 |
246.036.000,00 |
|
|
a) Fixed Assets Amortization (+).: 61201 |
28.924.000,00 |
26.893.000,00 |
73.151.000,00 |
85.805.000,00 |
104.594.000,00 |
|
|
b) Obsolescence Allowances (+/-). : 61202 |
-6.971.000,00 |
12.375.000,00 |
-878.000,00 |
-65.799.000,00 |
67.606.000,00 |
|
|
c) Variation in Provision (+/-). : 61203 |
12.000.000,00 |
85.619.000,00 |
47.348.000,00 |
-1.686.000,00 |
24.030.000,00 |
|
|
d) Allocation of grants (-).: 61204 |
-8.725.000,00 |
0,00 |
-2.310.000,00 |
0,00 |
-27.136.000,00 |
|
|
e) Results on disposal of fixed assets (+/-). : 61205 |
-469.000,00 |
277.000,00 |
22.304.000,00 |
28.503.000,00 |
192.000,00 |
|
|
f) Results on disposal of financial instruments (+/-).: 61206 |
104.968.000,00 |
0,00 |
0,00 |
0,00 |
-3.220.000,00 |
|
|
g) Financial income (-).: 61207 |
-3.316.000,00 |
-2.316.000,00 |
-2.316.000,00 |
-1.730.000,00 |
-1.780.000,00 |
|
|
h) Financial Expenses (+). : 61208 |
13.839.000,00 |
18.713.000,00 |
13.873.000,00 |
19.007.000,00 |
49.395.000,00 |
|
|
i) Exchange differences (+/-). : 61209 |
454.000,00 |
536.000,00 |
-1.821.000,00 |
-453.000,00 |
9.080.000,00 |
|
|
j) Reasonable Value Variation in Financial Instruments (+/-).: 61210 |
0,00 |
-308.000,00 |
0,00 |
-10.000,00 |
-2.363.000,00 |
|
|
k) Other income and expense (-/+). : 61211 |
-795.000,00 |
-1.693.000,00 |
0,00 |
20.000,00 |
25.638.000,00 |
|
|
3. Changes in current capital equity.: 61300 |
-341.931.000,00 |
145.598.000,00 |
-132.444.000,00 |
-184.812.000,00 |
117.095.000,00 |
|
|
a) Stock (+/-).: 61301 |
13.780.000,00 |
-55.370.000,00 |
-40.744.000,00 |
56.747.000,00 |
55.349.000,00 |
|
|
d) Debtors and other accounts receivable (+/-). : 61302 |
-67.640.000,00 |
-1.702.000,00 |
-85.133.000,00 |
1.504.000,00 |
298.268.000,00 |
|
|
c) Other current assets (+/-). : 61303 |
-53.000,00 |
519.000,00 |
1.164.000,00 |
52.000,00 |
-1.432.000,00 |
|
|
d) Creditors and other accounts payable (+/-). : 61304 |
-288.018.000,00 |
202.151.000,00 |
-7.731.000,00 |
-243.115.000,00 |
-235.090.000,00 |
|
|
4. Other cash flows for operating activities.: 61400 |
4.912.000,00 |
-8.686.000,00 |
-6.546.000,00 |
119.080.000,00 |
-6.997.000,00 |
|
|
a) Interest payments (-). : 61401 |
-8.113.000,00 |
-9.605.000,00 |
-7.333.000,00 |
-522.000,00 |
-49.765.000,00 |
|
|
b) Dividend payment collection (+). : 61402 |
7.000,00 |
1.000,00 |
881.000,00 |
818.000,00 |
0,00 |
|
|
c) Interest collection (+). : 61403 |
2.426.000,00 |
343.000,00 |
20.000,00 |
832.000,00 |
1.780.000,00 |
|
|
d) Income tax payment collection (payments) (+/-).: 61404 |
10.592.000,00 |
575.000,00 |
-114.000,00 |
117.952.000,00 |
40.988.000,00 |
|
|
5. Operating activity cash flows (1 + 2 + 3 + 4) : 61500 |
-346.476.000,00 |
214.916.000,00 |
-22.853.000,00 |
-174.624.000,00 |
-26.264.000,00 |
|
|
6. Payments for investment (-).: 62100 |
-121.943.000,00 |
-152.938.000,00 |
-61.800.000,00 |
-142.013.000,00 |
-84.517.000,00 |
|
|
a) Companies of the group and affiliates. : 62101 |
-6.421.000,00 |
-109.419.000,00 |
-28.524.000,00 |
-80.553.000,00 |
-1.702.000,00 |
|
|
b) Intangible fixed assets. : 62102 |
-51.261.000,00 |
-43.533.000,00 |
-273.000,00 |
-21.059.000,00 |
-3.421.000,00 |
|
|
c) Fixed assets. : 62103 |
0,00 |
0,00 |
-32.822.000,00 |
-40.401.000,00 |
-52.732.000,00 |
|
|
e) Other financial assets. : 62105 |
-61.995.000,00 |
14.000,00 |
-181.000,00 |
0,00 |
-26.596.000,00 |
|
|
h) Other assets. : 62108 |
-2.266.000,00 |
0,00 |
0,00 |
0,00 |
-66.000,00 |
|
|
7. Divestment payment collection (+). : 62200 |
0,00 |
0,00 |
0,00 |
1.509.000,00 |
8.480.000,00 |
|
|
a) Companies of the group and affiliates. : 62201 |
0,00 |
0,00 |
0,00 |
0,00 |
8.040.000,00 |
|
|
c) Fixed assets. : 62203 |
0,00 |
0,00 |
0,00 |
0,00 |
166.000,00 |
|
|
d) Real estate investment. : 62204 |
0,00 |
0,00 |
0,00 |
0,00 |
3.000,00 |
|
|
e) Other financial assets. : 62205 |
0,00 |
0,00 |
0,00 |
1.509.000,00 |
0,00 |
|
|
h) Other assets. : 62208 |
0,00 |
0,00 |
0,00 |
0,00 |
271.000,00 |
|
|
8. Investment activity cash flows (6 + 7) minus Amortization: 62300 |
-121.943.000,00 |
-152.938.000,00 |
-61.800.000,00 |
-140.504.000,00 |
-76.037.000,00 |
|
|
9. Payment collection and payments for equity instruments. : 63100 |
8.068.000,00 |
500.001.000,00 |
0,00 |
0,00 |
38.000.000,00 |
|
|
a) Issuance of equity instruments (+). : 63101 |
0,00 |
500.001.000,00 |
0,00 |
0,00 |
38.000.000,00 |
|
|
d) Disposal of own equity instruments (+). : 63104 |
8.068.000,00 |
500.001.000,00 |
0,00 |
0,00 |
0,00 |
|
|
10. Payment collection and payments for financial liabilities instruments.: 63200 |
460.419.000,00 |
-566.840.000,00 |
84.534.000,00 |
317.313.000,00 |
73.576.000,00 |
|
|
a) Issuance : 63201 |
486.219.000,00 |
2.277.000,00 |
84.792.000,00 |
331.253.000,00 |
187.558.000,00 |
|
|
3. Debts incurred with companies of the group and affiliates (+).: 63204 |
0,00 |
0,00 |
94.508.000,00 |
328.883.000,00 |
187.535.000,00 |
|
|
4. Special characteristic debts (+). : 63205 |
486.219.000,00 |
2.277.000,00 |
0,00 |
0,00 |
0,00 |
|
|
5. Other debts (+). : 63206 |
0,00 |
0,00 |
-9.716.000,00 |
2.370.000,00 |
23.000,00 |
|
|
b) Repayment and amortization of : 63207 |
-25.800.000,00 |
-569.117.000,00 |
-258.000,00 |
-13.940.000,00 |
-113.982.000,00 |
|
|
2. Debts incurred with credit institutions (-).: 63209 |
0,00 |
0,00 |
1.035.000,00 |
-9.324.000,00 |
-113.586.000,00 |
|
|
3. Debts incurred with companies of the group and affiliates (-). : 63210 |
-25.800.000,00 |
-569.117.000,00 |
0,00 |
0,00 |
-341.000,00 |
|
|
5. Other debts (-). : 63212 |
0,00 |
0,00 |
-1.293.000,00 |
-4.616.000,00 |
-55.000,00 |
|
|
11. Payments from dividends and remunerations from other assets instruments. : 63300 |
0,00 |
0,00 |
0,00 |
0,00 |
0,00 |
|
|
12. Cash flows for financing activities (9+10+11).: 63400 |
468.487.000,00 |
-66.839.000,00 |
84.534.000,00 |
317.313.000,00 |
111.576.000,00 |
|
|
D) EFECTO DE LAS VARIACIONES DE LOS TIPOS DE CAMBIO: 64000 |
552.000,00 |
171.000,00 |
526.000,00 |
-2.363.000,00 |
-9.080.000,00 |
|
|
E) NET INCREASE/DECREASE OF CASH OR EQUIVALENT ASSETS (+/-5+/-8+/12+/-D) : 65000 |
620.000,00 |
-4.690.000,00 |
407.000,00 |
-178.000,00 |
195.000,00 |
|
|
Cash or equivalent assets as of beginning of the fiscal year.: 65100 |
581.000,00 |
5.271.000,00 |
4.864.000,00 |
627.000,00 |
432.000,00 |
|
|
Cash or equivalent assets as of end of the fiscal year.: 65200 |
1.201.000,00 |
581.000,00 |
5.271.000,00 |
449.000,00 |
627.000,00 |
|
FINANCIAL DIAGNOSIS
> Economic-Financial Comparative Analysis
Data used in the following ratios and indicators is taken from the Annual Accounts submitted by the company to the TRADE REGISTER.
> Comparison within the Sector
|
Cash Flow |
2012 |
2011 |
Variación 2012 - 2011 |
|
|||
|
|
Empresa |
Sector |
Empresa |
Sector |
Empresa |
Sector |
|
|
Cash Flow over Sales: |
0,00 % |
0,01 % |
0,00 % |
0,00 % |
|
|
|
|
EBITDA over Sales: |
-0,34 % |
9,59 % |
2,10 % |
10,06 % |
-116,00 % |
-4,71 % |
|
|
Cash Flow Yield: |
0,00 % |
0,01 % |
0,00 % |
0,00 % |
|
|
|
|
Profitability |
2012 |
2011 |
Variación 2012 - 2011 |
|
|||
|
|
Empresa |
Sector |
Empresa |
Sector |
Empresa |
Sector |
|
|
Operating economic profitability: |
-4,06 % |
5,76 % |
3,45 % |
6,97 % |
-217,64 % |
-17,24 % |
|
|
Total economic profitability: |
-8,02 % |
2,81 % |
-2,71 % |
4,18 % |
-195,55 % |
-32,75 % |
|
|
Financial profitability: |
-339,91 % |
2,00 % |
-34,82 % |
5,88 % |
-876,11 % |
-66,07 % |
|
|
Margin: |
-1,45 % |
5,23 % |
1,12 % |
6,36 % |
-228,88 % |
-17,75 % |
|
|
Mark-up: |
-4,01 % |
2,01 % |
-1,67 % |
4,73 % |
-139,65 % |
-57,55 % |
|
|
Solvency |
2012 |
2011 |
Variación 2012 - 2011 |
|
|||
|
|
Empresa |
Sector |
Empresa |
Sector |
Empresa |
Sector |
|
|
Liquidity: |
0,00 |
0,13 |
0,00 |
0,11 |
|
20,03 |
|
|
Acid Test: |
0,75 |
0,88 |
0,72 |
0,83 |
4,43 |
6,15 |
|
|
Working Capital / Investment: |
-0,01 |
0,04 |
0,00 |
0,03 |
|
46,34 |
|
|
Solvency: |
1,04 |
1,22 |
1,06 |
1,16 |
-1,80 |
5,38 |
|
|
Indebtedness |
2012 |
2011 |
Variación 2012 - 2011 |
|
|||
|
|
Empresa |
Sector |
Empresa |
Sector |
Empresa |
Sector |
|
|
Indebtedness level: |
33,27 |
1,56 |
11,10 |
1,65 |
199,64 |
-5,41 |
|
|
Borrowing Composition: |
0,40 |
1,13 |
0,47 |
1,04 |
-15,19 |
8,68 |
|
|
Repayment Ability: |
2.634,19 |
111,25 |
-305,91 |
635,82 |
961,11 |
-82,50 |
|
|
Warranty: |
1,03 |
1,65 |
1,10 |
1,61 |
-6,34 |
2,21 |
|
|
Generated resources / Total creditors: |
0,02 |
0,07 |
0,05 |
0,07 |
-68,47 |
2,57 |
|
|
Efficiency |
2012 |
2011 |
Variación 2012 - 2011 |
|
|||
|
|
Empresa |
Sector |
Empresa |
Sector |
Empresa |
Sector |
|
|
Productivity: |
0,86 |
1,76 |
1,82 |
1,75 |
-53,04 |
0,41 |
|
|
Turnover of Collection Rights : |
6,63 |
4,89 |
8,18 |
4,49 |
-18,95 |
8,95 |
|
|
Turnover of Payment Entitlements: |
34,49 |
3,53 |
31,05 |
3,27 |
11,07 |
8,10 |
|
|
Stock rotation: |
13,37 |
6,87 |
12,69 |
6,09 |
5,36 |
12,83 |
|
|
Assets turnover: |
2,80 |
1,10 |
3,07 |
1,10 |
-8,72 |
0,62 |
|
|
Borrowing Cost: |
0,85 |
3,06 |
1,33 |
2,93 |
-36,30 |
4,50 |
|
> Trend of indicators under the General Accounting Plan of 2007 (2012, 2011, 2010, 2009, 2008)
|
Cash Flow |
2012 |
2011 |
2010 |
2009 |
2008 |
|
|
Cash Flow over Sales: |
0,00 % |
0,00 % |
0,00 % |
0,00 % |
0,01 % |
|
|
EBITDA over Sales: |
-0,34 % |
2,10 % |
2,83 % |
-3,53 % |
-7,24 % |
|
|
Cash Flow Yield: |
0,00 % |
0,00 % |
0,00 % |
0,00 % |
0,01 % |
|
|
Profitability |
2012 |
2011 |
2010 |
2009 |
2008 |
|
|
Operating economic profitability: |
-4,06 % |
3,45 % |
0,02 % |
-14,64 % |
-27,19 % |
|
|
Total economic profitability: |
-8,02 % |
-2,71 % |
-1,30 % |
-10,99 % |
-23,40 % |
|
|
Financial profitability: |
-339,91 % |
-34,82 % |
5,47 % |
35,87 % |
126,84 % |
|
|
Margin: |
-1,45 % |
1,12 % |
0,01 % |
-8,20 % |
-11,03 % |
|
|
Mark-up: |
-4,01 % |
-1,67 % |
-1,08 % |
-9,25 % |
-2,53 % |
|
|
Solvency |
2012 |
2011 |
2010 |
2009 |
2008 |
|
|
Liquidity: |
0,00 |
0,00 |
0,00 |
0,00 |
0,00 |
|
|
Acid Test: |
0,75 |
0,72 |
0,45 |
0,36 |
0,29 |
|
|
Working Capital / Investment: |
-0,01 |
0,00 |
-0,34 |
-0,48 |
-0,65 |
|
|
Solvency: |
1,04 |
1,06 |
0,65 |
0,52 |
0,42 |
|
|
Indebtedness |
2012 |
2011 |
2010 |
2009 |
2008 |
|
|
Indebtedness level: |
33,27 |
11,10 |
-5,63 |
-5,54 |
-8,38 |
|
|
Borrowing Composition: |
0,40 |
0,47 |
0,34 |
0,26 |
0,00 |
|
|
Repayment Ability: |
2.634,19 |
-305,91 |
369,93 |
-9.480,72 |
-12,83 |
|
|
Warranty: |
1,03 |
1,10 |
0,83 |
0,83 |
0,89 |
|
|
Generated resources / Total creditors: |
0,02 |
0,05 |
0,04 |
-0,06 |
-0,05 |
|
|
Efficiency |
2012 |
2011 |
2010 |
2009 |
2008 |
|
|
Productivity: |
0,86 |
1,82 |
1,83 |
0,33 |
-0,84 |
|
|
Turnover of Collection Rights : |
6,63 |
8,18 |
6,82 |
5,24 |
6,75 |
|
|
Turnover of Payment Entitlements: |
34,49 |
31,05 |
27,38 |
15,14 |
7,55 |
|
|
Stock rotation: |
13,37 |
12,69 |
12,48 |
9,88 |
16,03 |
|
|
Assets turnover: |
2,80 |
3,07 |
2,71 |
1,79 |
2,47 |
|
|
Borrowing Cost: |
0,85 |
1,33 |
0,78 |
1,13 |
3,15 |
|
|
COMPARATIVE SECTORIAL BALANCE |
Sector-based Comparison under the rules of the New General Accounting Plan.
|
|
Variación - |
|
|
|
Empresa |
Sector |
|
|
Variación - |
|
|
|
Empresa |
Sector |
|
|
Variación - |
|
|
|
Empresa |
Sector |
|
News |
|
LaRazón.es |
10/11/2013 |
|
Explosión en una planta de Repsol en Tarragona sin heridos |
|
|
Companies related |
|
|
|
|
No Public Tenders assigned to the name of the company.
|
Detail of Subsidies appearing in Balances Memories |
|
|
|
|
|
Entity |
ORGANISMO NO ESPECIFICADO |
|
Status |
CONCEDIDA |
|
Amount Granted |
8.360.000,00 |
|
Notes |
Subvención de derechos CO2. El importe reflejado corresponde al imputado a resultados en este ejercicio, quedando un saldo pendiente al cierre de 114.000 euros. |
|
Entity |
ORGANISMO NO ESPECIFICADO |
|
Status |
CONCEDIDA |
|
Amount Granted |
365.000,00 |
|
Notes |
El importe reflejado corresponde al imputado a resultados en este ejercicio, quedando un saldo pendiente al cierre de 2.026.000 euros. |
|
Entity |
ORGANISMO NO ESPECIFICADO |
|
Status |
CONCEDIDA |
|
Amount Granted |
2.710.000,00 |
|
Notes |
El importe reflejado corresponde al saldo al cierre del ejercicio. |
|
Entity |
ORGANISMO NO ESPECIFICADO |
|
Status |
CONCEDIDA |
|
Amount Granted |
174.000,00 |
|
Notes |
El importe reflejado corresponde al imputado a la cuenta de pérdidas y ganancias, quedando un saldo pendiente de imputar de 1.643.000 euros. |
Research Summary
|
It is a large size company engaged in the manufacture of chemicals derived from petroleum. It belongs to an important corporate Group of the petrochemical sector, which has been operating for several years, without incidents. |
|
Sources |
|
Registry of Commerce's Official Gazette. Own and external data bases Company References |
FOREIGN EXCHANGE RATES
|
Currency |
Unit
|
Indian Rupees |
|
US Dollar |
1 |
Rs.61.12 |
|
|
1 |
Rs.102.54 |
|
Euro |
1 |
Rs.81.87 |
INFORMATION DETAILS
|
Report Prepared
by : |
TPT |
RATING EXPLANATIONS
|
RATING |
STATUS |
PROPOSED CREDIT LINE |
|
|
>86 |
Aaa |
Possesses an extremely sound financial base with the strongest
capability for timely payment of interest and principal sums |
Unlimited |
|
71-85 |
Aa |
Possesses adequate working capital. No caution needed for credit transaction.
It has above average (strong) capability for payment of interest and
principal sums |
Large |
|
56-70 |
A |
Financial & operational base are regarded healthy. General unfavourable
factors will not cause fatal effect. Satisfactory capability for payment of
interest and principal sums |
Fairly Large |
|
41-55 |
Ba |
Overall operation is considered normal. Capable to meet normal
commitments. |
Satisfactory |
|
26-40 |
B |
Capability to
overcome financial difficulties seems comparatively below average. |
Small |
|
11-25 |
Ca |
Adverse factors are apparent. Repayment of interest and principal sums
in default or expected to be in default upon maturity |
Limited with full
security |
|
<10 |
C |
Absolute credit risk exists. Caution needed to be exercised |
Credit not
recommended |
|
-- |
NB |
New Business |
-- |
This score serves as a reference to assess SC’s credit risk
and to set the amount of credit to be extended. It is calculated from a
composite of weighted scores obtained from each of the major sections of this
report. The assessed factors and their relative weights (as indicated through
%) are as follows:
Financial
condition (40%) Ownership
background (20%) Payment
record (10%)
Credit history
(10%) Market trend
(10%) Operational
size (10%)
This report is issued at your request without any
risk and responsibility on the part of MIRA INFORM PRIVATE LIMITED (MIPL)
or its officials.