MIRA
INFORM REPORT
|
Report Date : |
18.08.2014 |
IDENTIFICATION DETAILS
|
Name : |
CVB ECOLOGISTICS B.V. |
|
|
|
|
Registered Office : |
Wilhelminapark 37 5041EC |
|
|
|
|
Country : |
|
|
|
|
|
Financials (as on) : |
31.12.2013 |
|
|
|
|
Date of Incorporation : |
01.11.1978 |
|
|
|
|
Com. Reg. No.: |
18026887 |
|
|
|
|
Legal Form : |
Private Company |
|
|
|
|
Line of Business : |
Wholesale of used materials and waste materials |
|
|
|
|
No. of Employees |
26 |
RATING & COMMENTS
|
MIRA’s Rating : |
B |
|
RATING |
STATUS |
PROPOSED CREDIT LINE |
|
|
26-40 |
B |
Capability to overcome financial difficulties seems comparatively
below average. |
Small |
|
Status : |
Moderate |
|
Payment Behaviour : |
No complaints |
|
Litigation : |
Clear |
NOTES :
Any query related to this report can be made
on e-mail : infodept@mirainform.com
while quoting report number, name and date.
ECGC Country Risk Classification List – June 1, 2014
|
Country Name |
Previous Rating (31.03.2014) |
Current Rating (01.06.2014) |
|
|
A1 |
A1 |
|
Risk Category |
ECGC
Classification |
|
Insignificant |
A1 |
|
Low |
A2 |
|
Moderate |
B1 |
|
High |
B2 |
|
Very High |
C1 |
|
Restricted |
C2 |
|
Off-credit |
D |
|
Source
: CIA |
Company name and address
|
Company name |
CVB
ECOLOGISTICS B.V. |
|
Operative address |
Wilhelminapark
37 5041EC |
|
Legal form |
Private Company |
|
Registration number |
KvK-nummer: 18026887 |
|
VAT-number |
006889050 |
|
Year |
2013 |
|
Mutation |
2012 |
|
Mutation |
2011 |
|
Fixed
assets |
1.411.356 |
|
-23,01 |
1.833.135 |
|
-10,50 |
2.048.249 |
|
Total
receivables |
9.719.742 |
|
-31,18 |
14.124.208 |
|
14,47 |
12.338.782 |
|
|
|||||||
|
Total
equity |
4.663.760 |
|
-0,13 |
4.669.663 |
|
-0,28 |
4.682.947 |
|
Short term
liabilities |
6.310.737 |
|
-43,34 |
11.138.267 |
|
13,92 |
9.777.663 |
|
|
|||||||
|
Net result |
-5.903 |
* |
55,56 |
-13.284 |
|
-101,25 |
1.060.207 |
|
|
|||||||
|
Working
capital |
3.415.534 |
|
12,98 |
3.023.208 |
|
9,40 |
2.763.445 |
|
Quick ratio |
1,54 |
|
21,26 |
1,27 |
|
-0,78 |
1,28 |
Contact information
Company name CVB Ecologistics
B.V.
Trade names CVB Ecologistics
B.V.
Operative address Wilhelminapark 37
5041EC
Correspondence address Wilhelminapark 37
5041EC
Telephone number 013 4647999
Fax number 013 4647991
Email address info@cvbecologistics.com
Website www.cvbecologistics.com
Registration
Registration number KvK-nummer:
18026887
Registered in
Kamer
van Koophandel
Branch number 000016832248
VAT-number 006889050
Status Active
Memorandum 1984-04-27
Establishment date
1978-11-01
Legal form Private Company
Last proposed admendment 2002-12-12
Activities
SBI Wholesale of other
used materials and waste materials (46779)
Exporter Yes
Importer Yes
Goal De handel in oud
papier,plastics en andere recycleproducten
Relations
Shareholders Lindans B.V.
Wilhelminapark 37
5041EC
Registration number: 180351600000
Percentage: 100%
Companies on same address
Belrosa B.V.
Registration number: 180130300000
Lindans B.V.
Registration number: 180351600000
CVB Holding B.V.
Registration number: 180809180000
Cavabe B.V.
Registration number: 180809270000
Livabe B.V.
Registration number: 180809210000
Management
Active management
Lindans B.V.
Wilhelminapark 37
5041EC
Registration number: 180351600000
Competence: Fully authorized
Function: Manager
Starting date: 2009-01-01
R.A. Getkate (Richard Alain)
Competence: Fully authorized
Function: Manager
Starting date: 2009-01-01
Date of birth: 1972-08-06,
Employees
|
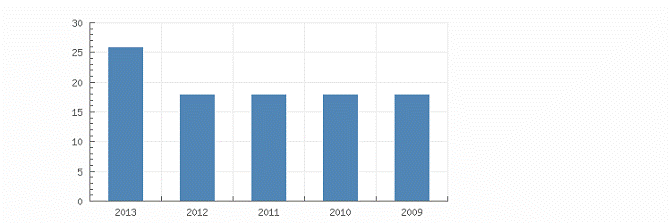
Year |
|
2013 |
2012 |
2011 |
2010 |
2009 |
|
Total |
|
26 |
18 |
18 |
18 |
18 |
Payments
Description Payments made under regular condition
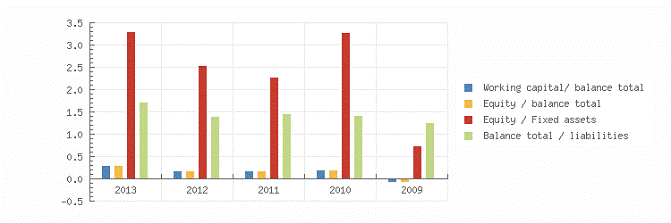
Key figures
Year 2013
2012 2011 2010 2009
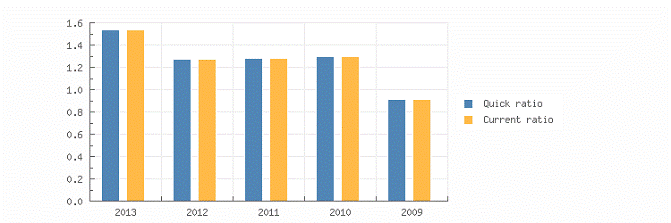
Quick ratio 1,54 1,27
1,28 1,30 0,91
Current ratio 1,54
1,27 1,28 1,30 0,91
Working capital/ balance total 0,31
0,19 0,19 0,21
-0,07
Equity / balance total 0,42
0,29 0,32 0,30 0,21
Equity / Fixed assets 3,30
2,55 2,29 3,28 0,74
Equity / liabilities
0,72 0,41 0,47 0,43 0,26
Balance total / liabilities 1,72
1,41 1,47 1,43 1,26
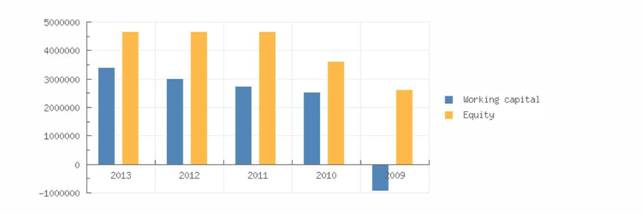
Working capital 3.415.534
3.023.208 2.763.445 2.554.426
-925.623
Equity 4.663.760
4.669.663 4.682.947 3.622.740
2.631.092
Mutation equity -0,13
-0,28 29,27 37,69 12,09
Mutation short term liabilities -43,34
13,92 15,51 -14,79
23,22
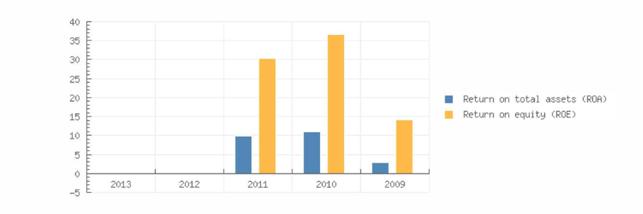
Return on total assets (ROA) -0,08
0,02 9,76 10,97 2,98
Return on equity (ROE) -0,19 0,08 30,41 36,71
14,23
Gross margin
2.126.782 2.660.014 3.994.576 3.493.505 2.065.341
Operating result -50.909 57.200 1.488.869 1.355.906 -88.395
Net result after taxes
-5.903 -13.284 1.060.207 991.648 283.835
Cashflow 3 26.454
1.319.404 1.221.966 409.816
EBIT 57.200
1.488.869 1.355.906 -88.395
EBITDA 396.938 1.748.066
1.586.224 37.586
Summary
The 2013 financial result structure is a postive working captial of
3.415.534 euro, which is in
agreement with 31 % of the total assets of the company.
The working capital has increased with 12.98 % compared to previous
year. The ratio, with
respect to the total assets of the company has however, increased.
The improvement between 2012 and 2013 has mainly been caused by an
increase of the
current assets.
The current ratio of the company in 2013 was 1.54. A company with a
current ratio between
1.5 and 3.0 generally indicates good short-term financial strength.
The quick ratio in 2013 of the company was 1.54. A company with a Quick
Ratio of more than
1 can currently pay back its current liabilities.
The 2012 financial result structure is a postive working captial of
3.023.208 euro, which is in
agreement with 19 % of the total assets of the company.
The working capital has increased with 9.4 % compared to previous year.
The ratio with
respect to the total assets of the company remains unchanged.
The improvement between 2011 and 2012 has mainly been caused by a
current liabilities
reduction.
The current ratio of the company in 2012 was 1.27. When the current
ratio is below 1.5, the
company may have problems meeting its short-term obligations.
The quick ratio in 2012 of the company was 1.27. A company with a Quick
Ratio of more than
1 can currently pay back its current liabilities.
Financial statement
Remark annual account The company is
obliged to file its financial statements.
Type of annual account Corporate
Annual account CVB
Ecologistics B.V.
Wilhelminapark 37
5041EC
Registration number: 180268870000
Balance
|
Year |
2013 |
2012 |
2011 |
2010 |
2009 |
|
End date |
2013-12-31 |
2012-12-31 |
2011-12-31 |
2010-12-31 |
2009-12-31 |
|
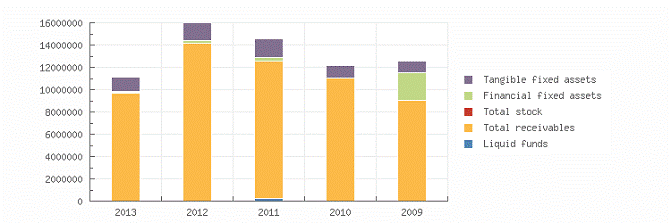
Tangible fixed assets |
1.257.975 |
1.569.194 |
1.671.393 |
1.086.776 |
1.022.445 |
|
Financial fixed assets |
153.381 |
263.941 |
376.856 |
16.292 |
2.540.725 |
|
Fixed assets |
1.411.356 |
1.833.135 |
2.048.249 |
1.103.068 |
3.563.170 |
|
|
|||||
|
Other stock |
6.529 |
|
|
|
|
|
Total stock |
6.529 |
37.267 |
|
||
|
Other
receivables |
9.719.742 |
|
|
|
|
|
Total receivables |
9.719.742 |
14.124.208 |
12.338.782 |
11.019.302 |
9.008.524 |
|
Liquid
funds |
|
|
202.326 |
|
|
|
Current assets |
9.726.271 |
14.161.475 |
12.541.108 |
11.019.302 |
9.008.524 |
|
Year |
2013 |
2012 |
2011 |
2010 |
2009 |
|
End date |
2013-12-31 |
2012-12-31 |
2011-12-31 |
2010-12-31 |
2009-12-31 |
|
Total assets |
11.137.627 |
15.994.610 |
14.589.357 |
12.122.370 |
12.571.694 |
|
|
|||||
|
Issued capital |
15.890 |
15.890 |
15.890 |
15.890 |
15.890 |
|
Legal and
statutory reserve |
|
|
2.110 |
2.110 |
2.110 |
|
Other
reserves |
4.647.870 |
4.653.773 |
4.664.947 |
3.604.740 |
2.613.092 |
|
Total reserves |
4.647.870 |
4.653.773 |
4.667.057 |
3.606.850 |
2.615.202 |
|
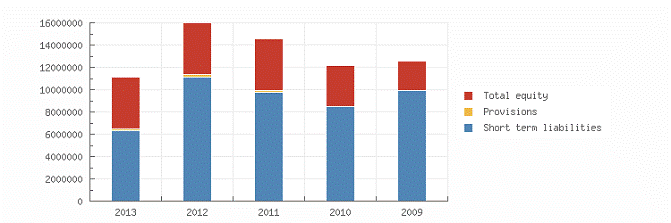
Total equity |
4.663.760 |
4.669.663 |
4.682.947 |
3.622.740 |
2.631.092 |
|
|
|||||
|
Provisions |
163.130 |
186.680 |
128.747 |
34.754 |
6.455 |
|
Other short
term liabilities |
6.310.737 |
|
|
|
|
|
Short term liabilities |
6.310.737 |
11.138.267 |
9.777.663 |
8.464.876 |
9.934.147 |
|
Total short and long term
liabilities |
6.473.867 |
11.324.947 |
9.906.410 |
8.499.630 |
9.940.602 |
|
Total liabilities |
11.137.627 |
15.994.610 |
14.589.357 |
12.122.370 |
12.571.694 |
Summary
The total assets of the company decreased with -30.37 % between 2012 and
2013.
This total assets decrease has been reflected in a reduction of non current
assets of -23.01
%.
Assets reduction is being explained by an indebtedness decrease -42.84 %
while the Net
Worth remains unchanged.
In 2013 the assets of the company were 12.67 % composed of fixed assets
and 87.33 % by
current assets. The assets are being financed by an equity of 41.87 %,
and total debt of
58.13 %.
The total assets of the company increased with 9.63 % between 2011 and
2012.
Despite the assets growth, the non current assets decreased with -10.5
%.
The asset growth is explained by a reduction of 14.32 % of the company's
indebtness, this
while, the Net Worth remains unchanged.
In 2012 the assets of the company were 11.46 % composed of fixed assets
and 88.54 % by
current assets. The assets are being financed by an equity of 29.2 %,
and total debt of 70.8
%.
Profit and loss
|
Year |
2013 |
2012 |
2011 |
2010 |
2009 |
|
Gross margin |
2.126.782 |
2.660.014 |
3.994.576 |
3.493.505 |
2.065.341 |
|
|
|||||
|
Wages and
salaries |
1.049.884 |
1.190.173 |
1.220.219 |
1.042.634 |
882.805 |
|
Amorization
and depreciation |
367.888 |
339.738 |
259.197 |
230.318 |
125.981 |
|
other
operating costs |
759.919 |
1.072.903 |
1.026.291 |
864.647 |
1.144.950 |
|
Operating
expenses |
2.177.691 |
2.602.814 |
2.505.707 |
2.137.599 |
2.153.736 |
|
Operating result |
-50.909 |
57.200 |
1.488.869 |
1.355.906 |
-88.395 |
|
|
|||||
|
Financial
income |
|
41.103 |
2.637 |
59.747 |
635.600 |
|
Financial
expenses |
|
94.367 |
67.396 |
85.787 |
172.730 |
|
Financial result |
42.155 |
-53.264 |
-64.759 |
-26.040 |
462.870 |
|
Result on ordinary operations
before taxes |
-8.754 |
3.936 |
1.424.110 |
1.329.866 |
374.475 |
|
|
|||||
|
Taxation on
the result of ordinary activities |
|
17.220 |
323.396 |
321.310 |
90.640 |
|
Result of ordinary activities after
taxes |
-8.754 |
-13.284 |
1.100.714 |
1.008.556 |
283.835 |
|
|
|||||
|
Extraordinary
income |
|
|
7.003 |
|
|
|
Extraordinary
expense |
|
|
47.510 |
16.908 |
|
|
Taxation
extraordinary result |
2.851 |
|
|
|
|
|
Extraordinary
result after taxation |
2.851 |
|
-40.507 |
-16.908 |
|
|
Net result |
-5.903 |
-13.284 |
1.060.207 |
991.648 |
283.835 |
|
|
|||||
|
Attributable
to shareholders |
-5.903 |
|
|
|
|
Summary
The gross profit of the company decreased by -20.05 % between 2012 and
2013.
The operating result of the company declined with -189 % between 2012
and 2013. This
evolution implies an decrease of the company's economic profitability.
The result of these changes is a reduction of the company's Economic
Profitability of -500 %
of the analysed period, being equal to 2012 % in the year 2013.
The Net Result of the company decreased by 55.56 % between 2012 and
2013.
The company's Financial Profitability has been negatively affected by
the financial activities in
comparison to the EBITs behaviour. The result of these variations is a
profitability reduction
of -337.5 % of the analysed period, being -0.19 % in the year 2013.
The company's financial profitability has been positively affected by
its financial structure.
The gross profit of the company decreased by -33.41 % between 2011 and
2012.
The operating result of the company declined with -96.16 % between 2011
and 2012. This
evolution implies an decrease of the company's economic profitability.
The result of these changes is a reduction of the company's Economic
Profitability of -99.8 %
of the analysed period, being equal to 2011 % in the year 2012.
The Net Result of the company increased by -101.25 % between 2011 and
2012.
The company's Financial Profitability has been positively affected by
the financial activities in
comparison to the EBITs behaviour. The result of these variations is a
profitability increase of
-99.74 % of the analysed period, being 0.08 % in the year 2012.
The company's financial profitability has been positively affected by
its financial structure
Analysis
Branch (SBI) Wholesale trade
(no motor vehicles and motorcycles) (46)
Region Midden-Brabant
In the
In the region Midden-Brabant 5737 of the
companies are registered with the SBI code 46
In the
In the region Midden-Brabant 108 of the
bankruptcies are published within this sector
The risk of this specific sector in the
The risk of this specific sector in the
region Midden-Brabant is normal
Publications
Filings 28-07-2014: De
jaarrekening over 2013 is gepubliceerd.
16-08-2013: De jaarrekening over 2012 is
gepubliceerd.
25-07-2012: De jaarrekening over 2011 is
gepubliceerd.
15-07-2011: De jaarrekening over 2010 is
gepubliceerd.
26-08-2010: De jaarrekening over 2009 is
gepubliceerd.
18-09-2009: De jaarrekening over 2008 is
gepubliceerd.
Amendments 23-11-2010: Per
1-1-2009 is de bevoegdheid van Bestuurder Richard Alain Getkate gewijzigd.
Company structure
Lindans B.V.
Wilhelminapark 37
5041EC
Registration number: 180351600000
• CVB Ecologistics B.V.
Wilhelminapark 37
5041EC
Registration number: 180268870000
FOREIGN EXCHANGE RATES
|
Currency |
Unit
|
Indian Rupees |
|
US Dollar |
1 |
Rs.61.06 |
|
|
1 |
Rs.101.84 |
|
Euro |
1 |
Rs.81.56 |
INFORMATION DETAILS
|
Analysis Done by
: |
SUB |
|
|
|
|
Report Prepared
by : |
|
RATING EXPLANATIONS
|
RATING |
STATUS |
PROPOSED CREDIT LINE |
|
|
|
>86 |
Aaa |
Possesses an extremely sound financial base with the strongest
capability for timely payment of interest and principal sums |
Unlimited |
|
|
71-85 |
Aa |
Possesses adequate working capital. No caution needed for credit transaction.
It has above average (strong) capability for payment of interest and
principal sums |
Large |
|
|
56-70 |
A |
Financial & operational base are regarded healthy. General unfavourable
factors will not cause fatal effect. Satisfactory capability for payment of
interest and principal sums |
Fairly Large |
|
|
41-55 |
Ba |
Overall operation is considered normal. Capable to meet normal
commitments. |
Satisfactory |
|
|
26-40 |
B |
Capability to
overcome financial difficulties seems comparatively below average. |
Small |
|
|
11-25 |
Ca |
Adverse factors are apparent. Repayment of interest and principal sums
in default or expected to be in default upon maturity |
Limited with
full security |
|
|
<10 |
C |
Absolute credit risk exists. Caution needed to be exercised |
Credit not
recommended |
|
|
-- |
NB |
New Business |
-- |
|
This score serves as a reference to assess SC’s credit risk and
to set the amount of credit to be extended. It is calculated from a composite
of weighted scores obtained from each of the major sections of this report. The
assessed factors and their relative weights (as indicated through %) are as
follows:
Financial
condition (40%) Ownership
background (20%) Payment
record (10%)
Credit history
(10%) Market trend
(10%) Operational
size (10%)
This report is issued at your request without any
risk and responsibility on the part of MIRA INFORM PRIVATE LIMITED (MIPL)
or its officials.