MIRA
INFORM REPORT
|
Report Date : |
19.08.2014 |
IDENTIFICATION DETAILS
|
Name : |
PS IT INFRASTRUCTURE AND SERVICES LIMITED |
|
|
|
|
Formerly Known
As : |
PARAG SHILPA INVESTMENT LIMITED |
|
|
|
|
Registered
Office : |
Flat No. 2, Ground Floor, Land Mark CHS, Dawood, Baug Cross Lane No.
1, Off J. P. Road, Andheri (West), Mumbai – 400058, Maharashtra |
|
|
|
|
Country : |
|
|
|
|
|
Financials (as
on) : |
31.03.2014 |
|
|
|
|
Date of
Incorporation : |
17.05.1982 |
|
|
|
|
Com. Reg. No.: |
11-027146 |
|
|
|
|
Capital
Investment / Paid-up Capital : |
Rs.537.600 Millions |
|
|
|
|
CIN No.: [Company Identification
No.] |
L72900MH1982PLC027146 |
|
|
|
|
Legal Form : |
A Public Limited Liability Company. The Company’s Shares are Listed on
the Stock Exchanges. |
|
|
|
|
Line of Business
: |
Trader of Computer Hardware and Software. |
|
|
|
|
No. of Employees
: |
Not Divulged |
RATING & COMMENTS
|
MIRA’s Rating : |
B (30) |
|
RATING |
STATUS |
PROPOSED CREDIT LINE |
|
|
26-40 |
B |
Capability to overcome financial difficulties seems comparatively
below average. |
Small |
|
Status : |
Moderate |
|
|
|
|
Payment Behaviour : |
Slow but correct |
|
|
|
|
Litigation : |
Clear |
|
|
|
|
Comments : |
Subject is an established company having a moderate track record. Profitability of the company seems to be low. However, trade relations are reported as fair. Business is active. Payment
are reported to be slow but correct. The company can be considered normal for business dealings with some
cautions. |
NOTES:
Any query related to this report can be made
on e-mail : infodept@mirainform.com
while quoting report number, name and date.
ECGC Country Risk Classification List – June 1, 2014
|
Country Name |
Previous Rating (31.03.2014) |
Current Rating (01.06.2014) |
|
India |
A1 |
A1 |
|
Risk Category |
ECGC Classification |
|
Insignificant |
A1 |
|
Low |
A2 |
|
Moderate |
B1 |
|
High |
B2 |
|
Very High |
C1 |
|
Restricted |
C2 |
|
Off-credit |
D |
INDIAN ECONOMIC OVERVIEW
N E W S
As per the latest IMF study, the total weigh of emerging markets in the
GDP of the world on a purchasing power parity basis has seen a sizeable shift.
It highlights how as against 51 % in 2005, the emerging economies now account
for close to 56 % of the global purchasing power GDP as per the latest survey.
And with the emerging economies growing at a faster rate than their developed
counterparts, there are every possibility that the their share goes up further
in the coming years. China may surpass the US over the next few years.
Politics and economics are very intricately connected. They tend to
influence each other in ways that could be very complex and far-reaching. The
prospects of the India’s economy have been seriously compromised due to
political corruption. High inflation, poor standard of living are to a great
extent a result of rampant corruption in the country. China on the other hand,
seems to be facing diametrically opposite challenge. American hedge fund
manager Jim Chanos has been keenly following the political and economic
development in the dragon economy and has figured out something that is quite
worrying. He is of the view that the Chinese economy could be heading toward
trouble on account of new Chinese President Xi Jingping’s very aggressive
anti-corruption drive. Chanos believes tat many things such as apartment sales,
luxury products, etc. were largely bought with dirty money. And it is now
beginning to impact consumption. This may indeed be bad news for an economy
that is struggling to transition from an investment-driven export-oriented
economy to a domestic consumption-driven economy.
A study published by Firstpost has revealed that asset classes like real
estate and equities were the biggest beneficiaries of the liberalization policies.
A firm called Ciane Analytics studied returns from assets including
equities, gold, fixed deposits, G-Secs and real estate since 1991. Real estate
outperformed every other asset classes during the 23-year period with an
annualized return of 20 % ! Equities came in second with annualized return of
15.5 % ! However, while these returns may seem mouthwatering, the fact is that
the return from equities adjusted for inflation came down to just 7.1 %.
Some brief news are as under
. R-Power to buy Jaypee’s hydro assets
. Investors await justice in NSEL case
. India seeks MFN status from Pakistan ahead of meeting
. Ukrain’s clashes with rebels hinder MH17 crash investigation
. India exploring merger of state-owned hydro PSUs
..Higher costs weigh down profit growth to slowest in 9 quarters
..Wal-Mart to expand wholesale business in India
. GMR group moves to strengthen balance sheet
. Central Bank to sell 4 % stake to Life Insurance Corporation
. Tata Chemicals plans to raise up to Rs 10000 mn.
RBI DEFAULTERS’ LIST STATUS
Subject’s name is not enlisted as a defaulter
in the publicly available RBI Defaulters’ list.
EPF (Employee Provident Fund) DEFAULTERS’ LIST STATUS
Subject’s name is not enlisted as a defaulter
in the publicly available EPF (Employee Provident Fund) Defaulters’ list as of
31-03-2014.
INFORMATION DECLINED
MANAGEMENT
NON-COOPERATIVE (Tel. No.: 91-22-26791790)
LOCATIONS
|
Registered Office : |
Flat No. 2, Ground Floor, Land Mark CHS, Dawood, Baug Cross Lane No. 1,
Off J. P. Road, Andheri (West), Mumbai – 400058, Maharashtra, India |
|
Tel. No. : |
91-22-26791790 |
|
Fax No. : |
91-22-26791790 |
|
E-Mail : |
|
|
Website : |
DIRECTORS
As on 31.03.2013
|
Name : |
Mr. Sajjan Kedia |
|
Designation : |
Chairman and Executive Director |
|
|
|
|
Name : |
Mr. Johar Pal Singh |
|
Designation : |
Independent Director |
|
|
|
|
Name : |
Mr. Sundaram Sankaranarayanan |
|
Designation : |
Independent Director |
|
Date of Birth/Age : |
56 Years |
|
Qualification : |
BSE, MBA |
|
|
|
|
Name : |
Mr. Pradeepkumar Pushkarmal Gupta |
|
Designation : |
Independent Director |
|
Date of Birth/Age : |
45 Years |
|
Qualification : |
Chartered Accountant |
MAJOR SHAREHOLDERS / SHAREHOLDING PATTERN
As on 30.06.2014
|
Category of
Shareholder |
No.
of Shares |
Percentage
of Holding |
|
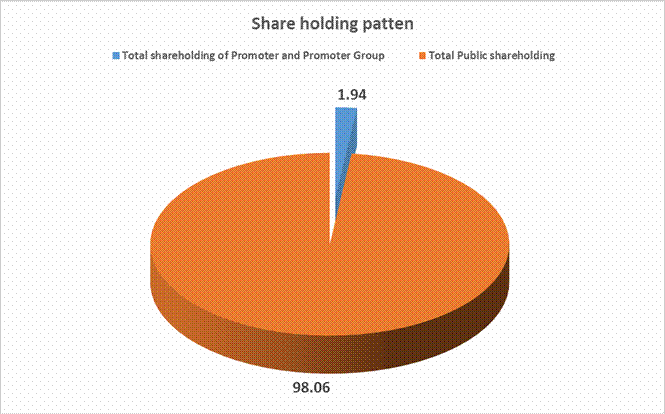
(A) Shareholding of Promoter and Promoter Group |
|
|
|
|
|
|
|
Bodies Corporate |
1045225 |
1.94 |
|
|
1045225 |
1.94 |
|
|
|
|
|
Total shareholding of Promoter and Promoter Group (A) |
1045225 |
1.94 |
|
(B) Public Shareholding |
|
|
|
|
|
|
|
|
|
|
|
|
10187194 |
18.95 |
|
|
|
|
|
|
4522648 |
8.41 |
|
|
37936018 |
70.57 |
|
|
68915 |
0.13 |
|
|
68615 |
0.13 |
|
|
300 |
0.00 |
|
|
52714775 |
98.06 |
|
Total Public shareholding (B) |
52714775 |
98.06 |
|
Total (A)+(B) |
53760000 |
100.00 |
|
(C) Shares held by Custodians and against which Depository
Receipts have been issued |
0 |
0.00 |
|
|
0 |
0.00 |
|
|
0 |
0.00 |
|
|
0 |
0.00 |
|
Total (A)+(B)+(C) |
53760000 |
0.00 |
BUSINESS DETAILS
|
Line of Business : |
Trader of Computer Hardware and Software. |
GENERAL INFORMATION
|
No. of Employees : |
Not Divulged |
|
|
|
|
Bankers : |
Dena Bank |
|
Banking
Relations : |
-- |
|
|
|
|
Auditors : |
|
|
Name : |
Rahul R Jain and Associates Chartered Accountants |
CAPITAL STRUCTURE
As on 30.09.2013
Authorised Capital : Not Available
Issued, Subscribed & Paid-up Capital : Rs.537.600 Millions
As on 30.09.2013
Authorised Capital :
|
No. of Shares |
Type |
Value |
Amount |
|
|
|
|
|
|
55520000 |
Equity Shares |
Rs.10/- each |
Rs. 555.200 Millions |
|
|
|
|
|
Issued, Subscribed & Paid-up Capital :
|
No. of Shares |
Type |
Value |
Amount |
|
|
|
|
|
|
55520000 |
Equity Shares |
Rs.10/- each |
Rs. 555.200 Millions |
|
|
|
|
|
As on 31.03.2013
Authorised Capital :
|
No. of Shares |
Type |
Value |
Amount |
|
|
|
|
|
|
13000000 |
Equity Shares |
Rs.10/- each |
Rs. 130.000 Millions |
|
|
|
|
|
Issued, Subscribed & Paid-up Capital :
|
No. of Shares |
Type |
Value |
Amount |
|
|
|
|
|
|
11240000 |
Equity Shares |
Rs.10/- each |
Rs. 112.400 Millions |
|
|
|
|
|
NOTE:
Terms and Rights
attached to Shares
Equity Shares
The company has one class of equity shares having a par value of Rs.10 each. Each shareholder is eligible for one vote per share held. The dividend proposed by the Board of Directors is subject to the approval of the shareholders in the ensuing Annual General Meeting, except in case of interim dividend.
In the event of liquidation, the equity shareholders are eligible to receive the remaining assets of the Company after distribution of all preferential amounts, in proportion to their shareholding.
Reconciliation of
shares outstanding at the beginning and at the end of the reporting period:
|
Equity Shares |
As at 31 March 2013 |
|
|
Number of Shares |
Rs. in Millions |
|
|
At the commencement of the period |
240000 |
2.400 |
|
Shares issued on exercise of employee stock options |
0 |
0.000 |
|
Shares issued during the year by way of Preferential Allotment |
1,10,00,000 |
110.000 |
|
At the end of the period |
1,12,40,000 |
112.400 |
Details of
Shareholders holding more than 5% shares in the company:
FINANCIAL DATA
[all figures are
in Rupees Millions]
ABRIDGED BALANCE SHEET
|
SOURCES OF FUNDS |
31.03.2014 |
31.03.2013 |
31.03.2012 |
|
I.
EQUITY
AND LIABILITIES |
|
|
|
|
(1)Shareholders'
Funds |
|
|
|
|
(a) Share Capital |
537.600 |
112.400 |
2.400 |
|
(b) Reserves & Surplus |
10.701 |
3.445 |
0.800 |
|
(c) Equity Share Suspense |
0.000 |
425.200 |
0.000 |
|
|
|
|
|
|
(2)
Share Application money pending allotment |
0.000 |
0.000 |
0.000 |
|
Total
Shareholders’ Funds (1) + (2) |
548.301 |
541.045 |
3.200 |
|
|
|
|
|
|
(3) Non-Current Liabilities |
|
|
|
|
(a) long-term Borrowings |
0.000 |
0.000 |
0.000 |
|
(b) Deferred Tax Liabilities (Net) |
0.000 |
0.000 |
0.000 |
|
(c) Other Long Term Liabilities |
0.000 |
0.000 |
0.000 |
|
(d) long-term Provisions |
0.000 |
0.000 |
0.000 |
|
Total Non-current Liabilities (3) |
0.000 |
0.000 |
0.000 |
|
|
|
|
|
|
(4) Current Liabilities |
|
|
|
|
(a) Short Term Borrowings |
388.129 |
32.305 |
1.267 |
|
(b) Trade Payables |
807.557 |
1134.130 |
0.000 |
|
(c) Other Current
Liabilities |
75.593 |
0.357 |
0.165 |
|
(d) Short-term Provisions |
3.674 |
0.646 |
0.311 |
|
Total Current Liabilities (4) |
1274.953 |
1167.438 |
1.743 |
|
|
|
|
|
|
TOTAL |
1823.254 |
1708.483 |
4.943 |
|
|
|
|
|
|
II.
ASSETS |
|
|
|
|
(1) Non-current assets |
|
|
|
|
(a) Fixed Assets |
|
|
|
|
(i) Tangible Assets |
0.015 |
0.029 |
0.000 |
|
(ii) Intangible Assets |
0.000 |
0.000 |
0.000 |
|
(iii) Capital
Work-in-Progress |
0.000 |
0.000 |
0.000 |
|
(iv)
Intangible assets under Development |
0.000 |
0.000 |
0.000 |
|
(b) Non-current Investments |
1208.037 |
942.545 |
0.000 |
|
(c) Deferred Tax Assets (net) |
0.000 |
0.000 |
0.000 |
|
(d) Long-term Loan and Advances |
54.847 |
701.567 |
0.000 |
|
(e) Other Non-current Assets |
3.195 |
3.993 |
0.000 |
|
Total Non-Current Assets |
1266.094 |
1648.134 |
0.000 |
|
|
|
|
|
|
(2) Current assets |
|
|
|
|
(a) Current Investments |
0.000 |
0.000 |
0.000 |
|
(b) Inventories |
43.953 |
43.175 |
0.000 |
|
(c) Trade Receivables |
284.890 |
14.523 |
0.000 |
|
(d) Cash and Cash
Equivalents |
2.256 |
1.952 |
0.015 |
|
(e) Short-term Loans and
Advances |
0.190 |
0.100 |
0.000 |
|
(f) Other Current Assets |
225.871 |
0.599 |
4.928 |
|
Total Current Assets |
557.160 |
060.349 |
4.943 |
|
|
|
|
|
|
TOTAL |
1823.254 |
1708.483 |
4.943 |
PROFIT & LOSS
ACCOUNT
|
|
PARTICULARS |
31.03.2014 |
31.03.2013 |
31.03.2012 |
|
|
|
SALES |
|
|
|
|
|
|
|
Income |
1036.231 |
1429.815 |
0.000 |
|
|
|
Other Income |
10.877 |
1.845 |
0.000 |
|
|
|
TOTAL |
1047.108 |
1431.660 |
0.000 |
|
|
|
|
|
|
|
|
Less |
EXPENSES |
|
|
|
|
|
|
|
Purchases of Stock-in-Trade |
1034.297 |
1348.694 |
0.000 |
|
|
|
Change in inventories |
(0.779) |
79.522 |
0.000 |
|
|
|
Employees benefits expense |
0.385 |
0.695 |
0.000 |
|
|
|
Exceptional Items |
0.000 |
0.000 |
0.794 |
|
|
|
Other expenses |
2.689 |
2.198 |
0.237 |
|
|
|
TOTAL |
1036.592 |
1431.109 |
1.031 |
|
|
|
|
|
|
|
|
|
PROFIT
/ (LOSS) BEFORE TAX, DEPRECIATION AND AMORTISATION |
10.516 |
0.551 |
(1.031) |
|
|
|
|
|
|
|
|
|
Less |
DEPRECIATION/
AMORTISATION |
0.000 |
0.003 |
0.000 |
|
|
|
|
|
|
|
|
|
|
PROFIT/
(LOSS) BEFORE TAX |
10.516 |
0.548 |
(1.031) |
|
|
|
|
|
|
|
|
|
Less |
TAX |
0.016 |
0.133 |
0.000 |
|
|
|
|
|
|
|
|
|
|
PROFIT/
(LOSS) AFTER TAX |
10.500 |
0.415 |
(1.031) |
|
|
|
|
|
|
|
|
|
|
Earnings /
(Loss) Per Share (Rs.) |
0.13 |
0.01 |
(4.30) |
|
KEY RATIOS
|
PARTICULARS |
|
31.03.2014 |
31.03.2013 |
31.03.2012 |
|
PAT / Total Income |
(%) |
1.00 |
0.03 |
0.00 |
|
|
|
|
|
|
|
Net Profit Margin (PBT/Sales) |
(%) |
1.01 |
0.04 |
0.00 |
|
|
|
|
|
|
|
Return on Total Assets (PBT/Total Assets} |
(%) |
1.71 |
0.07 |
(20.86) |
|
|
|
|
|
|
|
Return on Investment (ROI) (PBT/Networth) |
|
0.02 |
0.00 |
(0.32) |
|
|
|
|
|
|
|
Debt Equity Ratio (Total Debt/Networth) |
|
0.71 |
0.06 |
0.40 |
|
|
|
|
|
|
|
Current Ratio (Current Asset/Current Liability) |
|
0.44 |
0.05 |
2.84 |
FINANCIAL ANALYSIS
[all figures are
in Rupees Millions]
DEBT EQUITY RATIO
|
Particular |
31.03.2012 |
31.03.2013 |
31.03.2014 |
|
|
Rs.
In Millions |
Rs.
In Millions |
Rs.
In Millions |
|
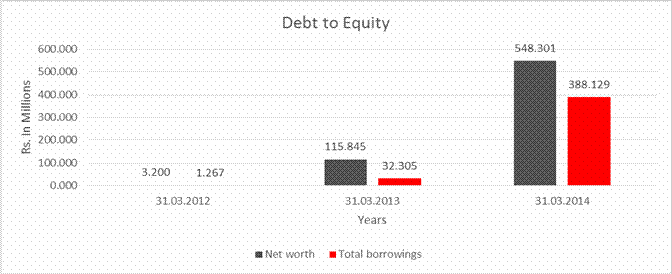
Share Capital |
2.400 |
112.400 |
537.600 |
|
Reserves & Surplus |
0.800 |
3.445 |
10.701 |
|
Net
worth |
3.200 |
115.845 |
548.301 |
|
|
|
|
|
|
long-term borrowings |
0.000 |
0.000 |
0.000 |
|
Short term borrowings |
1.267 |
32.305 |
388.129 |
|
Total
borrowings |
1.267 |
32.305 |
388.129 |
|
Debt/Equity
ratio |
0.396 |
0.279 |
0.708 |
YEAR-ON-YEAR GROWTH
|
Year
on Year Growth |
31.03.2012 |
31.03.2013 |
31.03.2014 |
|
|
Rs.
In Millions |
Rs.
In Millions |
Rs.
In Millions |
|
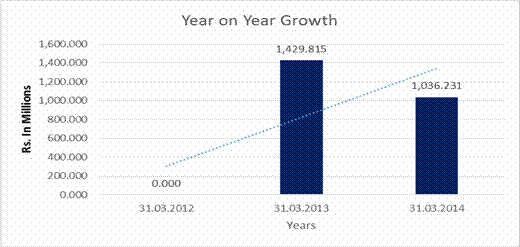
Sales |
0.000 |
1,429.815 |
1,036.231 |
|
|
|
|
(27.527) |
NET PROFIT MARGIN
|
Net
Profit Margin |
31.03.2012 |
31.03.2013 |
31.03.2014 |
|
|
Rs.
In Millions |
Rs.
In Millions |
Rs.
In Millions |
|
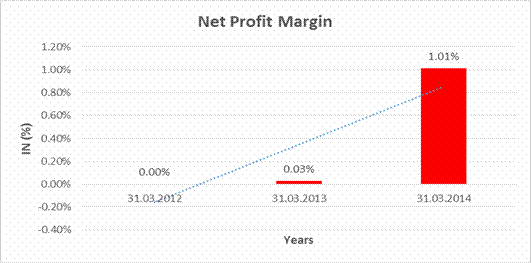
Sales
|
0.000 |
1,429.815 |
1,036.231 |
|
Profit |
(1.031) |
0.415 |
10.500 |
|
|
|
0.03% |
1.01% |
LOCAL AGENCY FURTHER INFORMATION
|
Sr. No. |
Check List by Info Agents |
Available in
Report (Yes / No) |
|
1] |
Year of Establishment |
Yes |
|
2] |
Locality of the firm |
Yes |
|
3] |
Constitutions of the firm |
Yes |
|
4] |
Premises details |
No |
|
5] |
Type of Business |
Yes |
|
6] |
Line of Business |
Yes |
|
7] |
Promoter's background |
Yes |
|
8] |
No. of employees |
No |
|
9] |
Name of person contacted |
No |
|
10] |
Designation of contact
person |
No |
|
11] |
Turnover of firm for last
three years |
Yes |
|
12] |
Profitability for last
three years |
Yes |
|
13] |
Reasons for variation
<> 20% |
----- |
|
14] |
Estimation for coming
financial year |
No |
|
15] |
Capital in the business |
Yes |
|
16] |
Details of sister
concerns |
No |
|
17] |
Major suppliers |
No |
|
18] |
Major customers |
No |
|
19] |
Payments terms |
No |
|
20] |
Export / Import details
(if applicable) |
No |
|
21] |
Market information |
----- |
|
22] |
Litigations that the firm
/ promoter involved in |
----- |
|
23] |
Banking Details |
Yes |
|
24] |
Banking facility details |
No |
|
25] |
Conduct of the banking
account |
----- |
|
26] |
Buyer visit details |
----- |
|
27] |
Financials, if provided |
Yes |
|
28] |
Incorporation details, if
applicable |
Yes |
|
29] |
Last accounts filed at
ROC |
Yes |
|
30] |
Major Shareholders, if
available |
No |
|
31] |
Date of Birth of
Proprietor/Partner/Director, if available |
Yes |
|
32] |
PAN of
Proprietor/Partner/Director, if available |
No |
|
33] |
Voter ID No of Proprietor/Partner/Director,
if available |
No |
|
34] |
External Agency Rating,
if available |
No |
INDEX OF CHARGES: NO
CHARGES EXIST FOR COMPANY
UNSECURED LOANS
|
PARTICULAR |
31.03.2013 (Rs.
In Millions) |
|
SHORT TERM
BORROWINGS |
|
|
From Director |
0.000 |
|
Others |
32.305 |
|
Total |
32.305 |
CORPORATE
INFORMATION
Subject is a public company domiciled in India and incorporated under the provision of the Company Act, 1956. The Company is engaged in trading of Computer Hardware and Software.
STATEMENT OF UNAUDITED RESULTS FOR THE QUARTER ENDED 30TH
JUNE 2014
(Rs. In Millions)
|
Particulars |
3 months ended 30.06.2014 (Unaudited) |
|
1.
Income from operations |
|
|
a) Net sales/ Income from operation (net of excise duty) |
163.886 |
|
b) Other operating income |
-- |
|
Total
income from Operations(net) |
163.886 |
|
2.Expenditure |
|
|
a) Cost of material consumed |
-- |
|
b) Purchases of stock in trade |
163.524 |
|
c) Changes in inventories of finished goods,
work-in-progress and stock-in-trade |
-- |
|
d) Employees benefit expenses |
0.063 |
|
e) Depreciation and amortization expenses |
0.004 |
|
f) Other expenditure |
0.476 |
|
Total expenses |
164.067 |
|
3. Profit from operations before other income and
financial costs |
(0.181) |
|
4. Other income |
2.725 |
|
5. Profit from ordinary activities before finance costs |
2.544 |
|
6. Finance costs |
-- |
|
7. Net profit/(loss) from ordinary activities after
finance costs but before exceptional items |
2.544 |
|
8. Exceptional item |
-- |
|
9. Profit from ordinary activities before tax
Expense: |
2.544 |
|
10.Tax expenses |
-- |
|
11.Net
Profit / (Loss) from ordinary activities after tax (9-10) |
2.544 |
|
12.Extraordinary Items (net of tax expense) |
-- |
|
13.Net Profit / (Loss) for the period (11 -12) |
2.544 |
|
14.Paid-up equity share capital (Nominal value Rs.10/- per share) |
537.600 |
|
15. Reserve excluding Revaluation
Reserves as per balance sheet of previous accounting year |
-- |
|
16.i) Earnings per share (before extraordinary
items) of Rs.10/- each) (not annualised): |
|
|
(a) Basic and diluted |
0.05 |
|
A. Particulars of shareholding |
|
|
1. Public Shareholding |
|
|
- Number of shares |
52714775 |
|
- Percentage of shareholding |
98.06 |
|
2. Promoters and Promoters group Shareholding- |
|
|
a) Pledged /Encumbered |
|
|
Number of shares |
-- |
|
Percentage of shares (as a % of total shareholding of the
promoter and promoter group) |
-- |
|
Percentage of shares (as a % of total share capital of the
company) |
-- |
|
|
|
|
b) Non Encumbered |
|
|
Number of shares |
1045225 |
|
Percentage of shares (as a % of total shareholding of the
promoter and promoter group) |
100.00 |
|
Percentage of shares (as a % of total share capital of the
company) |
1.94 |
CMT REPORT (Corruption, Money Laundering & Terrorism]
The Public Notice information has been collected from various sources
including but not limited to: The Courts,
1] INFORMATION ON
DESIGNATED PARTY
No exist designating subject or any of its beneficial owners,
controlling shareholders or senior officers as terrorist or terrorist
organization or whom notice had been received that all financial transactions
involving their assets have been blocked or convicted, found guilty or against
whom a judgement or order had been entered in a proceedings for violating
money-laundering, anti-corruption or bribery or international economic or
anti-terrorism sanction laws or whose assets were seized, blocked, frozen or
ordered forfeited for violation of money laundering or international
anti-terrorism laws.
2] Court Declaration :
No records exist to suggest that subject is
or was the subject of any formal or informal allegations, prosecutions or other
official proceeding for making any prohibited payments or other improper
payments to government officials for engaging in prohibited transactions or
with designated parties.
3] Asset Declaration :
No records exist to suggest that the property or assets of the subject
are derived from criminal conduct or a prohibited transaction.
4] Record on Financial
Crime :
Charges or conviction
registered against subject: None
5] Records on Violation of
Anti-Corruption Laws :
Charges or investigation
registered against subject: None
6] Records on Int’l
Anti-Money Laundering Laws/Standards :
Charges or
investigation registered against subject: None
7] Criminal Records
No
available information exist that suggest that subject or any of its principals
have been formally charged or convicted by a competent governmental authority
for any financial crime or under any formal investigation by a competent
government authority for any violation of anti-corruption laws or international
anti-money laundering laws or standard.
8] Affiliation with
Government :
No record
exists to suggest that any director or indirect owners, controlling
shareholders, director, officer or employee of the company is a government
official or a family member or close business associate of a Government
official.
9] Compensation Package :
Our market
survey revealed that the amount of compensation sought by the subject is fair
and reasonable and comparable to compensation paid to others for similar
services.
10] Press Report :
No press reports / filings exists on
the subject.
CORPORATE GOVERNANCE
MIRA INFORM as part of its Due Diligence do provide comments on
Corporate Governance to identify management and governance. These factors often
have been predictive and in some cases have created vulnerabilities to credit
deterioration.
Our Governance Assessment focuses principally on the interactions
between a company’s management, its Board of Directors, Shareholders and other
financial stakeholders.
CONTRAVENTION
Subject is not known to have contravened any existing local laws,
regulations or policies that prohibit, restrict or otherwise affect the terms
and conditions that could be included in the agreement with the subject.
FOREIGN EXCHANGE RATES
|
Currency |
Unit
|
Indian Rupees |
|
US Dollar |
1 |
Rs.61.06 |
|
|
1 |
Rs.101.84 |
|
Euro |
1 |
Rs.81.56 |
INFORMATION DETAILS
|
Information
Gathered by : |
HTL |
|
|
|
|
Analysis Done by
: |
RAS |
|
|
|
|
Report Prepared
by : |
NKT |
SCORE & RATING EXPLANATIONS
|
SCORE FACTORS |
RANGE |
POINTS |
|
HISTORY |
1~10 |
4 |
|
PAID-UP CAPITAL |
1~10 |
4 |
|
OPERATING SCALE |
1~10 |
3 |
|
FINANCIAL CONDITION |
|
|
|
--BUSINESS SCALE |
1~10 |
3 |
|
--PROFITABILIRY |
1~10 |
2 |
|
--LIQUIDITY |
1~10 |
3 |
|
--LEVERAGE |
1~10 |
3 |
|
--RESERVES |
1~10 |
4 |
|
--CREDIT LINES |
1~10 |
4 |
|
--MARGINS |
-5~5 |
-- |
|
DEMERIT POINTS |
|
|
|
--BANK CHARGES |
YES/NO |
YES |
|
--LITIGATION |
YES/NO |
NO |
|
--OTHER ADVERSE INFORMATION |
YES/NO |
NO |
|
MERIT POINTS |
|
|
|
--SOLE DISTRIBUTORSHIP |
YES/NO |
NO |
|
--EXPORT ACTIVITIES |
YES/NO |
NO |
|
--AFFILIATION |
YES/NO |
NO |
|
--LISTED |
YES/NO |
YES |
|
--OTHER MERIT FACTORS |
YES/NO |
YES |
|
DEFAULTER |
|
|
|
--RBI |
YES/NO |
NO |
|
--EPF |
YES/NO |
NO |
|
|
|
|
|
TOTAL |
|
30 |
This score serves as a reference to assess SC’s credit risk
and to set the amount of credit to be extended. It is calculated from a composite
of weighted scores obtained from each of the major sections of this report. The
assessed factors and their relative weights (as indicated through %) are as
follows:
Financial
condition (40%) Ownership
background (20%) Payment
record (10%)
Credit history
(10%) Market trend
(10%) Operational
size (10%)
RATING EXPLANATIONS
|
RATING |
STATUS |
PROPOSED CREDIT LINE |
|
|
>86 |
Aaa |
Possesses an extremely sound financial base with the strongest capability
for timely payment of interest and principal sums |
Unlimited |
|
71-85 |
Aa |
Possesses adequate working capital. No caution needed for credit
transaction. It has above average (strong) capability for payment of interest
and principal sums |
Large |
|
56-70 |
A |
Financial & operational base are regarded healthy. General
unfavourable factors will not cause fatal effect. Satisfactory capability for
payment of interest and principal sums |
Fairly Large |
|
41-55 |
Ba |
Overall operation is considered normal. Capable to meet normal
commitments. |
Satisfactory |
|
26-40 |
B |
Capability to
overcome financial difficulties seems comparatively below average. |
Small |
|
11-25 |
Ca |
Adverse factors are apparent. Repayment of interest and principal sums
in default or expected to be in default upon maturity |
Limited with
full security |
|
<10 |
C |
Absolute credit risk exists. Caution needed to be exercised |
Credit not
recommended |
|
-- |
NB |
New Business |
-- |
This report is issued at your request without any
risk and responsibility on the part of MIRA INFORM PRIVATE LIMITED (MIPL)
or its officials.