MIRA
INFORM REPORT
|
Report Date : |
20.08.2014 |
IDENTIFICATION DETAILS
|
Name : |
PTT AROMATICS AND REFINING PUBLIC COMPANY LIMITED |
|
|
|
|
Registered Office : |
14th
Floor, Energy Complex
Building A, |
|
|
|
|
Country : |
|
|
|
|
|
Financials (as on) : |
31.12.2010 |
|
|
|
|
Date of Incorporation : |
27.12.2007 |
|
|
|
|
Com. Reg. No.: |
0107550000254 |
|
|
|
|
Legal Form : |
Public Limited Company |
|
|
|
|
Line of Business : |
Subject operates a petroleum refinery and aromatic. |
|
|
|
|
No of Employees : |
Not Available |
RATING & COMMENTS
|
MIRA’s Rating : |
C |
|
RATING |
STATUS |
PROPOSED CREDIT LINE |
|
|
<10 |
C |
Absolute credit risk exists. Caution needed to be exercised |
Credit not
recommended |
|
Status : |
Merged Company |
|
Payment Behaviour : |
-- |
|
Litigation : |
-- |
NOTES :
Any query related to this report can be made
on e-mail : infodept@mirainform.com
while quoting report number, name and date.
ECGC Country Risk Classification List – June 01, 2014
|
Country Name |
Previous Rating (31.03.2014) |
Current Rating (01.06.2014) |
|
Thailand |
B1 |
B1 |
|
Risk Category |
ECGC
Classification |
|
Insignificant |
A1 |
|
Low Risk |
A2 |
|
Moderate Low Risk |
B1 |
|
Moderate Risk |
B2 |
|
Moderate High Risk |
C1 |
|
High Risk |
C2 |
|
Very High Risk |
D |
THAILAND - ECONOMIC OVERVIEW
With a well-developed
infrastructure, a free-enterprise economy, generally pro-investment policies,
and strong export industries, Thailand achieved steady growth due largely to
industrial and agriculture exports - mostly electronics, agricultural
commodities, automobiles and parts, and processed foods. Unemployment, at less
than 1% of the labor force, stands as one of the lowest levels in the world,
which puts upward pressure on wages in some industries. Thailand also attracts nearly
2.5 million migrant workers from neighboring countries. The Thai government in
2013 implemented a nation-wide 300 baht ($10) per day minimum wage policy and
deployed new tax reforms designed to lower rates on middle-income earners. The
Thai economy has weathered internal and external economic shocks in recent
years. The global economic recession severely cut Thailand's exports, with most
sectors experiencing double-digit drops. In late 2011 Thailand's recovery was
interrupted by historic flooding in the industrial areas in Bangkok and its
five surrounding provinces, crippling the manufacturing sector. The government
approved flood mitigation projects worth $11.7 billion, which were started in
2012, to prevent similar economic damage, and an additional $75 billion for
infrastructure over the following seven years. This was expected to lead to an
economic upsurge but growth has remained slow, in part due to ongoing political
unrest and resulting uncertainties. Spending on infrastructure will require re-approval
once a new government is seated.
|
Source
: CIA |
Company name
PTT AROMATICS AND REFINING PUBLIC COMPANY LIMITED
SUMMARY
BUSINESS ADDRESS : -
TELEPHONE : -
FAX : -
REGISTRATION ADDRESS : 14th
FLOOR, ENERGY COMPLEX
BUILDING A,
555/1 VIBHAVADEE
RANGSIT ROAD, JATUJAK,
BANGKOK 10900,
THAILAND
ESTABLISHED : 2007
REGISTRATION NO. : 0107550000254
CAPITAL REGISTERED : BHT. 29,938,149,690
CAPITAL PAID-UP : BHT.
29,869,135,380
FISCAL YEAR CLOSING
DATE : DECEMBER 31
LEGAL STATUS : PUBLIC LIMITED
COMPANY
EXECUTIVE : -
NO. OF STAFF : -
LINES OF BUSINESS : AROMATICS REFINERY
|
|
|
CORPORATE PROFILE |
OPERATING TREND : -
PRESENT SITUATION : MERGED COMPANY
REPUTATION : -
MANAGEMENT STANDARD : -
HISTORY
The subject was
established on December
27, 2007 as a
public limited company
under the name
style PTT AROMATICS
AND REFINING PUBLIC
COMPANY LIMITED. It was
formed under the
amalgamate business between The Aromatics [Thailand] Public Company Limited and Rayong
Refinery Public Company
Limited to operate
a petroleum refinery
and aromatic. Subject
was listed on
the Stock Exchange
of Thailand [SET] under
the symbolic “PTTAR”. It was also a
subsidiary of PTT Public Company
Limited.
Since October 19, 2011,
the subject
has been merged
with PTT Chemical
Public Company Limited,
then registered and
operated under the
new company, namely
PTT GLOBAL CHEMICAL
PUBLIC COMPANY LIMITED, and
was listed on
the Stock Exchange
of Thailand, under
the symbolic “PTTGC”.
The subject’s registered
address is 14th Flr., Energy
Complex, Building A, 555/1
Vibhavadee Rangsit Rd.,
Jatujak, Bangkok 10900.
THE BOARD
OF DIRECTORS :
[Before merger, as
of October 18,
2010]
|
Name |
|
Nationality |
Age |
|
|
|
|
|
|
Mr. Lt. Gen. Yuwanat Suriyakul
Na Ayudhya |
|
Thai |
- |
|
Mr. Ampon Kittiampon |
|
Thai |
55 |
|
Mr. Taweesak Na Takuathung |
|
Thai |
59 |
|
Mr. Chokchai Poolsavasdi |
|
Thai |
68 |
|
Pol. Gen. Sereepisuth
Temeeyaves |
|
Thai |
62 |
|
Mr. Nattachart Jaruchinda |
|
Thai |
- |
|
Mr. Twarath Sutabutr |
|
Thai |
- |
|
Mr. Nathi Premrasmi |
|
Thai |
62 |
|
Mr. Sukrit Surabotsopon |
|
Thai |
- |
|
Mr. Prajya Phinyawat |
[-] |
Thai |
59 |
|
Mr. Somchai Poolsavasdi |
|
Thai |
54 |
|
Mr. Permsak Shevawattananon |
[-] |
Thai |
60 |
|
Mr. Bowon Vongsinudom |
[x] |
Thai |
56 |
AUTHORIZED PERSON
Only the mentioned
director [x] can
sign or both
of the mentioned
directors [-] can
jointly sign on
behalf of the
subject with company’s
affixed.
NOTE
At present, PTT
Aromatics and Refining
Public Company Limited
is inactive. In
effect to the business
merger, the business
should be done
under the new
contacted company called
PTT GLOBAL CHEMICAL
PUBLIC COMPANY LIMITED.
Referring to your
given address “8,
I-8 Road, Map
Ta Phut Industrial Estate, Muang,
Rayong 21150”, it
is now become the
refinery plant of PTT
GLOBAL CHEMICAL PUBLIC
COMPANY LIMITED.
COMMENT
Affected by the wave
of economic crisis
during 2008-2009, the
company rapidly adopted immediate actions, including proactive sales and marketing
strategies, energy saving
measures, the improvement in the
operating system and
cash flow management
to ensure sustainable growth of the
company. This had ended
the fiscal year 2010 with an outstanding
increased of sales
revenue.
The industry this
year is expected
to grow further than
the previous year.
FINANCIAL INFORMATION
[before merger]
The capital was
originally registered at
Bht. 29,938,149,690 divided
into 2,993,814,969 shares
of Bht. 10
each, with the
capital paid-up at
Bht. 29,869,135,380.
MAIN SHAREHOLDERS :
[as at March
8, 2010] at Bht.
29,637,261,860 of capitalization.
|
NAME |
HOLDING |
% |
|
|
|
|
|
PTT Public Co.,
Ltd. |
1,441,987,368 |
48.64 |
|
Chase Nominees Limited
42 |
66,626,728 |
2.25 |
|
Thai NVDR Co.,
Ltd. |
65,404,849 |
2.21 |
|
State Street Bank
And Trust Company |
59,842,225 |
2.02 |
|
HSBC [Singapore] Nominees
Pte. Ltd. |
55,046,649 |
1.86 |
|
Thai Panich Open
Fund |
20,935,300 |
0.71 |
|
GPF EQ-TH Fund |
14,876,858 |
0.50 |
|
Others |
1,239,006,209 |
41.81 |
Total Shareholders :
57,812 [including the above
shareholders]
NAME OF AUDITOR
& CERTIFIED PUBLIC
ACCOUNTANT NO. :
Mr. Vinij Silamongkol
No. 3378
KMPG Phoomchai Audit
Co., Ltd.
PTT AROMATICS
AND REFINING PUBLIC
COMPANY LIMITED
BALANCE SHEET
[BAHT]
The latest financial
figures published as
at December 31,
2010, 2009 & 2008
were:
ASSETS
|
Current Assets |
2010 |
2009 |
2008 |
|
|
|
|
|
|
Cash and Cash Equivalent
|
1,379,733,016 |
1,362,220,367 |
1,011,040,346 |
|
Trade Account Receivable |
23,515,233,749 |
21,357,485,747 |
6,178,539,394 |
|
Other Receivable from Related Company |
59,332,656 |
94,748,047 |
248,481,689 |
|
Inventories |
22,448,194,152 |
19,879,601,652 |
14,689,892,261 |
|
Receivable from Oil Fuel Fund |
44,238,211 |
32,533,677 |
280,643,536 |
|
Value Added Tax Receivable |
1,147,830,129 |
3,934,286,848 |
3,157,583,458 |
|
Revenue Department Receivable |
- |
2,424,487,427 |
2,418,236,184 |
|
Other Current Assets |
321,182,210 |
444,151,556 |
821,328,583 |
|
|
|
|
|
|
Total Current Assets
|
48,915,744,123 |
49,529,515,321 |
28,806,745,451 |
|
|
|
|
|
|
Investment in Joint Venture |
- |
- |
3,125,000 |
|
Investment in Associated
Company |
3,907,160,000 |
3,797,375,000 |
3,469,400,000 |
|
Fixed Assets |
96,300,599,147 |
96,264,805,521 |
96,719,065,177 |
|
Leasehold Prepayment |
855,454,167 |
883,098,760 |
911,672,463 |
|
Intangible Assets |
786,705,976 |
740,345,907 |
717,078,829 |
|
Deferred Income Tax |
1,758,206,575 |
3,353,626,113 |
6,937,071,199 |
|
Other Assets |
321,048,286 |
485,241,697 |
319,449,745 |
|
|
|
|
|
|
Total Assets |
152,844,918,274 |
155,054,008,319 |
137,883,607,864 |
LIABILITIES AND SHAREHOLDERS’
EQUITY
|
Current Liabilities |
2010 |
2009 |
2008 |
|
|
|
|
|
|
Short-term Loans from
Financial Institution |
1,855,600,000 |
13,576,491,816 |
14,237,000,298 |
|
Trade Account Payable |
23,875,114,772 |
13,291,596,206 |
8,611,255,598 |
|
Current Portion of
Debentures |
- |
307,692,160 |
615,384,640 |
|
Current Portion of
Long-term Loans from Financial Institution |
7,160,061,000 |
2,027,752,000 |
970,824,000 |
|
Current Portion of Subordinated
Loans |
- |
2,144,328,073 |
- |
|
Other Payable |
876,413,106 |
934,654,302 |
1,200,779,807 |
|
Construction Payable |
1,264,864,923 |
838,916,620 |
825,067,757 |
|
Accrued Financial Cost |
361,112,078 |
450,142,438 |
322,660,299 |
|
Accrued Excise Tax |
386,654,696 |
156,227,296 |
49,457,730 |
|
Other Current Liabilities |
668,972,041 |
621,603,660 |
597,266,931 |
|
|
|
|
|
|
Total Current Liabilities |
36,448,792,616 |
34,349,404,571 |
27,429,697,060 |
|
Long-term Loans from Financial Institution |
22,844,477,000 |
26,349,368,000 |
35,607,660,000 |
|
Debentures |
22,294,360,321 |
25,049,365,410 |
10,824,143,854 |
|
Subordinated Loans |
6,928,043,669 |
6,703,281,720 |
8,579,463,898 |
|
Deferred Income Tax |
1,598,322,333 |
1,573,573,715 |
1,752,553,036 |
|
Other Liabilities |
120,074,844 |
266,913,415 |
709,398,370 |
|
|
|
|
|
|
Total Liabilities |
90,234,070,783 |
94,291,906,831 |
84,902,916,218 |
|
|
|
|
|
|
Shareholders' Equity |
|
|
|
|
|
|
|
|
|
Share capital - Baht
10 par value Authorized share
capital 2,993,814,969 shares |
29,938,149,690 |
29,938,149,690 |
29,938,149,690 |
|
|
|
|
|
|
Capital Paid |
29,670,721,480 |
29,637,261,860 |
29,636,285,220 |
|
Premium on Share Capital |
4,658,767,663 |
4,614,534,045 |
4,613,242,927 |
|
Retained Earning Appropriated for Legal Reserve |
2,593,505,614 |
2,319,681,419 |
1,856,633,603 |
|
Business Expansion Reserve |
6,514,000,000 |
6,514,000,000 |
6,514,000,000 |
|
Unappropriated |
19,173,852,734 |
17,676,624,164 |
10,360,529,896 |
|
|
|
|
|
|
Shareholders' Equity - Net |
62,610,847,491 |
60,762,101,488 |
52,980,691,646 |
|
|
|
|
|
|
Total Liabilities and Shareholders'
Equity |
152,844,918,274 |
155,054,008,319 |
137,883,607,864 |
STATEMENTS OF INCOME
|
Revenues |
2010 |
2009 |
2008 |
|
|
|
|
|
|
Sales & Services |
273,767,276,791 |
225,299,541,983 |
251,370,412,561 |
|
Interest Income |
660,207 |
3,598,192 |
20,046,327 |
|
Gain on Contract Exchange Rate |
- |
1,573,416,329 |
- |
|
Deficit on Share
Capital |
9,321,309 |
1,675,248,268 |
777,881,059 |
|
Gain on Exchange
Rate |
2,454,705,167 |
1,368,457,181 |
59,831,168 |
|
Other Income |
213,505,291 |
278,189,639 |
214,741,308 |
|
|
|
|
|
|
Total Revenues |
276,445,468,765 |
230,198,451,592 |
252,442,912,423 |
|
|
|
|
|
|
Costs and Expenses |
|
|
|
|
|
|
|
|
|
Cost of Sales
and Services |
264,817,667,813 |
213,099,794,927 |
263,199,335,519 |
|
Selling Expenses |
365,845,880 |
335,067,577 |
283,762,374 |
|
Administrative Expenses |
1,293,452,582 |
1,113,240,354 |
966,954,811 |
|
Directors' Remuneration |
140,104,449 |
92,561,868 |
76,434,204 |
|
|
|
|
|
|
Total Costs and Expenses |
266,617,070,724 |
214,640,664,726 |
264,526,486,908 |
|
|
|
|
|
|
Profit / [Loss] before Financial
Cost & Income Tax |
9,828,398,041 |
15,557,786,866 |
[12,083,574,485] |
|
Financial Cost |
[2,731,685,972] |
[2,892,364,756] |
[1,321,188,143] |
|
|
|
|
|
|
Profit / [Loss] before Income Tax |
7,096,712,069 |
12,665,422,110 |
[13,404,762,628] |
|
Income Tax |
[1,620,168,156] |
[3,404,465,765] |
5,116,994,570 |
|
|
|
|
|
|
Net Profit / [Loss] |
5,476,483,913 |
9,260,956,345 |
[8,287,768,058] |
PTT AROMATICS
AND REFINING PUBLIC
COMPANY LIMITED
FINANCIAL ANALYSIS
|
ITEM |
UNIT |
2010 |
2009 |
2008 |
|
|
|
|
|
|
|
LIQUIDITY RATIO |
|
|
|
|
|
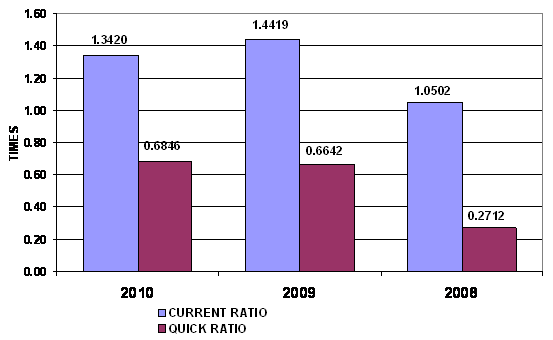
CURRENT RATIO |
TIMES |
1.34 |
1.44 |
1.05 |
|
QUICK RATIO |
TIMES |
0.68 |
0.66 |
0.27 |
|
|
|
|
|
|
|
ACTIVITY RATIO |
|
|
|
|
|
FIXED ASSETS TURNOVER |
TIMES |
2.84 |
2.34 |
2.60 |
|
TOTAL ASSETS TURNOVER |
TIMES |
1.79 |
1.45 |
1.82 |
|
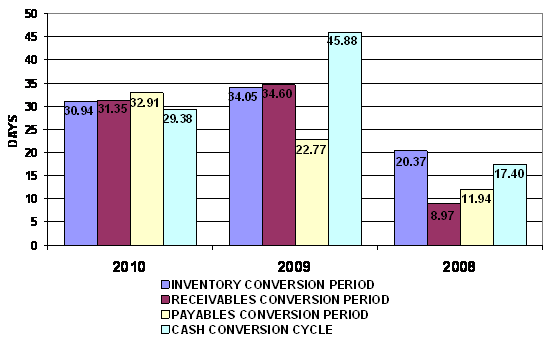
INVENTORY CONVERSION PERIOD |
DAYS |
30.94 |
34.05 |
20.37 |
|
INVENTORY TURNOVER |
TIMES |
11.80 |
10.72 |
17.92 |
|
RECEIVABLES CONVERSION PERIOD |
DAYS |
31.35 |
34.60 |
8.97 |
|
RECEIVABLES TURNOVER |
TIMES |
11.64 |
10.55 |
40.68 |
|
PAYABLES CONVERSION PERIOD |
DAYS |
32.91 |
22.77 |
11.94 |
|
CASH CONVERSION CYCLE |
DAYS |
29.38 |
45.88 |
17.40 |
|
|
|
|
|
|
|
PROFITABILITY RATIO |
|
|
|
|
|
COST OF GOODS SOLD |
% |
96.73 |
94.59 |
104.71 |
|
SELLING & ADMINISTRATION |
% |
0.61 |
0.64 |
0.50 |
|
INTEREST |
% |
1.00 |
1.28 |
0.53 |
|
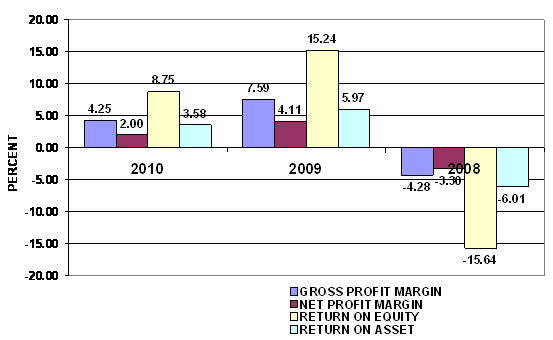
GROSS PROFIT MARGIN |
% |
4.25 |
7.59 |
(4.28) |
|
NET PROFIT MARGIN BEFORE EX. ITEM |
% |
3.59 |
6.91 |
(4.81) |
|
NET PROFIT MARGIN |
% |
2.00 |
4.11 |
(3.30) |
|
RETURN ON EQUITY |
% |
8.75 |
15.24 |
(15.64) |
|
RETURN ON ASSET |
% |
3.58 |
5.97 |
(6.01) |
|
EARNING PER SHARE |
BAHT |
1.85 |
3.12 |
(2.80) |
|
|
|
|
|
|
|
LEVERAGE RATIO |
|
|
|
|
|
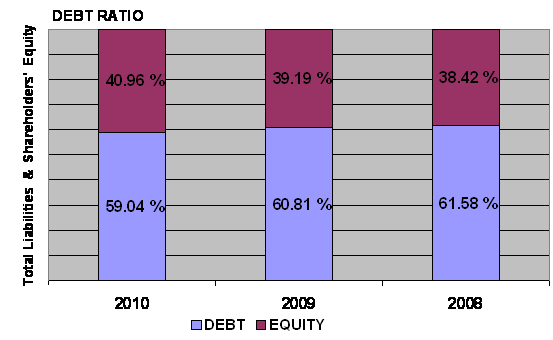
DEBT RATIO |
TIMES |
0.59 |
0.61 |
0.62 |
|
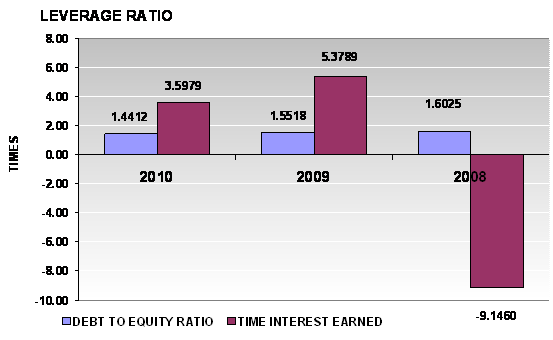
DEBT TO EQUITY RATIO |
TIMES |
1.44 |
1.55 |
1.60 |
|
TIME INTEREST EARNED |
TIMES |
3.60 |
5.38 |
(9.15) |
|
|
|
|
|
|
|
ANNUAL GROWTH |
|
|
|
|
|
SALES GROWTH |
% |
21.51 |
(10.37) |
|
|
OPERATING PROFIT |
% |
(36.83) |
(228.75) |
|
|
NET PROFIT |
% |
(40.86) |
211.74 |
|
|
FIXED ASSETS |
% |
0.04 |
(0.47) |
|
|
TOTAL ASSETS |
% |
(1.42) |
12.45 |
|
ANNUAL GROWTH: ACCEPTABLE
An annual sales growth is 21.51%. Turnover has increased from THB
225,299,541,983.00 in 2009 to THB 273,767,276,791.00 in 2010. While net profit
has decreased from THB 9,260,956,345.00 in 2009 to THB 5,476,483,913.00 in
2010. And total assets has decreased from THB 155,054,008,319.00 in 2009 to THB
152,844,918,274.00 in 2010.
PROFITABILITY: ACCEPTABLE
PROFITABILITY RATIO
|
Gross Profit Margin |
4.25 |
Impressive |
Industrial Average |
3.37 |
|
Net Profit Margin |
2.00 |
Satisfactory |
Industrial Average |
2.55 |
|
Return on Assets |
3.58 |
Deteriorated |
Industrial Average |
10.95 |
|
Return on Equity |
8.75 |
Deteriorated |
Industrial Average |
19.96 |
Gross Profit Margin used to assess a firm's financial health by revealing
the proportion of money left over from revenues after accounting for the cost
of goods sold. Gross profit margin serves as the source for paying additional
expenses and future savings. The
company’s figure is 4.25%. When
compared with the industry average, the ratio of the company was higher,
indicated that company was more profitable than the same industry.
Net Profit Margin is the indicator of the company's efficiency in that
net profit takes into consideration all expenses of the company. A low profit
margin indicates a low margin of safety, higher risk that a decline in sales
will erase profits and result in a net loss. The company's figure is 2%. When
compared with the industry average, the ratio of the company was lower.
Return on Assets measures how efficiently profits are being generated
from the assets employed in the business when compared with the ratios of firms
in a similar business. A low ratio in comparison with industry averages
indicates an inefficient use of business assets. When compared with the
industry average, it was lower, the company's figure is 3.58%.
Return on Equity indicates how profitable a company is by comparing its
net income to its average shareholders' equity, ROE measures how much the
shareholders earned for their investment in the company. When compared with the
industry average, it was lower, the company's figure is 8.75%.
Trend of the average competitors in the same industry for last 5 years
Return on Assets Uptrend
Return on Equity Uptrend
LIQUIDITY : ACCEPTABLE
LIQUIDITY RATIO
|
Current Ratio |
1.34 |
Acceptable |
Industrial Average |
2.10 |
|
Quick Ratio |
0.68 |
|
|
|
|
Cash Conversion Cycle |
29.38 |
|
|
|
The Current Ratio is to ascertain whether a company's short-term assets
are readily available to pay off its short-term liabilities. The company's
figure is 1.34 times in 2010, decrease from 1.44 times, then it is generally
considered to have good short-term financial strength. When compared with the
industry average, the ratio of the company was lower.
The Quick Ratio is a liquidity indicator that further refines the
current ratio by measuring the amount of the most liquid current assets there
are to cover current liabilities. The company's figure is 0.68 times in 2010,
increase from 0.66 times, then the company has not enough current assets that
presumably can be quickly converted to cash for pay financial obligations.
The Cash Conversion Cycle measures the number of days a company's cash
is tied up in the production and sales process of its operations and the
benefit from payment terms from its creditors. It meant the company could
survive when no cash inflow was received from sale for 30 days.
Trend of the average competitors in the same industry for last 5 years
Current Ratio Uptrend
LEVERAGE : RISKY
LEVERAGE RATIO
|
Debt Ratio |
0.59 |
Acceptable |
Industrial Average |
0.39 |
|
Debt to Equity Ratio |
1.44 |
Risky |
Industrial Average |
0.71 |
|
Times Interest Earned |
3.60 |
Deteriorated |
Industrial Average |
11.98 |
Debt to Equity Ratio a measurement of how much suppliers, lenders,
creditors and obligors have committed to the company versus what the shareholders
have committed. A lower the percentage means that the company is using less
leverage and has a stronger equity position.
Times Interest Earned measuring a company's ability to meet its debt obligations.
Ratio is 3.6 higher than 1, so the company can pay interest expenses on
outstanding debt.
Debt Ratio shows the proportion of a company's assets which are financed
through debt. The company's figure is 0.59 greater than 0.5, most of the company's
assets are financed through debt.
Trend of the average competitors in the same industry for last 5 years
Debt Ratio Downtrend
Times Interest Earned Uptrend
ACTIVITY : RISKY
ACTIVITY RATIO
|
Fixed Assets Turnover |
2.84 |
Deteriorated |
Industrial Average |
7.33 |
|
Total Assets Turnover |
1.79 |
Deteriorated |
Industrial Average |
4.29 |
|
Inventory Conversion Period |
30.94 |
|
|
|
|
Inventory Turnover |
11.80 |
Acceptable |
Industrial Average |
16.06 |
|
Receivables Conversion Period |
31.35 |
|
|
|
|
Receivables Turnover |
11.64 |
Acceptable |
Industrial Average |
17.84 |
|
Payables Conversion Period |
32.91 |
|
|
|
The company's Account Receivable Ratio is calculated as 11.64 and 10.55 in
2010 and 2009 respectively. This ratio measures the efficiency of the company
in managing its trade debtors to generate revenue. A lower ratio may indicate
over extension and collection problems. Conversely, a higher ratio may indicate
an overtly stringent policy. In this case, the company's A/R ratio in 2010
increased from 2009. This would suggest the company had good performance in the
management of its debt collections.
Inventory Turnover in Days Ratio indicates the liquidity of inventory. It
estimates the number of days that it will take to sell the current inventory.
Inventory is particularly sensitive to change in business activities. The
inventory turnover in days has decreased from 34 days at the end of 2009 to 31
days at the end of 2010. This represents a positive trend. And Inventory
turnover has increased from 10.72 times in year 2009 to 11.8 times in year
2010.
The company's Total Asset Turnover is calculated as 1.79 times and 1.45
times in 2010 and 2009 respectively. This ratio is determined by dividing total
assets into total sales turnover. The ratio measures the activity of the assets
and the ability of the firm to generate sales through the use of the assets.
Trend of the average competitors in the same industry for last 5 years
Fixed Assets Turnover Uptrend
Total Assets Turnover Uptrend
Inventory Turnover Uptrend
Receivables Turnover Uptrend
FOREIGN EXCHANGE RATES
|
Currency |
Unit
|
Indian Rupees |
|
US Dollar |
1 |
Rs.60.73 |
|
|
1 |
Rs.101.47 |
|
Euro |
1 |
Rs.81.04 |
INFORMATION DETAILS
|
Analysis Done by
: |
KAR |
|
|
|
|
Report Prepared
by : |
TPT |
RATING EXPLANATIONS
|
RATING |
STATUS |
PROPOSED CREDIT LINE |
|
|
>86 |
Aaa |
Possesses an extremely sound financial base with the strongest
capability for timely payment of interest and principal sums |
Unlimited |
|
71-85 |
Aa |
Possesses adequate working capital. No caution needed for credit
transaction. It has above average (strong) capability for payment of interest
and principal sums |
Large |
|
56-70 |
A |
Financial & operational base are regarded healthy. General
unfavourable factors will not cause fatal effect. Satisfactory capability for
payment of interest and principal sums |
Fairly Large |
|
41-55 |
Ba |
Overall operation is considered normal. Capable to meet normal
commitments. |
Satisfactory |
|
26-40 |
B |
Capability to overcome financial difficulties seems comparatively below
average. |
Small |
|
11-25 |
Ca |
Adverse factors are apparent. Repayment of interest and principal sums
in default or expected to be in default upon maturity |
Limited with
full security |
|
<10 |
C |
Absolute credit risk
exists. Caution needed to be exercised |
Credit not recommended |
|
-- |
NB |
New Business |
-- |
This score serves as a reference to assess SC’s credit risk and
to set the amount of credit to be extended. It is calculated from a composite
of weighted scores obtained from each of the major sections of this report. The
assessed factors and their relative weights (as indicated through %) are as
follows:
Financial
condition (40%) Ownership
background (20%) Payment
record (10%)
Credit history
(10%) Market trend
(10%) Operational
size (10%)
This report is issued at your request without any
risk and responsibility on the part of MIRA INFORM PRIVATE LIMITED (MIPL)
or its officials.