MIRA
INFORM REPORT
|
Report Date : |
20.08.2014 |
IDENTIFICATION DETAILS
|
Name : |
RELIANCE INDUSTRIAL INFRASTRUCTURE LIMITED |
|
|
|
|
Registered
Office : |
NKM International House, 5th Floor, 178
Backbay Reclamation, Behind LIC
Yogakshema Building, Babubhai Chinai Road, Mumbai – 400020, Maharashtra |
|
|
|
|
Country : |
|
|
|
|
|
Financials (as
on) : |
31.03.2014 |
|
|
|
|
Date of
Incorporation : |
29.09.1988 |
|
|
|
|
Com. Reg. No.: |
11-049019 |
|
|
|
|
Capital
Investment / Paid-up Capital : |
Rs.151.000 Millions |
|
|
|
|
CIN No.: [Company Identification
No.] |
L60300MH1988PLC049019 |
|
|
|
|
TAN No.: [Tax Deduction &
Collection Account No.] |
MUMR15437C |
|
|
|
|
PAN No.: [Permanent Account No.] |
AAACR7637P |
|
|
|
|
Legal Form : |
A Public Limited
Liability Company. The Company's Shares are Listed on the Stock Exchanges |
|
|
|
|
Line of Business
: |
The company is mainly engaged in Infrastructure activity. |
|
|
|
|
No. of Employees
: |
108 (Approximately) |
RATING & COMMENTS
|
MIRA’s Rating : |
Aa (75) |
|
RATING |
STATUS |
PROPOSED CREDIT LINE |
|
|
71-85 |
Aa |
Possesses adequate working capital. No caution needed for credit transaction.
It has above average (strong) capability for payment of interest and
principal sums |
Large |
|
Status : |
Excellent |
|
|
|
|
Payment Behaviour : |
Regular |
|
|
|
|
Litigation : |
Clear |
|
|
|
|
Comments : |
Subject is a part of Reliance Group Company It is an established company having excellent track record. Financial position of the company is sound. Fundamentals of the company are strong and healthy. Performance capability of the company is high. Trade relations are reported as fair. Business is active. Payments
terms are reported to be regular and as per commitment. In view of experienced promoters, the company can be considered good
for business dealings at usual trade terms and conditions. |
NOTES :
Any query related to this report can be made
on e-mail : infodept@mirainform.com
while quoting report number, name and date.
INDIAN ECONOMIC OVERVIEW
N E W S
As per the latest IMF study, the total weigh of emerging markets in the
GDP of the world on a purchasing power parity basis has seen a sizeable shift.
It highlights how as against 51 % in 2005, the emerging economies now account
for close to 56 % of the global purchasing power GDP as per the latest survey.
And with the emerging economies growing at a faster rate than their developed
counterparts, there are every possibility that the their share goes up further
in the coming years. China may surpass the US over the next few years.
Politics and economics are very intricately connected. They tend to
influence each other in ways that could be very complex and far-reaching. The
prospects of the India’s economy have been seriously compromised due to
political corruption. High inflation, poor standard of living are to a great
extent a result of rampant corruption in the country. China on the other hand,
seems to be facing diametrically opposite challenge. American hedge fund
manager Jim Chanos has been keenly following the political and economic
development in the dragon economy and has figured out something that is quite
worrying. He is of the view that the Chinese economy could be heading toward
trouble on account of new Chinese President Xi Jingping’s very aggressive
anti-corruption drive. Chanos believes tat many things such as apartment sales,
luxury products, etc. were largely bought with dirty money. And it is now
beginning to impact consumption. This may indeed be bad news for an economy
that is struggling to transition from an investment-driven export-oriented
economy to a domestic consumption-driven economy.
A study published by Firstpost has revealed that asset classes like real
estate and equities were the biggest beneficiaries of the liberalization policies.
A firm called Ciane Analytics studied returns from assets including
equities, gold, fixed deposits, G-Secs and real estate since 1991. Real estate
outperformed every other asset classes during the 23-year period with an
annualized return of 20 % ! Equities came in second with annualized return of
15.5 % ! However, while these returns may seem mouthwatering, the fact is that
the return from equities adjusted for inflation came down to just 7.1 %.
Some brief news are as under
. R-Power to buy Jaypee’s hydro assets
. Investors await justice in NSEL case
. India seeks MFN status from Pakistan ahead of meeting
. Ukrain’s clashes with rebels hinder MH17 crash investigation
. India exploring merger of state-owned hydro PSUs
..Higher costs weigh down profit growth to slowest in 9 quarters
..Wal-Mart to expand wholesale business in India
. GMR group moves to strengthen balance sheet
. Central Bank to sell 4 % stake to Life Insurance Corporation
. Tata Chemicals plans to raise up to Rs 10000 mn.
RBI DEFAULTERS’ LIST STATUS
Subject’s name is not enlisted as a defaulter
in the publicly available RBI Defaulters’ list.
EPF (Employee Provident Fund) DEFAULTERS’ LIST STATUS
Subject’s name is not enlisted as a defaulter in
the publicly available EPF (Employee Provident Fund) Defaulters’ list as of
31-03-2014.
INFORMATION DECLINED
MANAGEMENT NON-COOPERATIVE (91-22-44775000)
LOCATIONS
|
Registered Office : |
NKM International House, 5th Floor, 178 Backbay Reclamation, Behind LIC Yogakshema Building, Babubhai Chinai Road, Mumbai – 400020, Maharashtra, India |
|
Tel. No.: |
91-22-44779053 |
|
Fax No.: |
91-22-44779052 |
|
E-Mail : |
|
|
Website : |
DIRECTORS
As on 31.03.2014
|
Name : |
Mr. Mahesh Kalidas Kamdas |
|
Designation : |
Chairman |
|
Address : |
2201 , Chaitanya Towers , 'C' Wing , App Asaheb Marathe Marg , Prabhadevi , Mumbai – 400025, Maharashtra, India |
|
Date of Birth/Age : |
27.09.1951 |
|
Date of Appointment : |
23.07.1990 |
|
Din No.: |
00013915 |
|
|
|
|
Name : |
Mr. Chandra Raj Mehta |
|
Designation : |
Director |
|
Address : |
A/602, Shilp Near Deepak Cinema, P B Marg, Worli, Mumbai – 400013,
Maharashtra, India |
|
Date of Birth/Age : |
16.03.1939 |
|
Date of Appointment : |
29.08.2006 |
|
Din No.: |
00002011 |
|
|
|
|
Name : |
Mr. Sandeep Hemendra Junnarkar |
|
Designation : |
Director |
|
Address : |
Flat No.1702, Wallace Apartment, Naushir Bharucha Marg, Mumbai –
400007, Maharashtra, India |
|
Date of Birth/Age : |
02.07.1951 |
|
Date of Appointment : |
27.04.1991 |
|
Din No.: |
00003534 |
|
|
|
|
Name : |
Mr. Subhashchandra Anantram Malhotra |
|
Designation : |
Director |
|
Address : |
602, Tulsi Shyam Chs Limited, Highway Junction Road, Thane (West),
Mumbai – 400604, Maharashtra, India |
|
Date of Birth/Age : |
13.11.1940 |
|
Date of Appointment : |
16.12.1989 |
|
Din No.: |
00013967 |
|
|
|
|
Name : |
Mr. Dilipkumar Vittaldas Dherai |
|
Designation : |
Executive Director |
|
Address : |
Flat No.504, 5th Floor, Sayadhari Neelkanth Valley, Ghatkoper
(East), Mumbai – 400077, Maharashtra, India |
|
Date of Birth/Age : |
09.04.1956 |
|
Date of Appointment : |
01.07.1994 |
|
Din No.: |
00011789 |
KEY EXECUTIVES
|
Name : |
Mr. Shankar Natarajan |
|
Designation : |
Company Secretary and Compliance Officer |
|
|
|
|
Name : |
Mr. Tapas Mitra |
|
Designation : |
Chief Financial Officer |
|
|
|
|
Audit Committee |
·
Mr. Chandra Raj Mehta, Chairman ·
Mr. S C Malhotra ·
Mr. Sandeep Hemendra Junnarkar |
|
|
|
|
Stakeholders Relationship Committee : |
·
Mr. Chandra Raj Mehta, Chairman ·
Mr. Sandeep Hemendra Junnarkar ·
Mr. Mahesh K Kamdar |
|
|
|
|
Nomination and Remuneration Committee : |
·
Mr. Chandra Raj Mehta, Chairman ·
Mr. Sandeep Hemendra Junnarkar ·
Mr. Mahesh K Kamdar ·
Mr. S C Malhotra |
|
|
|
|
Corporate Social Reasonability Committee : |
·
Mr. Mr. Mahesh K Kamdar, Chairman ·
Mr. Sandeep Hemendra Junnarkar ·
Mr. Chandra Raj Mehta ·
Mr. S C Malhotra |
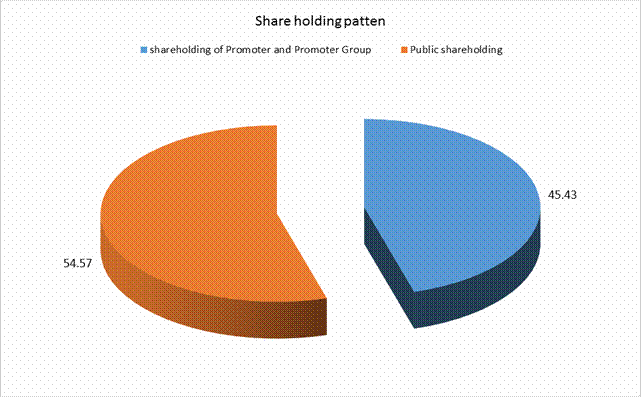
MAJOR SHAREHOLDERS / SHAREHOLDING PATTERN
As on 30.06.2014
|
Category
of Shareholders |
No. of Shares |
Percentage of
Holding |
|
(A) Shareholding of Promoter and Promoter Group |
|
|
|
|
|
|
|
|
6860064 |
45.43 |
|
|
6860064 |
45.43 |
|
|
|
|
|
Total shareholding of Promoter and Promoter Group (A) |
6860064 |
45.43 |
|
(B) Public Shareholding |
|
|
|
|
|
|
|
|
940 |
0.01 |
|
|
42736 |
0.28 |
|
|
78534 |
0.52 |
|
|
122210 |
0.81 |
|
|
|
|
|
|
1507495 |
9.98 |
|
|
|
|
|
|
6049774 |
40.06 |
|
|
319030 |
2.11 |
|
|
241427 |
1.60 |
|
|
138661 |
0.92 |
|
|
101766 |
0.67 |
|
|
1000 |
0.01 |
|
|
8117726 |
53.76 |
|
Total Public shareholding (B) |
8239936 |
54.57 |
|
Total (A)+(B) |
15100000 |
100.00 |
|
(C) Shares held by Custodians and against which Depository Receipts
have been issued |
0 |
0.00 |
|
|
0 |
0.00 |
|
|
0 |
0.00 |
|
|
0 |
0.00 |
|
Total (A)+(B)+(C) |
15100000 |
0.00 |
Shareholding of securities (including shares, warrants, convertible
securities) of persons belonging to the category Promoter and Promoter Group
|
Sl.No. |
Name of the
Shareholder |
No. of Shares held |
As a % of grand
total (A)+(B)+(C) |
Total shares (including
underlying shares assuming full conversion of warrants and convertible
securities) as a % of diluted share capital |
|
|
Reliance Industries Limited |
68,60,064 |
45.43 |
45.43 |
|
|
Total |
68,60,064 |
45.43 |
45.43 |
(*) The term encumbrance has the same meaning as assigned to it in regulation 28(3) of the SAST Regulations, 2011.
Shareholding of securities (including shares, warrants,
convertible securities) of persons belonging to the category Public and holding
more than 1% of the total number of shares
|
Sl. No. |
Name of the
Shareholder |
No. of Shares held |
Shares as % of
Total No. of Shares |
Total shares
(including underlying shares assuming full conversion of warrants and convertible
securities) as a % of diluted share capital |
|
|
1 |
Reliance Capital Limited |
160100 |
1.06 |
1.06 |
|
|
|
Total |
160100 |
1.06 |
1.06 |
BUSINESS DETAILS
|
Line of Business : |
The company is mainly engaged in Infrastructure activity. |
GENERAL INFORMATION
|
No. of Employees : |
108 (Approximately) |
|
|
|
|
Bankers : |
· HDFC Bank Limited · ICICI Bank Limited ·
Syndicate Bank |
|
|
|
|
Banking
Relations : |
-- |
|
|
|
|
Auditors : |
|
|
Name : |
Chaturvedi and Shah Chartered Accountants |
|
Address : |
714-715, Tulsiani Chambers 212, Nariman Point, Mumbai – 400021,
Maharashtra, India |
|
|
|
|
Solicitors and Advocates : |
Kanga and Company |
|
|
|
|
Entity exercising significant
influence: |
Reliance Industries Limited |
CAPITAL STRUCTURE
As on 31.03.2014
Authorised Capital :
|
No. of Shares |
Type |
Value |
Amount |
|
|
|
|
|
|
200000000 |
Equity Shares |
Rs.10/- each |
Rs.2000.000 Millions |
|
|
|
|
|
Issued, Subscribed & Paid-up Capital :
|
No. of Shares |
Type |
Value |
Amount |
|
|
|
|
|
|
15100000 |
Equity Shares |
Rs.10/- each |
Rs.151.000
Millions |
|
|
|
|
|
NOTE:
The details of
Shareholder holding more than 5% shares :
|
Name of Shareholder |
No. of Shares |
31.03.2014 % held |
|
Reliance Industries Limited |
6860064 |
45.43 |
The reconciliation of
the number of shares outstanding is set out below:
|
Name of Shareholder |
31.03.2014 No. of Shares |
|
Equity Shares at the beginning of the year |
15100000 |
|
Issued during the year |
-- |
|
Equity Shares at the end of the year |
15100000 |
FINANCIAL DATA
[all figures are
in Rupees Millions]
ABRIDGED BALANCE
SHEET
|
SOURCES
OF FUNDS |
31.03.2014 |
31.03.2013 |
31.03.2012 |
|
|
|
|
|
|
I.
EQUITY AND LIABILITIES |
|
|
|
|
(1)Shareholders' Funds |
|
|
|
|
(a) Share Capital |
151.000 |
151.000 |
151.000 |
|
(b) Reserves & Surplus |
2345.521 |
2168.656 |
1994.503 |
|
(c) Money received against
share warrants |
0.000 |
0.000 |
0.000 |
|
|
|
|
|
|
(2) Share Application money
pending allotment |
0.000 |
0.000 |
0.000 |
|
Total
Shareholders’ Funds (1) + (2) |
2496.521 |
2319.656 |
2145.503 |
|
|
|
|
|
|
(3) Non-Current Liabilities |
|
|
|
|
(a) long-term borrowings |
0.000 |
0.000 |
0.000 |
|
(b) Deferred tax liabilities
(Net) |
293.130 |
261.917 |
222.805 |
|
(c) Other long term
liabilities |
0.000 |
0.000 |
0.000 |
|
(d) long-term provisions |
0.000 |
0.000 |
5.505 |
|
Total
Non-current Liabilities (3) |
293.130 |
261.917 |
228.310 |
|
|
|
|
|
|
(4) Current Liabilities |
|
|
|
|
(a) Short term borrowings |
0.000 |
0.000 |
0.000 |
|
(b) Trade payables |
161.923 |
125.503 |
142.376 |
|
(c) Other current liabilities |
103.814 |
232.081 |
397.613 |
|
(d) Short-term provisions |
73.477 |
78.377 |
68.977 |
|
Total
Current Liabilities (4) |
339.214 |
435.961 |
608.966 |
|
|
|
|
|
|
TOTAL |
3128.865 |
3017.534 |
2982.779 |
|
|
|
|
|
|
II.
ASSETS |
|
|
|
|
(1) Non-current assets |
|
|
|
|
(a) Fixed Assets |
|
|
|
|
(i) Tangible assets |
756.175 |
528.186 |
636.895 |
|
(ii) Intangible Assets |
465.623 |
423.714 |
385.892 |
|
(iii) Capital work-in-progress |
30.537 |
91.294 |
0.000 |
|
(iv) Intangible assets under
development |
0.000 |
0.000 |
0.000 |
|
(b) Non-current Investments |
871.743 |
67.737 |
67.737 |
|
(c) Deferred tax assets (net) |
0.000 |
0.000 |
0.000 |
|
(d) Long-term Loan and Advances |
258.428 |
1137.343 |
1196.127 |
|
(e) Other Non-current assets |
0.000 |
0.000 |
0.000 |
|
Total
Non-Current Assets |
2382.506 |
2248.274 |
2286.651 |
|
|
|
|
|
|
(2) Current assets |
|
|
|
|
(a) Current investments |
331.000 |
287.500 |
290.000 |
|
(b) Inventories |
10.429 |
11.261 |
7.059 |
|
(c) Trade receivables |
181.140 |
193.972 |
170.889 |
|
(d) Cash and cash equivalents |
10.311 |
26.949 |
24.284 |
|
(e) Short-term loans and
advances |
213.479 |
249.578 |
203.896 |
|
(f) Other current assets |
0.000 |
0.000 |
0.000 |
|
Total
Current Assets |
746.359 |
769.260 |
696.128 |
|
|
|
|
|
|
TOTAL |
3128.865 |
3017.534 |
2982.779 |
PROFIT & LOSS
ACCOUNT
|
|
PARTICULARS |
31.03.2014 |
31.03.2013 |
31.03.2012 |
|
|
SALES |
|
|
|
|
|
Income |
848.320 |
802.651 |
613.429 |
|
|
Other Income |
71.155 |
89.538 |
89.057 |
|
|
TOTAL
|
919.475 |
892.189 |
702.486 |
|
|
|
|
|
|
|
Less |
EXPENSES |
|
|
|
|
|
Employee Benefits Expense |
141.161 |
131.960 |
115.918 |
|
|
Other Expenses |
339.917 |
304.802 |
207.832 |
|
|
TOTAL
|
481.078 |
436.762 |
323.750 |
|
|
|
|
|
|
|
|
PROFIT
/ (LOSS) BEFORE TAX, DEPRECIATION AND AMORTISATION |
438.397 |
455.427 |
378.736 |
|
|
|
|
|
|
|
Less/
Add |
DEPRECIATION/
AMORTISATION |
102.392 |
101.511 |
63.342 |
|
|
|
|
|
|
|
|
PROFIT/
(LOSS) BEFORE TAX |
336.005 |
353.916 |
315.394 |
|
|
|
|
|
|
|
Less |
TAX |
94.607 |
110.112 |
79.274 |
|
|
|
|
|
|
|
|
PROFIT/
(LOSS) AFTER TAX |
241.398 |
243.804 |
236.120 |
|
|
|
|
|
|
|
|
PREVIOUS
YEARS’ BALANCE BROUGHT FORWARD |
106.600 |
129.100 |
154.379 |
|
|
|
|
|
|
|
|
APPROPRIATIONS |
|
|
|
|
|
Transfer to General Reserve |
100.000 |
200.000 |
200.000 |
|
|
Proposed Dividend on equity
shares |
52.800 |
56.600 |
52.850 |
|
|
Tax on Dividend |
9.000 |
9.700 |
8.574 |
|
|
|
|
|
|
|
|
Balance
Carried to the B/S |
186.200 |
106.600 |
129.075 |
|
|
|
|
|
|
|
|
IMPORTS |
|
|
|
|
|
Capital Goods |
115.905 |
54.051 |
405.299 |
|
|
TOTAL
IMPORTS |
115.905 |
54.051 |
405.299 |
|
|
|
|
|
|
|
|
Earnings
/ (Loss) Per Share (Rs.) |
15.99 |
16.15 |
15.64 |
KEY RATIOS
|
PARTICULARS |
|
31.03.2014 |
31.03.2013 |
31.03.2012 |
|
PAT / Total Income |
(%) |
26.25 |
27.33 |
33.61 |
|
|
|
|
|
|
|
Net Profit Margin (PBT/Sales) |
(%) |
39.61 |
44.09 |
51.41 |
|
|
|
|
|
|
|
Return on Total Assets (PBT/Total Assets} |
(%) |
15.09 |
12.38 |
10.82 |
|
|
|
|
|
|
|
Return on Investment (ROI) (PBT/Networth) |
|
0.13 |
0.15 |
0.15 |
|
|
|
|
|
|
|
Debt Equity Ratio (Total Debt /Networth) |
|
0.00 |
0.00 |
0.00 |
|
|
|
|
|
|
|
Current Ratio (Current Asset/Current Liability) |
|
2.20 |
1.76 |
1.14 |
FINANCIAL ANALYSIS
[all figures are
in Rupees Millions]
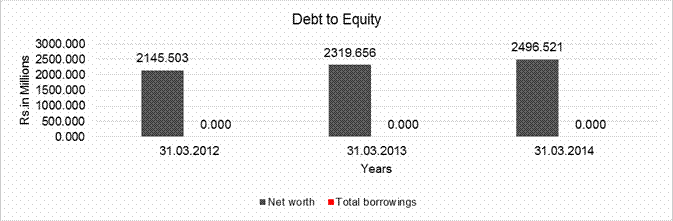
DEBT EQUITY RATIO
|
Particular |
31.03.2012 |
31.03.2013 |
31.03.2014 |
|
|
(Rs.
In Millions) |
(Rs.
In Millions) |
(Rs.
In Millions) |
|
Share Capital |
151.000 |
151.000 |
151.000 |
|
Reserves & Surplus |
1994.503 |
2168.656 |
2345.521 |
|
Net
worth |
2145.503 |
2319.656 |
2496.521 |
|
|
|
|
|
|
long-term borrowings |
0.000 |
0.000 |
0.000 |
|
Short term borrowings |
0.000 |
0.000 |
0.000 |
|
Total
borrowings |
0.000 |
0.000 |
0.000 |
|
Debt/Equity
ratio |
0.000 |
0.000 |
0.000 |
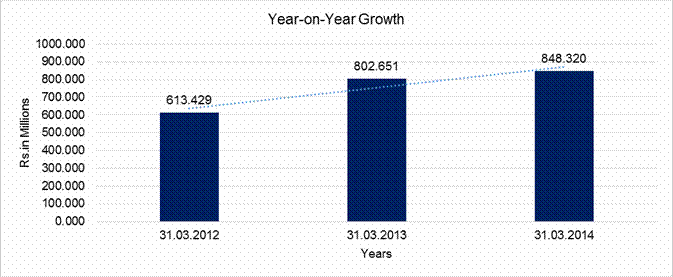
YEAR-ON-YEAR GROWTH
|
Year
on Year Growth |
31.03.2012 |
31.03.2013 |
31.03.2014 |
|
|
(Rs.
In Millions) |
(Rs.
In Millions) |
(Rs.
In Millions) |
|
Sales |
613.429 |
802.651 |
848.320 |
|
|
|
30.847 |
5.690 |
NET PROFIT MARGIN
|
Net
Profit Margin |
31.03.2012 |
31.03.2013 |
31.03.2014 |
|
|
(Rs.
In Millions) |
(Rs.
In Millions) |
(Rs.
In Millions) |
|
Sales |
613.429 |
802.651 |
848.320 |
|
Profit |
236.120 |
243.804 |
241.398 |
|
|
38.49% |
30.37% |
28.46% |
LOCAL AGENCY FURTHER INFORMATION
CURRENT MATURITIES
OF LONG-TERM DEBT DETAILS: NOT AVAILABLE
|
Sr. No. |
Check List by Info Agents |
Available in
Report (Yes / No) |
|
1] |
Year of Establishment |
Yes |
|
2] |
Locality of the firm |
Yes |
|
3] |
Constitutions of the firm |
Yes |
|
4] |
Premises details |
No |
|
5] |
Type of Business |
Yes |
|
6] |
Line of Business |
Yes |
|
7] |
Promoter's background |
Yes |
|
8] |
No. of employees |
Yes |
|
9] |
Name of person contacted |
No |
|
10] |
Designation of contact
person |
No |
|
11] |
Turnover of firm for last
three years |
Yes |
|
12] |
Profitability for last
three years |
Yes |
|
13] |
Reasons for variation
<> 20% |
-- |
|
14] |
Estimation for coming
financial year |
No |
|
15] |
Capital in the business |
Yes |
|
16] |
Details of sister
concerns |
Yes |
|
17] |
Major suppliers |
No |
|
18] |
Major customers |
No |
|
19] |
Payments terms |
No |
|
20] |
Export / Import details
(if applicable) |
No |
|
21] |
Market information |
-- |
|
22] |
Litigations that the firm
/ promoter involved in |
-- |
|
23] |
Banking Details |
Yes |
|
24] |
Banking facility details |
No |
|
25] |
Conduct of the banking
account |
-- |
|
26] |
Buyer visit details |
-- |
|
27] |
Financials, if provided |
Yes |
|
28] |
Incorporation details, if
applicable |
Yes |
|
29] |
Last accounts filed at
ROC |
Yes |
|
30] |
Major Shareholders, if
available |
Yes |
|
31] |
Date of Birth of
Proprietor/Partner/Director, if available |
Yes |
|
32] |
PAN of
Proprietor/Partner/Director, if available |
No |
|
33] |
Voter ID No of
Proprietor/Partner/Director, if available |
No |
|
34] |
External Agency Rating,
if available |
No |
INDEX OF CHARGES: NO CHARGES EXIST FOR COMPANY
MANAGEMENT’S
DISCUSSION AND ANALYSIS REPORT
FINANCIAL AND
OPERATIONAL REVIEW
The Company’s revenue from operations for the year increased by 5.7% to Rs.848.300 Millions for the financial year 2013-14, as compared to Rs.802.700 Millions in the previous year. The Company continued its focus on core business activity in the infrastructure sector. The key revenue streams for the Company include deployment of construction equipment, product transportation through pipelines and other infrastructure support services.
The Company’s net profit for the year was marginally lower at Rs.241.400 Millions as compared to Rs.243.800 Millions in the previous year.
Earnings per share was Rs.15.99 as compared to Rs.16.15 in the previous year.
OUTLOOK
The Company will continue to keep its focus in the infrastructure sector. The Company’s operations are likely to benefit from revival in the economic environment.
FIXED ASSETS
Tangible Assets
· Land
· Building
· Plant and Machinery
· Construction
· Machinery
· Equipments
· Furniture and Fixtures
· Vehicles
Intangible Assets
Software
CMT REPORT (Corruption, Money Laundering & Terrorism]
The Public Notice information has been collected from various sources
including but not limited to: The Courts,
1] INFORMATION ON
DESIGNATED PARTY
No exist designating subject or any of its beneficial owners, controlling
shareholders or senior officers as terrorist or terrorist organization or whom
notice had been received that all financial transactions involving their assets
have been blocked or convicted, found guilty or against whom a judgement or
order had been entered in a proceedings for violating money-laundering,
anti-corruption or bribery or international economic or anti-terrorism sanction
laws or whose assets were seized, blocked, frozen or ordered forfeited for
violation of money laundering or international anti-terrorism laws.
2] Court Declaration :
No exist to suggest that subject is or was
the subject of any formal or informal allegations, prosecutions or other
official proceeding for making any prohibited payments or other improper
payments to government officials for engaging in prohibited transactions or
with designated parties.
3] Asset Declaration :
No records exist to suggest that the property or assets of the subject
are derived from criminal conduct or a prohibited transaction.
4] Record on Financial
Crime :
Charges or conviction
registered against subject: None
5] Records on Violation of
Anti-Corruption Laws :
Charges or
investigation registered against subject: None
6] Records on Int’l
Anti-Money Laundering Laws/Standards :
Charges or
investigation registered against subject: None
7] Criminal Records
No
available information exist that suggest that subject or any of its principals
have been formally charged or convicted by a competent governmental authority
for any financial crime or under any formal investigation by a competent
government authority for any violation of anti-corruption laws or international
anti-money laundering laws or standard.
8] Affiliation with
Government :
No record
exists to suggest that any director or indirect owners, controlling
shareholders, director, officer or employee of the company is a government
official or a family member or close business associate of a Government
official.
9] Compensation Package :
Our market
survey revealed that the amount of compensation sought by the subject is fair
and reasonable and comparable to compensation paid to others for similar
services.
10] Press Report :
No press reports / filings exists on
the subject.
CORPORATE GOVERNANCE
MIRA INFORM as part of its Due Diligence do provide comments on
Corporate Governance to identify management and governance. These factors often
have been predictive and in some cases have created vulnerabilities to credit
deterioration.
Our Governance Assessment focuses principally on the interactions
between a company’s management, its Board of Directors, Shareholders and other
financial stakeholders.
CONTRAVENTION
Subject is not known to have contravened any existing local laws, regulations
or policies that prohibit, restrict or otherwise affect the terms and
conditions that could be included in the agreement with the subject.
FOREIGN EXCHANGE RATES
|
Currency |
Unit
|
Indian Rupees |
|
US Dollar |
1 |
Rs.60.73 |
|
|
1 |
Rs.101.48 |
|
Euro |
1 |
Rs.81.04 |
INFORMATION DETAILS
|
Information
Gathered by : |
HTL |
|
|
|
|
Analysis Done by
: |
DIV |
|
|
|
|
Report Prepared
by : |
KVT |
SCORE & RATING EXPLANATIONS
|
SCORE FACTORS |
RANGE |
POINTS |
|
HISTORY |
1~10 |
9 |
|
PAID-UP CAPITAL |
1~10 |
8 |
|
OPERATING SCALE |
1~10 |
8 |
|
FINANCIAL CONDITION |
|
|
|
--BUSINESS SCALE |
1~10 |
9 |
|
--PROFITABILIRY |
1~10 |
8 |
|
--LIQUIDITY |
1~10 |
8 |
|
--LEVERAGE |
1~10 |
8 |
|
--RESERVES |
1~10 |
9 |
|
--CREDIT LINES |
1~10 |
8 |
|
--MARGINS |
-5~5 |
-- |
|
DEMERIT POINTS |
|
|
|
--BANK CHARGES |
YES/NO |
NO |
|
--LITIGATION |
YES/NO |
NO |
|
--OTHER ADVERSE INFORMATION |
YES/NO |
NO |
|
MERIT POINTS |
|
|
|
--SOLE DISTRIBUTORSHIP |
YES/NO |
NO |
|
--EXPORT ACTIVITIES |
YES/NO |
NO |
|
--AFFILIATION |
YES/NO |
YES |
|
--LISTED |
YES/NO |
YES |
|
--OTHER MERIT FACTORS |
YES/NO |
YES |
|
DEFAULTER |
|
|
|
--RBI |
YES/NO |
NO |
|
--EPF |
YES/NO |
NO |
|
TOTAL |
|
75 |
This score serves as a reference to assess SC’s credit risk
and to set the amount of credit to be extended. It is calculated from a
composite of weighted scores obtained from each of the major sections of this
report. The assessed factors and their relative weights (as indicated through
%) are as follows:
Financial
condition (40%) Ownership
background (20%) Payment
record (10%)
Credit history
(10%) Market trend
(10%) Operational
size (10%)
RATING EXPLANATIONS
|
RATING |
STATUS |
PROPOSED CREDIT LINE |
|
|
>86 |
Aaa |
Possesses an extremely sound financial base with the strongest
capability for timely payment of interest and principal sums |
Unlimited |
|
71-85 |
Aa |
Possesses adequate working capital. No caution needed for credit transaction.
It has above average (strong) capability for payment of interest and
principal sums |
Large |
|
56-70 |
A |
Financial & operational base are regarded healthy. General unfavourable
factors will not cause fatal effect. Satisfactory capability for payment of
interest and principal sums |
Fairly Large |
|
41-55 |
Ba |
Overall operation is considered normal. Capable to meet normal
commitments. |
Satisfactory |
|
26-40 |
B |
Capability to overcome financial difficulties seems comparatively
below average. |
Small |
|
11-25 |
Ca |
Adverse factors are apparent. Repayment of interest and principal sums
in default or expected to be in default upon maturity |
Limited with full
security |
|
<10 |
C |
Absolute credit risk exists. Caution needed to be exercised |
Credit not
recommended |
|
-- |
NB |
New Business |
-- |
This report is issued at your request without any risk
and responsibility on the part of MIRA INFORM PRIVATE LIMITED (MIPL) or its
officials.