MIRA
INFORM REPORT
|
Report Date : |
20.08.2014 |
IDENTIFICATION DETAILS
|
Name : |
WESTZONE LTD |
|
|
|
|
Registered Office : |
|
|
|
|
|
Country : |
|
|
|
|
|
Financials (as on) : |
31.03.2013 |
|
|
|
|
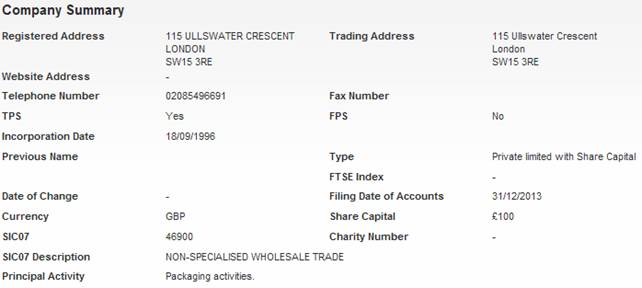
Date of Incorporation : |
18.09.1996 |
|
|
|
|
Legal Form : |
Private Limited with Share Capital |
|
|
|
|
Line of Business : |
Packaging Activities |
|
|
|
|
No. of Employees : |
Not Available |
RATING & COMMENTS
|
MIRA’s Rating : |
B |
|
RATING |
STATUS |
PROPOSED CREDIT LINE |
|
|
26-40 |
B |
Capability to overcome financial difficulties seems comparatively
below average. |
Small |
|
Status : |
Moderate |
|
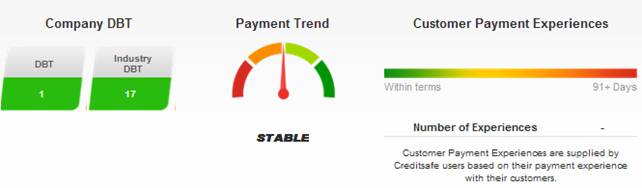
Payment Behaviour : |
Slow but correct |
|
Litigation : |
Clear |
NOTES :
Any query related to this report can be made
on e-mail : infodept@mirainform.com
while quoting report number, name and date.
ECGC Country Risk Classification List – June 01, 2014
|
Country Name |
Previous Rating (31.03.2014) |
Current Rating (01.06.2014) |
|
|
A1 |
A1 |
|
Risk Category |
ECGC
Classification |
|
Insignificant |
A1 |
|
Low Risk |
A2 |
|
Moderate Low Risk |
B1 |
|
Moderate Risk |
B2 |
|
Moderate High Risk |
C1 |
|
High Risk |
C2 |
|
Very High Risk |
D |
The
|
Source
: CIA |
REGISTERED NAME & COMPANY
SUMMARY
|
Company Name |
WESTZONE LTD |
|
Company No |
03251338 |
|
Company Status |
Active - Accounts Filed |
DIRECTORS/MANAGEMENT
Current Directors
|
Name |
Date of Birth |
20/08/1958 |
|
|
Officers Title |
|
Nationality |
British |
|
Present Appointments |
1 |
Function |
Director |
|
Appointment Date |
01/10/1996 |
|
|
|
Address |
|
||
|
Other Actions |
|||
|
|
|
||
|
Name |
Date of Birth |
17/01/1952 |
|
|
Officers Title |
Mr |
Nationality |
British |
|
Present Appointments |
5 |
Function |
Director |
|
Appointment Date |
01/02/1999 |
|
|
|
Address |
|
||
Previous Director/Company
Secretaries
|
Name |
Current Directorships |
Previous Directorships |
|
0 |
2 |
|
|
0 |
2 |
|
|
118 |
99276 |
|
|
139 |
87062 |
NEGATIVE INFORMATION
CCJ
|
Total Number of Exact CCJs - |
Total Value of Exact CCJs - |
||
|
Total Number of Possible CCJs
- |
Total Value of Possible CCJs
- |
||
|
Total Number of Satisfied
CCJs - |
Total Value of Satisfied CCJs
- |
||
|
Total Number of Writs - |
- |
|
|
Exact CCJ Details
|
No CCJs found |
Possible CCJs Details
|
There are no possible CCJ
details |
Writ Details
|
No writs found |
SHARE & SHARE CAPITAL
INFORMATION
Top 20 Shareholders
|
Name |
Currency |
Share Count |
Share Type |
Nominal Value |
% of Total Share Count |
|
RANA KUWATLY-HAKIM |
GBP |
80 |
ORDINARY |
1 |
80 |
|
NABIL HAKIM |
GBP |
20 |
ORDINARY |
1 |
20 |
PAYMENT INFORMATION
GROUP STRUCTURE & AFFILIATED COMPANIES
Statistics
|
Group |
- |
|
Linkages |
|
|
Countries |
Summary
|
Holding Company |
- |
|
Ownership Status |
|
|
Ultimate Holding Company |
- |
Group structure
|
FINANCIAL INFORMATION
Profit & Loss
|
Date Of Accounts |
31/03/13 |
(%) |
31/03/12 |
(%) |
31/03/11 |
(%) |
31/03/10 |
(%) |
31/03/09 |
|
Weeks |
52 |
(%) |
52 |
(%) |
52 |
(%) |
52 |
(%) |
52 |
|
Currency |
GBP |
(%) |
GBP |
(%) |
GBP |
(%) |
GBP |
(%) |
GBP |
|
Consolidated A/cs |
N |
(%) |
N |
(%) |
N |
(%) |
N |
(%) |
N |
|
Turnover |
- |
- |
- |
- |
- |
- |
- |
- |
- |
|
Export |
- |
- |
- |
- |
- |
- |
- |
- |
- |
|
Cost of Sales |
- |
- |
- |
- |
- |
- |
- |
- |
- |
|
Gross Profit |
- |
- |
- |
- |
- |
- |
- |
- |
- |
|
Wages & Salaries |
- |
- |
- |
- |
- |
- |
- |
- |
- |
|
Directors Emoluments |
- |
- |
- |
- |
- |
- |
- |
- |
- |
|
Operating Profit |
- |
- |
- |
- |
- |
- |
- |
- |
- |
|
Depreciation |
£399 |
-86.8% |
£3,025 |
-40.9% |
£5,118 |
-3.3% |
£5,295 |
-4.4% |
£5,539 |
|
Audit Fees |
- |
- |
- |
- |
- |
- |
- |
- |
- |
|
Interest Payments |
- |
- |
- |
- |
- |
- |
- |
- |
- |
|
Pre Tax Profit |
- |
- |
- |
- |
- |
- |
- |
- |
- |
|
Taxation |
- |
- |
- |
- |
- |
- |
- |
- |
- |
|
Profit After Tax |
- |
- |
- |
- |
- |
- |
- |
- |
- |
|
Dividends Payable |
- |
- |
- |
- |
- |
- |
- |
- |
- |
|
Retained Profit |
- |
- |
- |
- |
- |
- |
- |
- |
- |
Balance Sheet
|
Date Of Accounts |
31/03/13 |
(%) |
31/03/12 |
(%) |
31/03/11 |
(%) |
31/03/10 |
(%) |
31/03/09 |
|
Tangible Assets |
£1,607 |
117.2% |
£740 |
-74.8% |
£2,932 |
-63.6% |
£8,050 |
-39.7% |
£13,345 |
|
Intangible Assets |
0 |
- |
0 |
- |
0 |
- |
0 |
- |
0 |
|
Total Fixed Assets |
£1,607 |
117.2% |
£740 |
-74.8% |
£2,932 |
-63.6% |
£8,050 |
-39.7% |
£13,345 |
|
Stock |
£376,217 |
165.3% |
£141,785 |
76.3% |
£80,405 |
7.8% |
£74,554 |
-9.3% |
£82,167 |
|
Trade Debtors |
£213,440 |
849.7% |
£22,474 |
-80.7% |
£116,608 |
6.1% |
£109,950 |
135.6% |
£46,662 |
|
Cash |
£35,554 |
999.9% |
£2,991 |
-32.9% |
£4,458 |
-99% |
£425,186 |
999.9% |
£352 |
|
Other Debtors |
0 |
- |
0 |
- |
0 |
- |
0 |
- |
0 |
|
Miscellaneous Current Assets |
0 |
- |
0 |
- |
0 |
- |
0 |
- |
0 |
|
Total Current Assets |
£625,211 |
273.8% |
£167,250 |
-17% |
£201,471 |
-67% |
£609,690 |
372% |
£129,181 |
|
Trade Creditors |
£486,114 |
335.5% |
£111,624 |
-21% |
£141,261 |
-73.9% |
£540,601 |
379.8% |
£112,671 |
|
Bank Loans & Overdrafts |
0 |
- |
0 |
- |
0 |
- |
0 |
- |
0 |
|
Other Short Term Finance |
0 |
- |
0 |
- |
0 |
- |
0 |
- |
0 |
|
Miscellaneous Current
Liabilities |
0 |
- |
0 |
- |
0 |
- |
0 |
- |
0 |
|
Total Current Liabilities |
£486,114 |
335.5% |
£111,624 |
-21% |
£141,261 |
-73.9% |
£540,601 |
379.8% |
£112,671 |
|
Bank Loans & Overdrafts
and LTL |
£138,309 |
1.4% |
£136,374 |
2.8% |
£132,646 |
26.3% |
£105,063 |
70.6% |
£61,567 |
|
Other Long Term Finance |
0 |
- |
0 |
- |
0 |
- |
0 |
- |
0 |
|
Total Long Term Liabilities |
£138,309 |
1.4% |
£136,374 |
2.8% |
£132,646 |
26.3% |
£105,063 |
70.6% |
£61,567 |
Capital & Reserves
|
Date Of Accounts |
31/03/13 |
(%) |
31/03/12 |
(%) |
31/03/11 |
(%) |
31/03/10 |
(%) |
31/03/09 |
|
Called Up Share Capital |
£100 |
- |
£100 |
- |
£100 |
- |
£100 |
- |
£100 |
|
P & L Account Reserve |
£2,295 |
102.9% |
-£80,108 |
-15.1% |
-£69,604 |
-148.4% |
-£28,024 |
11.9% |
-£31,812 |
|
Revaluation Reserve |
- |
- |
- |
- |
- |
- |
- |
- |
- |
|
Sundry Reserves |
- |
- |
- |
- |
- |
- |
- |
- |
- |
|
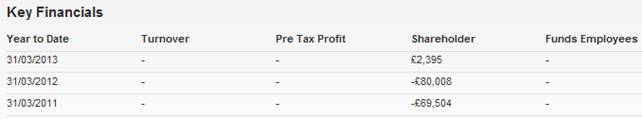
Shareholder Funds |
£2,395 |
103% |
-£80,008 |
-15.1% |
-£69,504 |
-148.9% |
-£27,924 |
11.9% |
-£31,712 |
Other Financial Items
|
Date Of Accounts |
31/03/13 |
(%) |
31/03/12 |
(%) |
31/03/11 |
(%) |
31/03/10 |
(%) |
31/03/09 |
|
Net Worth |
£2,395 |
103% |
-£80,008 |
-15.1% |
-£69,504 |
-148.9% |
-£27,924 |
11.9% |
-£31,712 |
|
Working Capital |
£139,097 |
150.1% |
£55,626 |
-7.6% |
£60,210 |
-12.9% |
£69,089 |
318.5% |
£16,510 |
|
Total Assets |
£626,818 |
273.1% |
£167,990 |
-17.8% |
£204,403 |
-66.9% |
£617,740 |
333.4% |
£142,526 |
|
Total Liabilities |
£624,423 |
151.8% |
£247,998 |
-9.5% |
£273,907 |
-57.6% |
£645,664 |
270.6% |
£174,238 |
|
Net Assets |
£2,395 |
103% |
-£80,008 |
-15.1% |
-£69,504 |
-148.9% |
-£27,924 |
11.9% |
-£31,712 |
Cash Flow
|
Date Of Accounts |
31/03/13 |
(%) |
31/03/12 |
(%) |
31/03/11 |
(%) |
31/03/10 |
(%) |
31/03/09 |
|
Net Cashflow from Operations |
- |
- |
- |
- |
- |
- |
- |
- |
- |
|
Net Cashflow before Financing |
- |
- |
- |
- |
- |
- |
- |
- |
- |
|
Net Cashflow from Financing |
- |
- |
- |
- |
- |
- |
- |
- |
- |
|
Increase in Cash |
- |
- |
- |
- |
- |
- |
- |
- |
- |
Miscellaneous
|
Date Of Accounts |
31/03/13 |
(%) |
31/03/12 |
(%) |
31/03/11 |
(%) |
31/03/10 |
(%) |
31/03/09 |
|
Contingent Liability |
NO |
- |
NO |
- |
NO |
- |
NO |
- |
NO |
|
Capital Employed |
£140,704 |
149.6% |
£56,366 |
-10.7% |
£63,142 |
-18.1% |
£77,139 |
158.4% |
£29,855 |
|
Number of Employees |
- |
- |
- |
- |
- |
- |
- |
- |
- |
|
Auditors |
|
||||||||
|
Auditor Comments |
The company is exempt from
audit |
||||||||
|
Bankers |
|
||||||||
|
Bank Branch Code |
|
||||||||
Ratios
|
Date Of Accounts |
31/03/13 |
31/03/12 |
31/03/11 |
31/03/10 |
31/03/09 |
|
Pre-tax profit margin % |
- |
- |
- |
- |
- |
|
Current ratio |
1.29 |
1.50 |
1.43 |
1.13 |
1.15 |
|
Sales/Net Working Capital |
- |
- |
- |
- |
- |
|
Gearing % |
5774.90 |
-170.50 |
-190.80 |
-376.20 |
-194.10 |
|
Equity in % |
0.40 |
-47.60 |
-34 |
-4.50 |
-22.20 |
|
Creditor Days |
- |
- |
- |
- |
- |
|
Debtor Days |
- |
- |
- |
- |
- |
|
Liquidity/Acid Test |
0.51 |
0.22 |
0.85 |
0.98 |
0.41 |
|
Return On Capital Employed % |
- |
- |
- |
- |
- |
|
Return On Total Assets
Employed % |
- |
- |
- |
- |
- |
|
Current Debt Ratio |
202.97 |
-1.39 |
-2.03 |
-19.35 |
-3.55 |
|
Total Debt Ratio |
260.71 |
-3.09 |
-3.94 |
-23.12 |
-5.49 |
|
Stock Turnover Ratio % |
- |
- |
- |
- |
- |
|
Return on Net Assets Employed
% |
- |
- |
- |
- |
- |
FOREIGN EXCHANGE RATES
Na
ADDITIONAL INFORMATION
Enquiries Trend
|
There have been 2 enquiries
in the last 12 months. |
|
There are an average of 0
reports taken each month. |
Current Company Secretary
|
Name |
Date of Birth |
17/01/1952 |
|
|
Officers Title |
Mr |
Nationality |
British |
|
Present Appointments |
5 |
Function |
Company Secretary |
|
Appointment Date |
01/07/2000 |
|
|
|
Address |
|
||
Status History
|
No Status History found |
Event History
|
Date |
Description |
|
|
13/01/2014 |
New Accounts Filed |
|
|
19/10/2013 |
Annual Returns |
|
|
15/01/2013 |
New Accounts Filed |
|
|
04/10/2012 |
Annual Returns |
|
|
13/01/2012 |
New Accounts Filed |
|
|
18/10/2011 |
Annual Returns |
|
|
07/01/2011 |
New Accounts Filed |
|
|
12/10/2010 |
Annual Returns |
|
|
02/02/2010 |
New Accounts Filed |
|
|
30/11/2009 |
Annual Returns |
|
|
08/03/2009 |
New Accounts Filed |
|
|
23/09/2008 |
Annual Returns |
|
|
05/06/2008 |
New Accounts Filed |
|
|
06/05/2008 |
Accounts Overdue |
|
|
25/09/2007 |
Annual Returns |
|
Previous Company Names
|
No Previous Names found |
NOTES & COMMENTS
Commentary
|
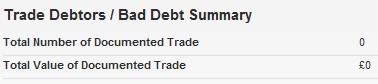
No exact match CCJs are recorded
against the company. |
|
|
The company's credit rating
has increased from 33 to 61 which indicates good creditworthiness. |
|
|
There is insufficient data to
indicate a change in this company's percentage of sales. |
|
|
Net Worth increased by 103%
during the latest trading period. |
|
|
A 273.1% growth in Total
Assets occurred during the latest trading period. |
|
|
There is insufficient data to
indicate a change in this company's pre-tax profit. |
|
|
The company saw an increase
in their Cash Balance of 999.9% during the latest trading period. |
|
|
The company is exempt from
audit. |
|
|
No recent changes in
directorship are recorded. |
|
|
The company is not part of a
group. |
|
|
The movement in accumulated
earnings would indicate that the company made a profit after tax and other
appropriations, including dividends. |
|
|
The company was established
over 17 years ago. |
|
FOREIGN EXCHANGE RATES
|
Currency |
Unit
|
Indian Rupees |
|
US Dollar |
1 |
Rs.60.73 |
|
|
1 |
Rs.101.48 |
|
Euro |
1 |
Rs.81.04 |
INFORMATION DETAILS
|
Analysis Done by
: |
DIV |
|
|
|
|
Report Prepared
by : |
PDT |
RATING EXPLANATIONS
|
RATING |
STATUS |
PROPOSED CREDIT LINE |
|
|
|
>86 |
Aaa |
Possesses an extremely sound financial base with the strongest
capability for timely payment of interest and principal sums |
Unlimited |
|
|
71-85 |
Aa |
Possesses adequate working capital. No caution needed for credit transaction.
It has above average (strong) capability for payment of interest and
principal sums |
Large |
|
|
56-70 |
A |
Financial & operational base are regarded healthy. General unfavourable
factors will not cause fatal effect. Satisfactory capability for payment of
interest and principal sums |
Fairly Large |
|
|
41-55 |
Ba |
Overall operation is considered normal. Capable to meet normal
commitments. |
Satisfactory |
|
|
26-40 |
B |
Capability to overcome financial difficulties seems comparatively
below average. |
Small |
|
|
11-25 |
Ca |
Adverse factors are apparent. Repayment of interest and principal sums
in default or expected to be in default upon maturity |
Limited with
full security |
|
|
<10 |
C |
Absolute credit risk exists. Caution needed to be exercised |
Credit not
recommended |
|
|
-- |
NB |
New Business |
-- |
|
This score serves as a reference to assess SC’s credit risk and
to set the amount of credit to be extended. It is calculated from a composite
of weighted scores obtained from each of the major sections of this report. The
assessed factors and their relative weights (as indicated through %) are as
follows:
Financial
condition (40%) Ownership
background (20%) Payment
record (10%)
Credit history
(10%) Market trend
(10%) Operational
size (10%)
This report is issued at your request without any
risk and responsibility on the part of MIRA INFORM PRIVATE LIMITED (MIPL)
or its officials.