MIRA
INFORM REPORT
|
Report Date : |
21.08.2014 |
IDENTIFICATION DETAILS
|
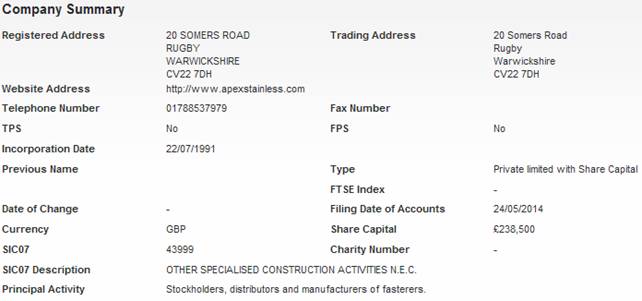
Name : |
APEX STAINLESS FASTENERS |
|
|
|
|
Registered Office : |
20, |
|
|
|
|
Country : |
|
|
|
|
|
Financials (as on) : |
31.12.2013 |
|
|
|
|
Date of Incorporation : |
22.07.1991 |
|
|
|
|
Legal Form : |
Private Limited With Share Capital |
|
|
|
|
Line of Business : |
Stockholders, Distributors and Manufacturer of Fasteners. |
|
|
|
|
No of Employees : |
108 |
RATING & COMMENTS
|
MIRA’s Rating : |
Ba |
|
RATING |
STATUS |
PROPOSED CREDIT LINE |
|
|
41-55 |
Ba |
Overall operation is considered normal. Capable to meet normal
commitments. |
Satisfactory |
|
Status : |
Satisfactory |
|
Payment Behaviour : |
Slow but correct |
|
Litigation : |
Clear |
NOTES :
Any query related to this report can be made
on e-mail : infodept@mirainform.com
while quoting report number, name and date.
ECGC Country Risk Classification List – June 01, 2014
|
Country Name |
Previous Rating (31.03.2014) |
Current Rating (01.06.2014) |
|
|
A1 |
A1 |
|
Risk Category |
ECGC
Classification |
|
Insignificant |
A1 |
|
Low Risk |
A2 |
|
Moderate Low Risk |
B1 |
|
Moderate Risk |
B2 |
|
Moderate High Risk |
C1 |
|
High Risk |
C2 |
|
Very High Risk |
D |
The
|
Source
: CIA |
REGISTERED NAME & COMPANY
SUMMARY
APEX STAINLESS
FASTENERS
DIRECTORS/MANAGEMENT
CURRENT DIRECTORS
|
Name |
Paul Richard Lower |
Date of Birth |
17/09/1948 |
|
Officers Title |
Mr |
Nationality |
British |
|
Present Appointments |
8 |
Function |
Director |
|
Appointment Date |
01/10/1993 |
|
|
|
Address |
Northend Manor, Little Dassett, Southam, |
||
|
Other Actions |
View Director Report |
View AML Report |
|
|
|
View Trace Report |
|
|
|
Name |
Matthew Paul Lower |
Date of Birth |
31/05/1975 |
|
Officers Title |
Mr |
Nationality |
British |
|
Present Appointments |
4 |
Function |
Director |
|
Appointment Date |
07/05/2003 |
|
|
|
Address |
|
||
|
Other Actions |
View Director Report |
View Consumer Report |
View AML Report |
|
|
View Trace Report |
|
|
|
Name |
Edward Richard Lower |
Date of Birth |
22/02/1981 |
|
Officers Title |
Mr |
Nationality |
British |
|
Present Appointments |
2 |
Function |
Director |
|
Appointment Date |
09/10/2006 |
|
|
|
Address |
8 |
||
|
Other Actions |
View Director Report |
View Consumer Report |
View AML Report |
|
|
View Trace Report |
|
|
Current Company Secretary
|
Name |
Tara Michelle Castle |
Date of Birth |
- |
|
Officers Title |
Mrs |
Nationality |
|
|
Present Appointments |
1 |
Function |
Company Secretary |
|
Appointment Date |
01/07/2013 |
|
|
|
Address |
|
||
Previous Director/Company
Secretaries
|
Name |
Current Directorships |
Previous Directorships |
|
0 |
1 |
|
|
Linda Joan Lower |
1 |
2 |
|
Anthony John Brown |
0 |
1 |
|
Keith John Everton |
0 |
1 |
|
0 |
1 |
|
|
Paul Richard Lower |
8 |
7 |
|
LONDON LAW SERVICES
LIMITED |
1697 |
53451 |
|
|
1799 |
53393 |
NEGATIVE INFORMATION
Mortgage Summary
Total Mortgage 3
Outstanding 2
Satisfied 1
Trade Debtors / Bad Debt
Summary
Total Number of Documented
Trade 9
Total Value of Documented
Trade £16,716
CCJ
|
Total Number of Exact
CCJs - |
Total Value of Exact
CCJs - |
||
|
Total Number of Possible
CCJs - |
Total Value of Possible
CCJs - |
||
|
Total Number of
Satisfied CCJs - |
Total Value of Satisfied
CCJs - |
||
|
Total Number of Writs - |
- |
|
|
Exact CCJ Details
|
No CCJs found |
Possible CCJs Details
|
There are no possible
CCJ details |
Writ Details
|
No writs found |
Mortgage Details
|
Mortgage Type: |
|
||
|
Date Charge Created: |
17/06/14 |
|
|
|
Date Charge Registered: |
18/06/14 |
|
|
|
Date Charge Satisfied: |
- |
|
|
|
Status: |
OUTSTANDING |
|
|
|
Person(s) Entitled: |
LLOYDS BANK PLC; |
||
|
Amount Secured: |
|
||
|
Details: |
CONTAINS FIXED
CHARGE.CONTAINS NEGATIVEPLEDGE. |
||
|
Mortgage Type: |
LEGAL MORTGAGE |
||
|
Date Charge Created: |
05/02/98 |
|
|
|
Date Charge Registered: |
07/02/98 |
|
|
|
Date Charge Satisfied: |
27/05/08 |
|
|
|
Status: |
SATISFIED |
|
|
|
Person(s) Entitled: |
MIDLAND BANK PLC |
||
|
Amount Secured: |
ALL MONIES DUE OR TO BECOME
DUE FROM THE COMPANY TO THE CHARGEE ON ANY ACCOUNT WHATSOEVER |
||
|
Details: |
|
||
|
Mortgage Type: |
FIXED AND FLOTING CHARGE |
||
|
Date Charge Created: |
27/11/91 |
|
|
|
Date Charge Registered: |
06/12/91 |
|
|
|
Date Charge Satisfied: |
- |
|
|
|
Status: |
OUTSTANDING |
|
|
|
Person(s) Entitled: |
MIDLAND BANK PLC |
||
|
Amount Secured: |
ALL MONIES DUE OR TO
BECOME DUE FROM THE COMPANY TO THE CHARGEE ON ANY ACCOUNT WHATSOEVER |
||
|
Details: |
FIXED AND FLOATING CHARGE
OVER ALL THE UNDERTAKING AND ALL PROPERTY AND ASSETS PRESENT AND FUTURE
INCLUDING UNCALLED CAPITAL |
||
Creditor Details
|
|
Total
Number |
Total
Value |
|
Trade Creditors |
0 |
- |
|
No Creditor Data |
Trade Debtors / Bad Debt
Detail
|
|
Total
Number of Documented Trade |
Total
Value of Documented Trade |
|
Trade Debtors |
9 |
£16,716 |
|
Company Name |
Amount |
Statement Date |
|
£4,634 |
22/12/2009 |
|
|
The Special Bolt Company
Limited |
£4,365 |
18/11/2009 |
|
Wilfast Limited |
£3,852 |
25/11/2009 |
|
Penn Engineering
Supplies Limited |
£1,312 |
17/12/2009 |
|
Westwood Bolt And Nut
Company Ltd |
£892 |
19/05/2011 |
|
Abcrest ( |
£837 |
08/03/2010 |
|
Malton Engineering
Supplies Limited |
£348 |
06/08/2013 |
|
A J S Fasteners Limited |
£300 |
11/08/2009 |
|
Lugg Facilities Ltd |
£176 |
15/04/2011 |
SHARE & SHARE CAPITAL
INFORMATION
TOP 20 SHAREHOLDERS
|
Name |
Currency |
Share Count |
Share Type |
Nominal Value |
% of Total Share Count |
|
APEX STAINLESS HOLDINGS LTD |
GBP |
238,500 |
ORDINARY |
1 |
100 |
PAYMENT INFORMATION
|
Average Invoice Value |
£1311.57 |
|
Invoices available |
100 |
|
Paid |
81 |
|
Outstanding |
19 |
|
Outstanding |
19 |
|
Trade Payment Data is
information that we collect from selected third party partners who send us
information about their whole sales ledger. |
|
|
Within Terms |
0-30 Days |
31-60 Days |
61-90 Days |
91+ Days |
|
Paid |
29 |
33 |
4 |
4 |
11 |
|
Outstanding |
0 |
1 |
2 |
0 |
16 |
GROUP STRUCTURE & AFFILIATED
COMPANIES
GROUP STRUCTURE
|
Company Name |
Registered Number |
Latest Key Financials |
Consol. Accounts |
Turnover |
|
APEX STAINLESS HOLDINGS... |
08403986 |
31.12.2013 |
Y |
£14,496,067 |
|
APEX STAINLESS FASTENE... |
02631068 |
31.12.2013 |
N |
£22,124,015 |
FINANCIAL INFORMATION
Profit & Loss
|
Date Of Accounts |
31/12/13 |
(%) |
31/12/12 |
(%) |
31/12/11 |
(%) |
31/12/10 |
(%) |
31/12/09 |
|
Weeks |
52 |
(%) |
52 |
(%) |
52 |
(%) |
52 |
(%) |
52 |
|
Currency |
GBP |
(%) |
GBP |
(%) |
GBP |
(%) |
GBP |
(%) |
GBP |
|
Consolidated A/cs |
N |
(%) |
N |
(%) |
N |
(%) |
N |
(%) |
N |
|
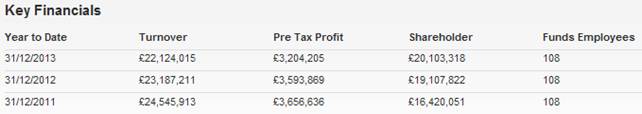
Turnover |
£22,124,015 |
-4.6% |
£23,187,211 |
-5.5% |
£24,545,913 |
13.1% |
£21,694,002 |
18.6% |
£18,286,992 |
|
Export |
- |
- |
- |
- |
£209,769 |
-41.4% |
£357,990 |
118.7% |
£163,715 |
|
Cost of Sales |
£13,811,370 |
-4% |
£14,389,891 |
-6.1% |
£15,328,644 |
21.3% |
£12,633,126 |
10.4% |
£11,444,921 |
|
Gross Profit |
£8,312,645 |
-5.5% |
£8,797,320 |
-4.6% |
£9,217,269 |
1.7% |
£9,060,876 |
32.4% |
£6,842,071 |
|
Wages & Salaries |
£2,657,845 |
-4.5% |
£2,781,871 |
0.1% |
£2,780,376 |
2.3% |
£2,717,321 |
15.5% |
£2,352,525 |
|
Directors Emoluments |
£287,995 |
-34.3% |
£438,178 |
14% |
£384,463 |
6.7% |
£360,220 |
3.5% |
£348,017 |
|
Operating Profit |
£3,152,104 |
-12.1% |
£3,584,547 |
-2.7% |
£3,684,020 |
-9.8% |
£4,085,612 |
59.9% |
£2,554,501 |
|
Depreciation |
£104,825 |
-53.2% |
£224,033 |
-3.3% |
£231,691 |
78.5% |
£129,813 |
41% |
£92,083 |
|
Audit Fees |
£13,500 |
-2% |
£13,775 |
8.9% |
£12,650 |
5.4% |
£12,000 |
2.1% |
£11,750 |
|
Interest Payments |
£4,948 |
-14.7% |
£5,803 |
-81.7% |
£31,722 |
-50.4% |
£63,919 |
24% |
£51,566 |
|
Pre Tax Profit |
£3,204,205 |
-10.8% |
£3,593,869 |
-1.7% |
£3,656,636 |
-9.3% |
£4,030,880 |
60.4% |
£2,512,764 |
|
Taxation |
-£730,009 |
19.4% |
-£906,098 |
7.1% |
-£975,055 |
12.3% |
-£1,111,822 |
-57.4% |
-£706,152 |
|
Profit After Tax |
£2,474,196 |
-7.9% |
£2,687,771 |
0.2% |
£2,681,581 |
-8.1% |
£2,919,058 |
61.6% |
£1,806,612 |
|
Dividends Payable |
£1,478,700 |
- |
- |
- |
- |
-100% |
£1,550,250 |
- |
£1,550,250 |
|
Retained Profit |
£995,496 |
-63% |
£2,687,771 |
0.2% |
£2,681,581 |
95.9% |
£1,368,808 |
433.9% |
£256,362 |
balance sheet
|
Date Of Accounts |
31/12/13 |
(%) |
31/12/12 |
(%) |
31/12/11 |
(%) |
31/12/10 |
(%) |
31/12/09 |
|
Tangible Assets |
£6,326,650 |
338% |
£1,444,454 |
-9.2% |
£1,591,525 |
13.7% |
£1,399,248 |
531.2% |
£221,685 |
|
Intangible Assets |
0 |
- |
0 |
- |
0 |
- |
0 |
- |
0 |
|
Total Fixed Assets |
£6,326,650 |
338% |
£1,444,454 |
-9.2% |
£1,591,525 |
13.7% |
£1,399,248 |
531.2% |
£221,685 |
|
Stock |
£9,789,824 |
-3.7% |
£10,162,361 |
-7.9% |
£11,033,844 |
9.1% |
£10,117,190 |
19.9% |
£8,441,353 |
|
Trade Debtors |
£4,608,799 |
-7.9% |
£5,006,096 |
-6.2% |
£5,335,324 |
10.8% |
£4,813,902 |
25.7% |
£3,829,041 |
|
Cash |
£1,613,229 |
-71.1% |
£5,583,975 |
148.8% |
£2,244,668 |
339.7% |
£510,487 |
-77.4% |
£2,259,599 |
|
Other Debtors |
£153,673 |
18.7% |
£129,488 |
2.2% |
£126,669 |
-21% |
£160,335 |
27.7% |
£125,578 |
|
Miscellaneous Current
Assets |
0 |
- |
0 |
- |
0 |
- |
0 |
- |
0 |
|
Total Current Assets |
£16,165,525 |
-22.6% |
£20,881,920 |
11.4% |
£18,740,505 |
20.1% |
£15,601,914 |
6.5% |
£14,655,571 |
|
Trade Creditors |
£411,959 |
-42.1% |
£710,914 |
-38.2% |
£1,150,617 |
168.7% |
£428,236 |
-48.1% |
£824,763 |
|
Bank Loans &
Overdrafts |
0 |
- |
0 |
- |
0 |
- |
0 |
- |
0 |
|
Other Short Term Finance |
£45,939 |
56.5% |
£29,357 |
-72.7% |
£107,430 |
-82.6% |
£617,145 |
143.5% |
£253,463 |
|
Miscellaneous Current
Liabilities |
£1,930,959 |
-22.1% |
£2,478,281 |
-6.6% |
£2,653,932 |
19.7% |
£2,217,311 |
55.1% |
£1,429,368 |
|
Total Current
Liabilities |
£2,388,857 |
-25.8% |
£3,218,552 |
-17.7% |
£3,911,979 |
19.9% |
£3,262,692 |
30.1% |
£2,507,594 |
|
Bank Loans &
Overdrafts and LTL |
0 |
- |
0 |
- |
0 |
- |
0 |
- |
0 |
|
Other Long Term Finance |
0 |
- |
0 |
- |
0 |
- |
0 |
- |
0 |
|
Total Long Term
Liabilities |
0 |
- |
0 |
- |
0 |
- |
0 |
- |
0 |
Capital & Reserves
|
Date Of Accounts |
31/12/13 |
(%) |
31/12/12 |
(%) |
31/12/11 |
(%) |
31/12/10 |
(%) |
31/12/09 |
|
Called Up Share Capital |
£238,500 |
- |
£238,500 |
- |
£238,500 |
- |
£238,500 |
- |
£238,500 |
|
P & L Account
Reserve |
£19,845,318 |
5.3% |
£18,849,822 |
16.6% |
£16,162,051 |
19.9% |
£13,480,470 |
11.3% |
£12,111,662 |
|
Revaluation Reserve |
- |
- |
- |
- |
- |
- |
- |
- |
- |
|
Sundry Reserves |
£19,500 |
- |
£19,500 |
- |
£19,500 |
- |
£19,500 |
- |
£19,500 |
|
Shareholder Funds |
£20,103,318 |
5.2% |
£19,107,822 |
16.4% |
£16,420,051 |
19.5% |
£13,738,470 |
11.1% |
£12,369,662 |
Other Financial Items
|
Date Of Accounts |
31/12/13 |
(%) |
31/12/12 |
(%) |
31/12/11 |
(%) |
31/12/10 |
(%) |
31/12/09 |
|
Net Worth |
£20,103,318 |
5.2% |
£19,107,822 |
16.4% |
£16,420,051 |
19.5% |
£13,738,470 |
11.1% |
£12,369,662 |
|
Working Capital |
£13,776,668 |
-22% |
£17,663,368 |
19.1% |
£14,828,526 |
20.2% |
£12,339,222 |
1.6% |
£12,147,977 |
|
Total Assets |
£22,492,175 |
0.7% |
£22,326,374 |
9.8% |
£20,332,030 |
19.6% |
£17,001,162 |
14.3% |
£14,877,256 |
|
Total Liabilities |
£2,388,857 |
-25.8% |
£3,218,552 |
-17.7% |
£3,911,979 |
19.9% |
£3,262,692 |
30.1% |
£2,507,594 |
|
Net Assets |
£20,103,318 |
5.2% |
£19,107,822 |
16.4% |
£16,420,051 |
19.5% |
£13,738,470 |
11.1% |
£12,369,662 |
Cash Flow
|
Date Of Accounts |
31/12/13 |
(%) |
31/12/12 |
(%) |
31/12/11 |
(%) |
31/12/10 |
(%) |
31/12/09 |
|
Net Cashflow from
Operations |
- |
- |
£4,541,181 |
57.2% |
£2,888,638 |
13.2% |
£2,550,699 |
-49.6% |
£5,061,640 |
|
Net Cashflow before
Financing |
- |
-100% |
£3,339,307 |
92.6% |
£1,734,181 |
199.1% |
-£1,749,112 |
-164% |
£2,732,866 |
|
Net Cashflow from
Financing |
- |
- |
- |
- |
- |
- |
- |
100% |
-£2,908,724 |
|
Increase in Cash |
- |
- |
£3,339,307 |
92.6% |
£1,734,181 |
199.1% |
-£1,749,112 |
-894.6% |
-£175,858 |
Miscellaneous
|
Date Of Accounts |
31/12/13 |
(%) |
31/12/12 |
(%) |
31/12/11 |
(%) |
31/12/10 |
(%) |
31/12/09 |
|
Contingent Liability |
YES |
- |
YES |
- |
YES |
- |
YES |
- |
YES |
|
Capital Employed |
£20,103,318 |
5.2% |
£19,107,822 |
16.4% |
£16,420,051 |
19.5% |
£13,738,470 |
11.1% |
£12,369,662 |
|
Number of Employees |
108 |
- |
108 |
- |
108 |
0.9% |
107 |
13.8% |
94 |
|
Auditors |
HARRISON BEALE &
OWEN LIMITED |
||||||||
|
Auditor Comments |
The audit report contains
no adverse comments |
||||||||
|
Bankers |
HSBC BANK PLC |
||||||||
|
Bank Branch Code |
|
||||||||
Ratio
|
Date Of Accounts |
31/12/13 |
31/12/12 |
31/12/11 |
31/12/10 |
31/12/09 |
|
Pre-tax profit margin % |
14.48 |
15.50 |
14.90 |
18.58 |
13.74 |
|
Current ratio |
6.77 |
6.49 |
4.79 |
4.78 |
5.84 |
|
Sales/Net Working
Capital |
1.61 |
1.31 |
1.66 |
1.76 |
1.51 |
|
Gearing % |
0 |
0 |
0 |
0 |
0 |
|
Equity in % |
89.40 |
85.60 |
80.80 |
80.80 |
83.10 |
|
Creditor Days |
6.77 |
11.16 |
17.06 |
7.18 |
16.41 |
|
Debtor Days |
75.82 |
78.58 |
79.11 |
80.77 |
76.21 |
|
Liquidity/Acid Test |
2.66 |
3.33 |
1.97 |
1.68 |
2.47 |
|
Return On Capital
Employed % |
15.93 |
18.80 |
22.26 |
29.34 |
20.31 |
|
Return On Total Assets
Employed % |
14.24 |
16.09 |
17.98 |
23.70 |
16.88 |
|
Current Debt Ratio |
0.11 |
0.16 |
0.23 |
0.23 |
0.20 |
|
Total Debt Ratio |
0.11 |
0.16 |
0.23 |
0.23 |
0.20 |
|
Stock Turnover Ratio % |
44.24 |
43.82 |
44.95 |
46.63 |
46.16 |
|
Return on Net Assets
Employed % |
15.93 |
18.80 |
22.26 |
29.34 |
20.31 |
FOREIGN EXCHANGE RATES
N/A
ADDITIONAL INFORMATION
STATUS HISTORY
|
No Status History found. |
Event History
|
Date |
Description |
|
18/07/2014 |
Annual Returns |
|
31/05/2014 |
New Accounts Filed |
|
31/05/2014 |
New Accounts Filed |
|
29/07/2013 |
Annual Returns |
|
22/07/2013 |
Annual Returns |
|
19/07/2013 |
Mr P.R. Lower has
resigned as company secretary |
|
19/07/2013 |
New Company |
|
07/05/2013 |
Mrs L.J. Lower has left the
board |
|
13/04/2013 |
New Accounts Filed |
|
27/07/2012 |
Annual Returns |
|
10/05/2012 |
New Accounts Filed |
|
05/03/2012 |
Change in Reg. Office |
|
22/07/2011 |
Annual Returns |
|
18/05/2011 |
New Accounts Filed |
|
18/05/2011 |
New Accounts Filed |
Previous Company Names
|
No Previous Names found |
NOTES & COMMENTS
COMMENTARY
|
No exact match CCJs are
recorded against the company. |
|
Sales in the latest
trading period decreased 4.6% on the previous trading period. |
|
Net Worth increased by
5.2% during the latest trading period. |
|
A 0.7% growth in Total
Assets occurred during the latest trading period. |
|
Pre-tax profits
decreased by 10.8% compared to the previous trading period. |
|
The company saw a
decrease in their Cash Balance of 71.1% during the latest trading period. |
|
The audit report
contains no adverse comments. |
|
The company has
undergone recent changes in its directorships. |
|
The company is part of a
group. |
|
The company was established
over 22 years ago. |
FOREIGN EXCHANGE RATES
|
Currency |
Unit
|
Indian Rupees |
|
US Dollar |
1 |
Rs.60.67 |
|
|
1 |
Rs.100.81 |
|
Euro |
1 |
Rs.80.73 |
INFORMATION DETAILS
|
Analysis Done by
: |
RAS |
|
|
|
|
Report Prepared
by : |
TPT |
RATING EXPLANATIONS
|
RATING |
STATUS |
PROPOSED CREDIT LINE |
|
|
>86 |
Aaa |
Possesses an extremely sound financial base with the strongest
capability for timely payment of interest and principal sums |
Unlimited |
|
71-85 |
Aa |
Possesses adequate working capital. No caution needed for credit
transaction. It has above average (strong) capability for payment of interest
and principal sums |
Large |
|
56-70 |
A |
Financial & operational base are regarded healthy. General unfavourable
factors will not cause fatal effect. Satisfactory capability for payment of
interest and principal sums |
Fairly Large |
|
41-55 |
Ba |
Overall
operation is considered normal. Capable to meet normal commitments. |
Satisfactory |
|
26-40 |
B |
Capability to overcome financial difficulties seems comparatively
below average. |
Small |
|
11-25 |
Ca |
Adverse factors are apparent. Repayment of interest and principal sums
in default or expected to be in default upon maturity |
Limited with full
security |
|
<10 |
C |
Absolute credit risk exists. Caution needed to be exercised |
Credit not
recommended |
|
-- |
NB |
New Business |
-- |
This score serves as a reference to assess SC’s credit risk and
to set the amount of credit to be extended. It is calculated from a composite
of weighted scores obtained from each of the major sections of this report. The
assessed factors and their relative weights (as indicated through %) are as
follows:
Financial
condition (40%) Ownership
background (20%) Payment
record (10%)
Credit history
(10%) Market trend
(10%) Operational
size (10%)
This report is issued at your request without any
risk and responsibility on the part of MIRA INFORM PRIVATE LIMITED (MIPL)
or its officials.