MIRA
INFORM REPORT
|
Report Date : |
23.08.2014 |
IDENTIFICATION DETAILS
|
Name : |
BHARAT HEAVY ELECTRICALS LIMITED |
|
|
|
|
Registered
Office : |
BHEL House, Siri
Fort, |
|
|
|
|
Country : |
|
|
|
|
|
Financials (as
on) : |
31.03.2014 |
|
|
|
|
Date of
Incorporation : |
13.11.1964 |
|
|
|
|
Com. Reg. No.: |
55-004281 |
|
|
|
|
Capital
Investment / Paid-up Capital : |
Rs.4895.200 Millions |
|
|
|
|
CIN No.: [Company Identification
No.] |
L74899DL1964GOI004281 |
|
|
|
|
TAN No.: [Tax Deduction
& Collection Account No.] |
DELB06995C / DELB01364G / DELB01591C / DELB05940E |
|
|
|
|
PAN No.: [Permanent
Account No.] |
AAACB4146P |
|
|
|
|
Legal Form : |
A Public Limited Liability company. The company’s Share are Listed on
the Stock Exchanges. |
|
|
|
|
Line of Business
: |
Design, engineering, manufacture, construction, testing, commissioning and servicing of a wide range of products and services for the core sectors of the economy, viz. Power, Transmission, Industry, Transportation (Railway), Renewable Energy, Oil and Gas and Defence. |
|
|
|
|
No. of Employees
: |
47,525 (Approximately) |
RATING & COMMENTS
|
MIRA’s Rating : |
Aa (72) |
|
RATING |
STATUS |
PROPOSED CREDIT LINE |
|
|
71-85 |
Aa |
Possesses adequate working capital. No caution needed for credit
transaction. It has above average (strong) capability for payment of interest
and principal sums |
Large |
|
Maximum Credit Limit : |
USD 1321000000 |
|
|
|
|
Status : |
Good |
|
|
|
|
Payment Behaviour : |
Regular |
|
|
|
|
Litigation : |
Exist |
|
|
|
|
Comments : |
Subject is a leading player in India’s power and industrial electrical
equipment markets. It is a well-established company having fine track record. The rating reflects BHEL’s leading position in the power and
industrial electrical equipment markets in India marked by adequate liquidity
position and strong financial risk profile. Trade relations are reported as fair. Business is active. Payments are
reported to be regular and as per commitments. The company can be considered food for normal business dealings at
usual trade terms and conditions. |
NOTES:
Any query related to this report can be made
on e-mail : infodept@mirainform.com
while quoting report number, name and date.
ECGC Country Risk Classification List – June 1, 2014
|
Country Name |
Previous Rating (31.03.2014) |
Current Rating (01.06.2014) |
|
India |
A1 |
A1 |
|
Risk Category |
ECGC
Classification |
|
Insignificant |
A1 |
|
Low |
A2 |
|
Moderate |
B1 |
|
High |
B2 |
|
Very High |
C1 |
|
Restricted |
C2 |
|
Off-credit |
D |
INDIAN ECONOMIC OVERVIEW
N E W S
As per the latest IMF study, the total weigh of emerging markets in the
GDP of the world on a purchasing power parity basis has seen a sizeable shift.
It highlights how as against 51 % in 2005, the emerging economies now account
for close to 56 % of the global purchasing power GDP as per the latest survey.
And with the emerging economies growing at a faster rate than their developed
counterparts, there are every possibility that the their share goes up further
in the coming years. China may surpass the US over the next few years.
Politics and economics are very intricately connected. They tend to
influence each other in ways that could be very complex and far-reaching. The
prospects of the India’s economy have been seriously compromised due to
political corruption. High inflation, poor standard of living are to a great
extent a result of rampant corruption in the country. China on the other hand,
seems to be facing diametrically opposite challenge. American hedge fund manager
Jim Chanos has been keenly following the political and economic development in
the dragon economy and has figured out something that is quite worrying. He is
of the view that the Chinese economy could be heading toward trouble on account
of new Chinese President Xi Jingping’s very aggressive anti-corruption drive.
Chanos believes tat many things such as apartment sales, luxury products, etc.
were largely bought with dirty money. And it is now beginning to impact
consumption. This may indeed be bad news for an economy that is struggling to
transition from an investment-driven export-oriented economy to a domestic
consumption-driven economy.
A study published by Firstpost has revealed that asset classes like real
estate and equities were the biggest beneficiaries of the liberalization
policies. A firm called Ciane Analytics studied returns from assets
including equities, gold, fixed deposits, G-Secs and real estate since 1991.
Real estate outperformed every other asset classes during the 23-year period with
an annualized return of 20 % ! Equities came in second with annualized return
of 15.5 % ! However, while these returns may seem mouthwatering, the fact is
that the return from equities adjusted for inflation came down to just 7.1 %.
Some brief news are as under
. R-Power to buy Jaypee’s hydro assets
. Investors await justice in NSEL case
. India seeks MFN status from Pakistan ahead of meeting
. Ukrain’s clashes with rebels hinder MH17 crash investigation
. India exploring merger of state-owned hydro PSUs
..Higher costs weigh down profit growth to slowest in 9 quarters
..Wal-Mart to expand wholesale business in India
. GMR group moves to strengthen balance sheet
. Central Bank to sell 4 % stake to Life Insurance Corporation
. Tata Chemicals plans to raise up to Rs 10000 mn.
EXTERNAL AGENCY RATING
|
Rating Agency Name |
CRISIL |
|
Rating |
Long term rating = AAA |
|
Rating Explanation |
Highest degree of safety and lowest credit risk. |
|
Date |
14.07.2014 |
|
Rating Agency Name |
CRISIL |
|
Rating |
Short term rating = A1+ |
|
Rating Explanation |
Very strong degree of safety and lowest credit risk. |
|
Date |
14.07.2014 |
RBI DEFAULTERS’ LIST STATUS
Subject’s name is not enlisted as a defaulter in
the publicly available RBI Defaulters’ list.
EPF (Employee Provident Fund) DEFAULTERS’ LIST STATUS
Subject’s name is not enlisted as a defaulter
in the publicly available EPF (Employee Provident Fund) Defaulters’ list as of
31-03-2014.
INFORMATION DENIED
Management non-Cooperative (91-40-23183585)
LOCATIONS
|
Registered Office : |
BHEL House, Siri Fort, New Delhi – 110049,
India |
|
Tel. No.: |
91-11-66337000 (Multiple Lines) |
|
Fax No.: |
91-11-26493021 / 26492534 |
|
E-Mail : |
|
|
Website : |
|
|
|
|
|
Head Office : |
17, Rajasthan
Voyoc Nagar, G.T. Kanal Road, Delhi, India |
|
|
|
|
Branch Office 1: |
Ramchandrapuram, Hyderabad – 502032, Andhra Pradesh, India |
|
|
|
|
Branch Office 2: |
Piping Centre , 80, G. N. Chetty Road, Chennai-600017,
Tamilnadu, India |
|
|
|
|
Plant Location : |
|
|
|
|
|
BHEL Manufacturing Units : |
Bangalore ·
Electronic Division, PB No. 2606, Mysore Road,
Bangalore – 560026, Karnataka, India ·
Electronics Systems Division ·
Electro Porcelain Division Bhopal ·
Heavy Electrical Plant Goindwal ·
Industrial Valves Plant Haridwar ·
Heavy Electrical Equipment Plant ·
Central Foundry Forge Plant Hyderabad ·
Heavy Power Equipment Plant Jagdishpur ·
Insulator Plant ·
Centralised Stamping Unit P.O. BHEL,
Jhansi – 284129, Uttar Pradesh, India ·
Transformer Plant Rudrapur ·
Components Fabrication Plant Ranipet ·
Boiler Auxiliaries Plant Tiruchirappalli ·
High Pressure Boiler Plant ·
Seamless Steel Tube Plant Thirumayam ·
Power Plant Piping Unit |
|
|
|
|
BHEL Repairs units : |
Mumbai ·
Electrical Machine Repair Plant Varanasi ·
Heavy Equipment Repair Plant |
|
|
|
|
BHEL Subsidiaries : |
Visakhapatnam ·
Bharat Heavy Plate and Vessels Limited Kasaragod ·
BHEL Electrical Machine Limited |
DIRECTORS
AS ON 31.03.2014
|
Name : |
Ms. Harinder Hira |
|
Designation : |
Part-time Non-official Director |
|
|
|
|
Name : |
Shri B. Prasada Rao |
|
Designation : |
Chairman & Managing Director |
|
|
|
|
Name : |
Shri S.K. Bahri |
|
Designation : |
Additional Secretary & Financial Adviser, DIPP |
|
|
|
|
Name : |
Shri R. Krishnan |
|
Designation : |
Director (Human Resource) |
|
|
|
|
Name : |
Shri W.V.K. Krishna Shankar |
|
Designation : |
Director (Industrial Systems & Products) |
|
|
|
|
Name : |
Shri Ambuj Sharma |
|
Designation : |
Additional Secretary, DHI |
|
|
|
|
Name : |
Shri P.K. Bajpai |
|
Designation : |
Director (Finance) |
|
|
|
|
Name : |
Shri Atul Sobti |
|
Designation : |
Director (Power) |
|
|
|
|
Name : |
Shri I.P. Singh |
|
Designation : |
Company Secretary |
KEY EXECUTIVES
|
MANAGEMENT
COMMITTEE |
|
|
|
|
|
Name : |
B. Prasada Rao |
|
Designation : |
CMD |
|
|
|
|
Name : |
P. K. Bajpai |
|
Designation : |
Director (Finance) |
|
|
|
|
Name : |
R. Krishnan |
|
Designation : |
Director (HR) |
|
|
|
|
Name : |
W.V.K. Krishna Shankar |
|
Designation : |
Director (IS&P) |
|
|
|
|
Name : |
Atul Sobti |
|
Designation : |
Director (Power) |
|
|
|
|
Name : |
A.V. Krishnan |
|
Designation : |
ED (Trichy) |
|
|
|
|
Name : |
Jainender Kumar |
|
Designation : |
ED (PMG) |
|
|
|
|
Name : |
B. Shankar |
|
Designation : |
ED (HR&CC) |
|
|
|
|
Name : |
T.N. Veeraraghavan |
|
Designation : |
ED (Ranipet) |
|
|
|
|
Name : |
S.C. Mittal |
|
Designation : |
ED (Finance & CCG) |
|
|
|
|
Name : |
K.C. Ramamurthy |
|
Designation : |
ED (EDN) |
|
|
|
|
Name : |
A.K. Dave |
|
Designation : |
ED (CMT&IP, MON & MM) |
|
|
|
|
Name : |
C.K. Shrikhande |
|
Designation : |
ED (PSNR) |
|
|
|
|
Name : |
S. Gopinath |
|
Designation : |
ED (Thirumayam & PC) |
|
|
|
|
Name : |
Rajiv Puri |
|
Designation : |
ED (PEM & ISG) |
|
|
|
|
Name : |
S.R. Prasad |
|
Designation : |
ED (Bhopal) |
|
|
|
|
Name : |
N. Ravi Chander |
|
Designation : |
ED (HPEP, Hyderabad) |
|
|
|
|
Name : |
Anuj Bhatnagar |
|
Designation : |
ED (FQA & Safety) |
|
|
|
|
Name : |
Prakash Chand |
|
Designation : |
ED (HEEP, Haridwar) |
|
|
|
|
Name : |
Akhil Joshi |
|
Designation : |
ED (TL&JV, M&A) |
|
|
|
|
Name : |
Dr. S. Sekar |
|
Designation : |
ED (Corp. R&D) |
|
|
|
|
Name : |
S.V.S. Narayana |
|
Designation : |
ED (CFFP, Haridwar) |
|
|
|
|
Name : |
Rajeev Srivastava |
|
Designation : |
ED (SSBG) |
|
|
|
|
Name : |
V. Venkata Krishnan |
|
Designation : |
ED (PSMktg.) |
|
|
|
|
Name : |
S.C. Jain |
|
Designation : |
ED (PSWR) |
|
|
|
|
Name : |
K. Rajendran, ED |
|
Designation : |
(Coordination) |
|
|
|
|
Name : |
K.K. Seth |
|
Designation : |
ED (HRDI, NIC & CPG) |
|
|
|
|
Name : |
Ramesh Koul |
|
Designation : |
ED (TBG) |
|
|
|
|
Name : |
B.S. Vishwanatha |
|
Designation : |
ED (TSG) |
|
|
|
|
Name : |
Devendra Raina |
|
Designation : |
ED (IPE & IPM) |
|
|
|
|
Name : |
S.N. Maiti |
|
Designation : |
ED (PSTS) |
|
|
|
|
Name : |
M.K. Sharma |
|
Designation : |
ED (PE&SD) |
|
|
|
|
Name : |
Pradeep Singhal |
|
Designation : |
ED (CSR, HSE & Admn) |
|
|
|
|
Name : |
L.K. Rawal |
|
Designation : |
ED (P&D) |
|
|
|
|
Name : |
C.V.S.N. Murthy |
|
Designation : |
ED (Renewables & Water Business) |
|
|
|
|
Name : |
Amitabh Mathur |
|
Designation : |
ED (PSER) |
|
|
|
|
PERMANENT INVITEES |
|
|
|
|
|
Name : |
S. Raj Sabapathy |
|
Designation : |
I (ROD & CFP) |
|
|
|
|
Name : |
R. Raghavan |
|
Designation : |
GM-I (ISG) |
|
|
|
|
Name : |
Kamalesh Das |
|
Designation : |
GM-I (CBU) |
|
|
|
|
Name : |
D. Bandyopadhyay |
|
Designation : |
GM-I (PSSR) |
|
|
|
|
Name : |
J. Sankaran |
|
Designation : |
GM-I (HPVP) |
|
|
|
|
Name : |
D. Guin |
|
Designation : |
GM-I (IO) |
|
|
|
|
Name : |
M. Khasgiwala |
|
Designation : |
GM-I (Jhansi) |
|
|
|
|
Name : |
K. Purswani |
|
Designation : |
GM-I (CQ) |
|
|
|
|
SECRETARY |
|
|
|
|
|
Name : |
K.S. Shivaprasad |
|
Designation : |
GM (P&D) |
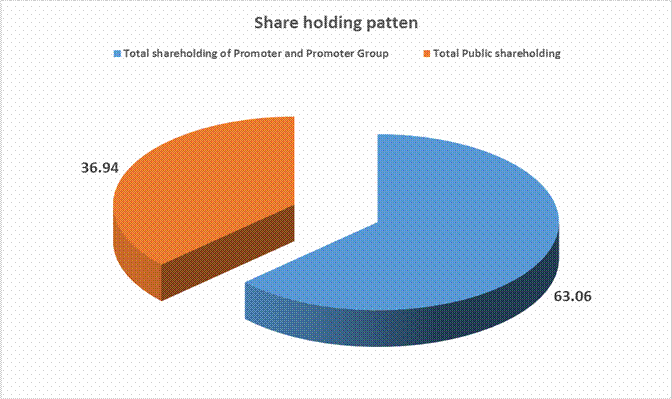
MAJOR SHAREHOLDERS
AS ON 30.06.2014
|
Category of
Shareholder |
No. of Shares |
Percentage of
Holding |
|
(A) Shareholding of Promoter and Promoter Group |
|
|
|
|
|
|
|
|
1543452000 |
63.06 |
|
|
1543452000 |
63.06 |
|
|
|
|
|
Total shareholding of Promoter and Promoter Group (A) |
1543452000 |
63.06 |
|
(B) Public Shareholding |
|
|
|
|
|
|
|
|
10471713 |
0.43 |
|
|
127521733 |
5.21 |
|
|
268675404 |
10.98 |
|
|
389230043 |
15.90 |
|
|
795898893 |
32.52 |
|
|
|
|
|
|
30040279 |
1.23 |
|
|
|
|
|
|
67899725 |
2.77 |
|
|
1762885 |
0.07 |
|
|
8546218 |
0.35 |
|
|
3600 |
0.00 |
|
|
1285911 |
0.05 |
|
|
2286077 |
0.09 |
|
|
4969880 |
0.20 |
|
|
750 |
0.00 |
|
|
108249107 |
4.42 |
|
Total Public shareholding (B) |
904148000 |
36.94 |
|
Total (A)+(B) |
2447600000 |
100.00 |
|
(C) Shares held by Custodians and against which Depository
Receipts have been issued |
0 |
0.00 |
|
|
0 |
0.00 |
|
|
0 |
0.00 |
|
|
0 |
0.00 |
|
Total (A)+(B)+(C) |
2447600000 |
0.00 |
BUSINESS DETAILS
|
Line of Business : |
Design, engineering, manufacture, construction, testing, commissioning and servicing of a wide range of products and services for the core sectors of the economy, viz. Power, Transmission, Industry, Transportation (Railway), Renewable Energy, Oil and Gas and Defence. |
||||||||
|
|
|
||||||||
|
Products : |
|
GENERAL INFORMATION
|
No. of Employees : |
47,525 (Approximately) |
|||||||||||||||||||||||||||
|
|
|
|||||||||||||||||||||||||||
|
Bankers : |
·
Allahabad Bank ·
Andhra Bank ·
Bank of Baroda ·
Canara Bank ·
Corporation Bank ·
Central Bank ·
Indian Bank ·
Indian Oversea Bank ·
Oriental Bank of Commerce ·
Punjab National Bank ·
Punjab & Sindh Bank ·
State Bank of India ·
State Bank of Hyderabad ·
Syndicate Bank ·
State Bank of Travancore ·
UCO Bank ·
Union Bank of India ·
United Bank of India ·
Vijaya Bank ·
IDBI Bank ·
CITI Bank N.A ·
Deutsche Bank AG ·
The Hongkong and Shanghai Banking
Corporation Ltd. ·
Standard Chartered Bank ·
The Royal Bank of Scotland N.V. ·
J P Morgan ·
Axis Bank ·
The Federal Bank Limited ·
HDFC ·
Kotak Mahindra Bank ·
ICICI Bank ·
Indusind Bank ·
Yes Bank |
|||||||||||||||||||||||||||
|
|
|
|||||||||||||||||||||||||||
|
Facilities : |
|
|
|
|
|
Banking
Relations : |
-- |
|
|
|
|
|
|
|
Auditors
: |
·
S.N. Dhawan and Company Chartered Accountants New Delhi, India ·
Wahi and Gupta Chartered Accountants New Delhi, India ·
Vinay Kumar and Company Chartered Accountants Allahabad, Uttar Pradesh,
India ·
Anjaneyulu and Company Chartered Accountants Hyderabad, Andhra Pradesh,
India ·
Vardhaman and Company Chartered Accountants Trichy, Tamilnadu, India ·
Patel Mohan Ramesh and Company, Chartered Accountants Bangalore, Karnataka, India ·
SBA and Company Chartered Accountants Bhopal, Madhya Pradesh, India ·
J. V. Ramanujam and Company Chartered Accountants Chennai, Tamilnadu, India |
|
|
|
|
Cost Auditors : |
·
Jugal K. Puri and Associates Chartered Accountants New Delhi, India ·
K.L. Jaisingh and Company Chartered Accountants Noida, India Narsimha Murthy and Company Chartered Accountants Hyderabad, Andhra Pradesh,
India ·
RKMS and Associates Chartered Accountants Chennai, Tamilnadu, India ·
Vishwanath Bhat and Company Chartered Accountants Bangalore, Karnataka, India ·
Sunil Singh and Company Chartered Accountants Lucknow, Uttar Pradesh, India ·
Sanjay Kasliwal and Associates Chartered Accountants Bhopal, Madhya Pradesh, India ·
Velamarthi and Associates Chartered Accountants Visakhapatnam, Andhra Pradesh,
India |
|
|
|
|
Joint Ventures : |
·
Powerplant Performance Improvement
Limited ·
BHEL-GE Gas Turbine Services Private
Limited ·
NTPC-BHEL Power Projects Private
Limited ·
Raichur Power Corporation Limited ·
Dada Dhuniwale Khandwa Power Limited ·
Latur Power Company Limited |
CAPITAL STRUCTURE
AS ON 31.03.2014
Authorised Capital :
|
No. of Shares |
Type |
Value |
Amount |
|
|
|
|
|
|
10000000000 |
Equity Shares |
Rs.2/- each |
Rs.20000.000 Millions |
|
|
|
|
|
Issued, Subscribed & Paid-up Capital :
|
No. of Shares |
Type |
Value |
Amount |
|
|
|
|
|
|
2447600000 |
Equity Shares |
Rs.2/- each |
Rs.4895.200
Millions |
|
|
|
|
|
a)
The reconciliation
of the number of equity shares outstanding is set out below:
|
Equity Shares |
Number
of Shares |
Rs.
In Millions |
|
Shares outstanding at the beginning of the year |
2447600000 |
4895.200 |
|
Shares bought back during the year |
-- |
-- |
|
Shares outstanding at the end of the year |
2447600000 |
4895.200 |
b)
Details
of shares held by shareholders holding more than 5% shares at the year-end:
|
Name of Shareholder |
Number of Shares |
% holding |
|
President of India (POI) along with nominees |
1543452000 |
63.06% |
|
Life Insurance Corporation of India |
242890195 |
9.92% |
|
Face Value per share |
|
2.00 |
c)
Terms
/ rights attached to the equity shares:
The company
has only one class of equity shares having par value of Rs.2 per share (previous year Rs.2
per share). Each holder of the equity shares is entitled to one vote per share.
d)
4.66% of BHEL’s total paid up equity
share capital (11,41,00,000 shares) were sold by Government of India through
Block Deal to Life Insurance Corporation of India on 03.03.2014.
FINANCIAL DATA
[all figures are
in Rupees Millions]
ABRIDGED BALANCE
SHEET
|
SOURCES OF FUNDS |
31.03.2014 |
31.03.2013 |
31.03.2012 |
|
I.
EQUITY
AND LIABILITIES |
|
|
|
|
(1)Shareholders' Funds |
|
|
|
|
(a) Share Capital |
4895.200 |
4895.200 |
4895.200 |
|
(b) Reserves & Surplus |
325575.300 |
299545.800 |
248836.900 |
|
(c) Money
received against share warrants |
0.000 |
0.000 |
0.000 |
|
|
|
|
|
|
(2) Share Application money pending allotment |
0.000 |
0.000 |
0.000 |
|
Total
Shareholders’ Funds (1) + (2) |
330470.500 |
304441.000 |
253732.100 |
|
|
|
|
|
|
(3)
Non-Current Liabilities |
|
|
|
|
(a) long-term borrowings |
1047.700 |
1292.000 |
1234.300 |
|
(b) Deferred tax liabilities (Net) |
0.000 |
0.000 |
0.000 |
|
(c) Other long term liabilities |
66001.700 |
57896.800 |
75585.900 |
|
(d) long-term provisions |
74964.300 |
59440.200 |
50056.800 |
|
Total Non-current Liabilities (3) |
142013.700 |
118629.000 |
126877.000 |
|
|
|
|
|
|
(4) Current Liabilities |
|
|
|
|
(a) Short term borrowings |
25500.000 |
12860.000 |
0.000 |
|
(b) Trade payables |
87190.200 |
96751.800 |
102548.200 |
|
(c) Other current
liabilities |
114441.400 |
138623.700 |
158246.000 |
|
(d) Short-term provisions |
28295.900 |
29981.100 |
26356.900 |
|
Total Current Liabilities (4) |
255427.500 |
278216.600 |
287151.100 |
|
|
|
|
|
|
TOTAL |
727911.700 |
701286.600 |
667760.200 |
|
|
|
|
|
|
II.
ASSETS |
|
|
|
|
(1) Non-current assets |
|
|
|
|
(a) Fixed Assets |
|
|
|
|
(i) Tangible assets |
45251.300 |
43146.700 |
41607.200 |
|
(ii) Intangible Assets |
1678.100 |
1438.200 |
1360.900 |
|
(iii) Capital
work-in-progress |
6220.100 |
11335.100 |
13246.300 |
|
(iv)
Intangible assets under development |
201.100 |
380.800 |
229.800 |
|
(b) Non-current Investments |
4201.700 |
4291.700 |
4616.700 |
|
(c) Deferred tax assets (net) |
19689.500 |
15506.900 |
15462.400 |
|
(d) Long-term Loan and Advances |
11671.400 |
9055.400 |
9001.000 |
|
(e) Other Non-current assets |
118810.700 |
106537.200 |
93836.200 |
|
Total Non-Current Assets |
207723.900 |
191692.000 |
179360.500 |
|
|
|
|
|
|
(2) Current assets |
|
|
|
|
(a) Current investments |
0.000 |
0.000 |
0.000 |
|
(b) Inventories |
97975.500 |
117638.200 |
135487.300 |
|
(c) Trade receivables |
280719.200 |
292344.900 |
263569.300 |
|
(d) Cash and cash
equivalents |
118729.300 |
77320.500 |
66719.800 |
|
(e) Short-term loans and
advances |
20238.600 |
20291.200 |
21117.200 |
|
(f) Other current assets |
2525.200 |
1999.800 |
1506.100 |
|
Total Current Assets |
520187.800 |
509594.600 |
488399.700 |
|
|
|
|
|
|
TOTAL |
727911.700 |
701286.600 |
667760.200 |
PROFIT & LOSS
ACCOUNT
|
|
PARTICULARS |
31.03.2014 |
31.03.2013 |
31.03.2012 |
|
|
|
SALES |
|
|
|
|
|
|
|
Income |
383888.200 |
476176.700 |
472278.600 |
|
|
|
Interest and Other Income |
23360.400 |
19286.900 |
20165.800 |
|
|
|
TOTAL |
407248.600 |
495463.600 |
492444.400 |
|
|
|
|
|
|
|
|
Less |
EXPENSES |
|
|
|
|
|
|
|
Consumption of Material Consumed |
220990.800 |
278993.700 |
289077.300 |
|
|
|
(Increase)/Decrease
in work in progress and finished goods |
10574.000 |
1162.100 |
(8232.000) |
|
|
|
Employees remuneration and benefit
|
59337.800 |
57527.800 |
54658.300 |
|
|
|
Other Expenses of Manufacture, Administration, Selling and
Distribution |
33085.000 |
37765.600 |
32228.200 |
|
|
|
Provision Net |
22587.000 |
15657.700 |
14025.800 |
|
|
|
Cost of Jobs Done for Internal Use |
(684.600) |
(758.700) |
(1041.100) |
|
|
|
Prior Period Items (Net) |
60.100 |
4.400 |
192.500 |
|
|
|
TOTAL |
345950.100 |
390352.600 |
380909.000 |
|
|
|
|
|
|
|
|
|
PROFIT
BEFORE INTEREST, TAX, DEPRECIATION AND AMORTISATION |
61298.500 |
105111.000 |
111535.400 |
|
|
|
|
|
|
|
|
|
Less |
INTEREST AND
OTHER BORROWING COST |
1326.300 |
1252.700 |
512.800 |
|
|
|
|
|
|
|
|
|
|
PROFIT
BEFORE TAX, DEPRECIATION AND AMORTISATION |
59972.200 |
103858.300 |
111022.600 |
|
|
|
|
|
|
|
|
|
Less |
DEPRECIATION/
AMORTISATION |
9829.200 |
9533.900 |
8000.000 |
|
|
|
|
|
|
|
|
|
|
PROFIT BEFORE
TAX |
50143.000 |
94324.400 |
103022.600 |
|
|
|
|
|
|
|
|
|
Less |
TAX |
15535.200 |
28177.100 |
32623.000 |
|
|
|
|
|
|
|
|
|
|
PROFIT AFTER TAX |
34607.800 |
66147.300 |
70399.600 |
|
|
|
|
|
|
|
|
|
Add |
PREVIOUS
YEARS’ BALANCE BROUGHT FORWARD |
11021.200 |
10312.300 |
8125.900 |
|
|
|
|
|
|
|
|
|
Add |
ADJUSTMENT OF DEBIT BALANCE OF PROFIT AND LOSS
ACCOUNT UPTO 30.09.2011 PURSUANT TO AMALGAMATION |
(2780.500) |
0.000 |
0.000 |
|
|
|
|
|
|
|
|
|
Add |
ADJUSTMENT PURSUANT TO AMALGAMATION FOR PROFIT
DURING THE PERIOD FROM 01.10.2011 TO 31.03.2013 |
599.500 |
0.000 |
0.000 |
|
|
|
|
|
|
|
|
|
Add |
ADJUSTMENT FOR PROVISION FOR TAX AND DEFERRED TAX
ON AMALGAMATION |
1368.500 |
0.000 |
0.000 |
|
|
|
|
|
|
|
|
|
Less |
APPROPRIATIONS |
|
|
|
|
|
|
|
Transfer to General Reserve |
25000.000 |
50000.000 |
50000.000 |
|
|
|
Dividend |
6926.800 |
13230.000 |
15670.000 |
|
|
|
Tax on Dividend |
1177.200 |
2208.400 |
2540.000 |
|
|
BALANCE CARRIED
TO THE B/S |
11712.500 |
11021.200 |
10315.500 |
|
|
|
|
|
|
|
|
|
|
EARNINGS IN
FOREIGN CURRENCY |
|
|
|
|
|
|
|
Export of Goods |
13584.100 |
4386.800 |
10065.300 |
|
|
|
Interest |
0.000 |
0.000 |
0.300 |
|
|
|
Election and Other Services |
2501.600 |
1431.200 |
4770.100 |
|
|
|
FE in Deemed Export (Including domestic contracts and SEZ) |
71691.700 |
117747.900 |
129355.800 |
|
|
TOTAL EARNINGS |
87777.400 |
123565.900 |
144191.500 |
|
|
|
|
|
|
|
|
|
|
IMPORTS |
|
|
|
|
|
|
|
Raw Materials |
22486.700 |
30425.100 |
48842.700 |
|
|
|
Components & Spares Parts |
40131.000 |
32454.100 |
40493.300 |
|
|
|
Capital Goods |
853.000 |
3198.600 |
4012.500 |
|
|
TOTAL IMPORTS |
63470.700 |
66077.800 |
93348.500 |
|
|
|
|
|
|
|
|
|
|
Earnings Per
Share (Rs.) |
14.14 |
27.03 |
28.76 |
|
QUARTERLY
RESULTS:
(Rs.
In Millions)
|
Particulars |
Jun 2014 |
|
Unaudited |
|
|
Net Sales |
51549.700 |
|
Total Expenditure |
49370.500 |
|
PBIDT (Excl OI) |
2179.200 |
|
Other Income |
3477.900 |
|
Operating Profit |
5657.100 |
|
Interest |
472.700 |
|
Exceptional Items |
0.000 |
|
PBDT |
5184.400 |
|
Depreciation |
2725.400 |
|
Profit Before Tax |
2459.000 |
|
Tax |
524.000 |
|
Provisions and contingencies |
0.000 |
|
Profit After Tax |
1935.000 |
KEY RATIOS
|
PARTICULARS |
|
31.03.2014 |
31.03.2013 |
31.03.2012 |
|
PAT / Total Income |
(%) |
8.50 |
13.35 |
14.30 |
|
|
|
|
|
|
|
Net Profit Margin (PBT/Sales) |
(%) |
13.06 |
19.81 |
21.81 |
|
|
|
|
|
|
|
Return on Total Assets (PBT/Total Assets} |
(%) |
7.19 |
14.08 |
16.24 |
|
|
|
|
|
|
|
Return on Investment (ROI) (PBT/Networth) |
|
0.15 |
0.31 |
0.41 |
|
|
|
|
|
|
|
Debt Equity Ratio (Total Debt /Networth) |
|
0.08 |
0.05 |
0.00 |
|
|
|
|
|
|
|
Current Ratio (Current Asset/Current Liability) |
|
2.04 |
1.83 |
1.70 |
FINANCIAL ANALYSIS
[all figures are
in Rupees Millions]
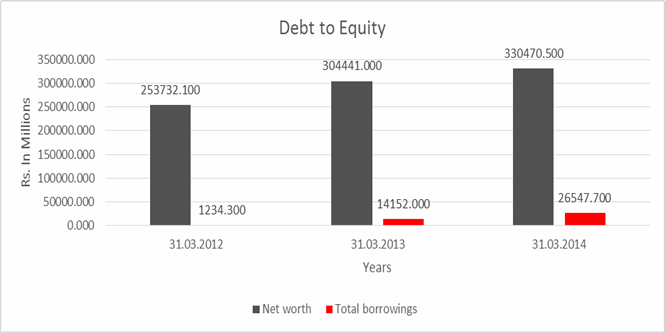
DEBT EQUITY RATIO
|
Particular |
31.03.2012 |
31.03.2013 |
31.03.2014 |
|
|
Rs.
In Millions |
Rs. In
Millions |
Rs.
In Millions |
|
Share Capital |
4895.200 |
4895.200 |
4895.200 |
|
Reserves & Surplus |
248836.900 |
299545.800 |
325575.300 |
|
Net
worth |
253732.100 |
304441.000 |
330470.500 |
|
|
|
|
|
|
long-term borrowings |
1234.300 |
1292.000 |
1047.700 |
|
Short term borrowings |
0.000 |
12860.000 |
25500.000 |
|
Total
borrowings |
1234.300 |
14152.000 |
26547.700 |
|
Debt/Equity
ratio |
0.005 |
0.046 |
0.080 |
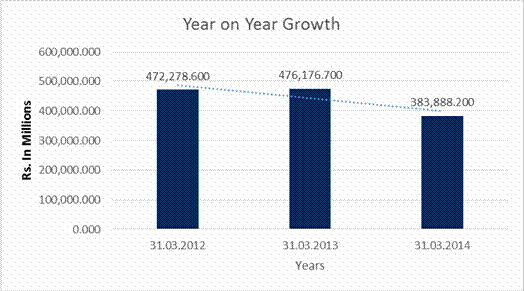
YEAR-ON-YEAR GROWTH
|
Year
on Year Growth |
31.03.2012 |
31.03.2013 |
31.03.2014 |
|
|
Rs.
In Millions |
Rs.
In Millions |
Rs.
In Millions |
|
Sales |
472,278.600 |
476,176.700 |
383,888.200 |
|
|
|
0.825 |
(19.381) |
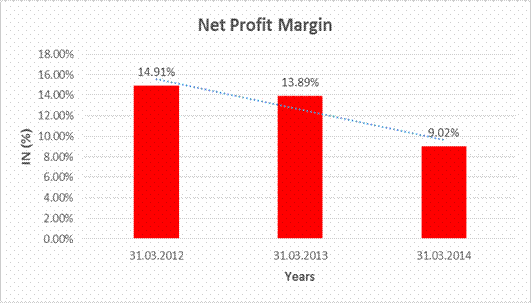
NET PROFIT MARGIN
|
Net
Profit Margin |
31.03.2012 |
31.03.2013 |
31.03.2014 |
|
|
Rs. In
Millions |
Rs.
In Millions |
Rs.
In Millions |
|
Sales
|
472,278.600 |
476,176.700 |
383,888.200 |
|
Profit |
70,399.600 |
66,147.300 |
34,607.800 |
|
|
14.91% |
13.89% |
9.02% |
LOCAL AGENCY FURTHER INFORMATION
|
Sr. No. |
Check List by Info Agents |
Available in
Report (Yes / No) |
|
1] |
Year of Establishment |
Yes |
|
2] |
Locality of the firm |
Yes |
|
3] |
Constitutions of the firm |
Yes |
|
4] |
Premises details |
No |
|
5] |
Type of Business |
Yes |
|
6] |
Line of Business |
Yes |
|
7] |
Promoter's background |
Yes |
|
8] |
No. of employees |
Yes |
|
9] |
Name of person contacted |
No |
|
10] |
Designation of contact
person |
No |
|
11] |
Turnover of firm for last
three years |
Yes |
|
12] |
Profitability for last
three years |
Yes |
|
13] |
Reasons for variation
<> 20% |
----------- |
|
14] |
Estimation for coming
financial year |
No |
|
15] |
Capital in the business |
Yes |
|
16] |
Details of sister
concerns |
Yes |
|
17] |
Major suppliers |
No |
|
18] |
Major customers |
No |
|
19] |
Payments terms |
No |
|
20] |
Export / Import details
(if applicable) |
No |
|
21] |
Market information |
---------- |
|
22] |
Litigations that the firm
/ promoter involved in |
Yes |
|
23] |
Banking Details |
Yes |
|
24] |
Banking facility details |
Yes |
|
25] |
Conduct of the banking
account |
---------- |
|
26] |
Buyer visit details |
---------- |
|
27] |
Financials, if provided |
Yes |
|
28] |
Incorporation details, if
applicable |
Yes |
|
29] |
Last accounts filed at
ROC |
Yes |
|
30] |
Major Shareholders, if available |
Yes |
|
31] |
Date of Birth of
Proprietor/Partner/Director, if available |
No |
|
32] |
PAN of
Proprietor/Partner/Director, if available |
No |
|
33] |
Voter ID No of
Proprietor/Partner/Director, if available |
No |
|
34] |
External Agency Rating, if
available |
Yes |
LITIGATION
DETAILS:
|
IN
THE HIGH COURT OF DELHI AT NEW DELHI versus |
MANAGEMENT
DISCUSSION AND ANALYSIS
ECONOMIC AND BUSINESS OVERVIEW
The Capital
Goods industry being the “mother” of all manufacturing industry is extremely
crucial for the development of the country’s economy. The capital goods (CG)
sector is highly diverse with a large variety of industrial equipment,
products, and services, including those used for agriculture, construction, and
transportation, as well as production of energy and power generation, building
and plant infrastructure, and general manufacturing. It is also considered as a
strategic sector and development of domestic capabilities is paramount from a
national self-reliance and security perspective. Indian capital goods industry
contributes 12% to the total manufacturing activity (which is about 15% of the
GDP) in the country.
Demand
for capital goods is sensitive to fluctuations of business confidence and
correlates with economic swings. The global capital goods industry which is
export-driven was severely affected by recession post 2008. Economy of India
that is now largely integrated with the world has been affected by global and
domestic factors. With almost all major customers of the capital goods sector,
such as power, oil and gas, metals and cement operating at subdued capacities,
the CG industry is experiencing manufacturing capacity underutilization, pricing
pressure and dwindling order book in recent years.
Today,
Global economy is expanding at sluggish pace but is running above the
post-crisis average.
On the
current reckoning, global growth is likely to be in the vicinity of 3½ per cent
in 2014, about ½ a percentage point higher than in 2013 as per estimates of
RBI. Key industry indicators, such as industrial production and non-residential
construction, point to a modest uptick in growth for global capital goods
companies during 2014. However, downside risks to growth trajectory arise from
ongoing tapering of quantitative easing in the US, continuing deflation
concerns and weak balance sheets in the euro area and, inflationary pressures
in the emerging market and developing economies. With weakening growth and
financial fragilities in China due to rapid credit in recent years, global
trade and growth are on the precipice of a large risk.
The
outlook for the Indian economy has improved with expected political stability,
cautiously positive business sentiments, improved consumer confidence,
expectations of a modest recovery in growth and decline in inflation
expectations.
The
real GDP behavior over the past three decades reinforces the cyclical behavior
of economic growth in India and this gives reasonable confidence for economic
recovery in near-term.
In the
long run, underlying trends such as urbanization, changing demography, energy
security, climate change and inclusive development in India and the global
movement toward energy efficient products and processes should help fuel demand
for capital goods in India.
INDEX OF CHARGE:
|
Sr. No. |
Charge ID |
Date of Charge
Creation/Modification |
Charge amount
secured |
Charge Holder |
Address |
Service Request
Number (SRN) |
|
1 |
90129433 |
06/04/1994 |
17,800,000.00 |
INDUSTRIAL
RECONSTRUCTION BANK OF INDIA |
19;
NETAJI SUBHAS ROAD, CALCUTTA, WEST BENGAL - 700001, INDIA |
- |
|
2 |
90041091 |
14/03/2014
* |
50,000,000,000.00 |
STATE
BANK OF INDIA |
CAG BRANCH,
JAWAHAR VYAPAR BHAWAN, 1, TOLSTOY MARG, NEW DELHI, DELHI - 110001, INDIA |
C00817239 |
|
3 |
80025169 |
14/03/2014
* |
500,000,000,000.00 |
STATE
BANK OF INDIA |
CAG
BRANCH, JAWAHAR VYAPAR BHAWAN, 1, TOLSTOY MARG, NEW DELHI, DELHI - 110001,
INDIA |
C00907972 |
|
4 |
90059992 |
05/02/1991 |
33,850,000.00 |
EXPORT
- IMPORT BANK OF INDIA |
POST
BAG NO. 16100; CENTRE ONE; 21 FLOOR, WORLD TRADE CENTRE; CUFFE PARADE,
BOMBAY, MAHARASHTRA - 400005, INDIA |
- |
|
5 |
90059987 |
18/01/1991 |
113,300,000.00 |
EXPORT
- IMPORT BANK OF INDIA |
POST
BAG NO. 16100; CENTRE ONE; 21 FLOOR, WORLD T |
- |
|
6 |
90059907 |
22/05/1990 |
34,600,000.00 |
EXPORT
- IMPORT BANK OF INDIA |
POST BAG
NO. 19969; MAKER CHAMBERS IV, 222; NARIMAN POINT, BOMBAY, MAHARASHTRA -
400021, INDIA |
- |
*Date of modification Charges
FINANCIAL
RESULTS FOR THE QUARTER ENDED 30TH JUNE 2014
(Rs. In Millions)
|
Particulars |
3
Months ended 30.06.2014 |
|
|
Unaudited |
|
1. Income from
operations |
|
|
a) Net sales/ Income from operation (net of excise duty) |
52772.000 |
|
Less: Excise Duty / Service Tax |
2096.000 |
|
Total income
from Operations(net) |
50676.000 |
|
Other Operating Income |
874.000 |
|
2.Expenditure |
|
|
a) Cost of material consumed |
32004.000 |
|
b) Changes in inventories of finished goods, work-in-progress and
stock-in-trade |
(6038.000) |
|
c) Employees benefit expenses |
15771.000 |
|
d) Depreciation and amortization expenses |
2725.000 |
|
e) Other expenditure |
7634.000 |
|
Total expenses |
52096.000 |
|
3. Profit from operations before other income and financial costs |
(546.000) |
|
4. Other income |
3478.000 |
|
5. Profit from ordinary activities before finance costs |
2932.000 |
|
6. Finance costs |
473.000 |
|
7. Net profit/(loss) from
ordinary activities after finance costs but before exceptional items |
2459.000 |
|
8. Exceptional item / Prior periods items) |
-- |
|
9. Profit from ordinary
activities before tax Expense: |
2459.000 |
|
10.Tax expenses |
|
|
Tax expense (incl. deferred tax) |
524.000 |
|
Tax (earlier years) |
-- |
|
11.Net Profit / (Loss) from ordinary activities
after tax (9-10) |
1935.000 |
|
12.Extraordinary Items (net
of tax expense) |
-- |
|
13.Net Profit / (Loss) for
the period (11 -12) |
1935.000 |
|
14.Paid-up
equity share capital (Nominal value Rs.10/- each) |
4895.000 |
|
15. Reserve excluding Revaluation Reserves as per balance sheet of
previous accounting year |
|
|
16.i) Earnings per share (before
extraordinary items) of Rs.10/- each) (not annualised): |
0.79 |
|
|
|
|
A. Particulars of
shareholding |
|
|
1. Public Shareholding |
|
|
- Number of shares |
904148000 |
|
- Percentage of shareholding |
36.94% |
|
2. Promoters and Promoters group Shareholding- |
|
|
a) Pledged /Encumbered |
|
|
Number of shares |
-- |
|
Percentage of shares (as a % of total shareholding of the promoter and
promoter group) |
-- |
|
Percentage of shares (as a % of total share capital of the company) |
-- |
|
|
|
|
b) Non Encumbered |
|
|
Number of shares |
1543452000 |
|
Percentage of shares (as a % of total shareholding of the promoter and
promoter group) |
100.00% |
|
Percentage of shares (as a % of total share capital of the company) |
63.06% |
|
|
|
|
B. Investor Complaints |
|
|
Pending at the beginning of the quarter |
-- |
|
Receiving during the quarter |
204.000 |
|
Disposed of during the quarter |
204.000 |
|
Remaining unreserved at the end of the quarter |
-- |
|
|
|
|
SEGMENT WIE REVENUE, RESULTS AND CAPITAL EMPLOYED |
|
|
1. Segment
Revenue |
|
|
Power |
41442.000 |
|
Industry |
11330.000 |
|
Total |
52772.000 |
|
Inter segmental revenue |
-- |
|
Sales / Income from operations |
52772.000 |
|
Segment Results (Profit before Tax & Interest) |
|
|
Power |
5250.000 |
|
Industry |
395.000 |
|
Total |
5645.000 |
|
Less: Interest |
473.000 |
|
Other unallocable expenditure net of income |
2713.000 |
|
Total Profit before Tax |
2459.000 |
|
Capital Employed |
|
|
(Segment Assets - Segment Liabilities) |
|
|
Power |
164212.000 |
|
Industry |
54040.000 |
|
Capital Employed (including unallocable common) |
324040.000 |
NOTES:
1.
The above results have been reviewed by
the Audit Committee comprising of one Independent director as its chairperson
and two Government director (instead of two independent director as required under
listing agreement), based on the present strength of the Board and were taken
on record by the Board of Directors in their meeting held on August 12, 2014.
2.
Pursuant to the guidelines under the
Schedule II of the Companies Act, 2013, the carrying amount of the assets as on
April 1, 2014 has been depreciated over the remaining revised useful life of
the fixed assets. Consequently the depreciation for the quarter ended June 30,
2014 is higher and the profit before tax is lower to the extent of Rs.269.400
Millions. Further an amount of Rs. 346.400 Millions (net of deferred tax of
Rs.178.300 Millions) representing the carrying amount of assets with revised
useful life as nil, has been charged to the opening reserves as on April 1,
2014.
3.
The Company has an outstanding order
book position of about Rs.974000.000 Millions as at the end of Qtr 1/2014-15.
4.
The above results have been reviewed by
the Auditors as per clause 41 of the listing agreement.
FIXED ASSETS:
· Freehold land (incl. development exp.)
· Leasehold land (incl. development exp.)
Roads, bridges and culverts
Buildings
Leasehold buildings
Drainage, sewerage and water supply
Railway siding
Locomotives and wagons
Plant and Machinery
Electronic data processing equipments
Electrical installations
Construction Equipment
Vehicles
Furniture and fixtures
Office and other equipments
Software
PRESS RELEASES
19-AUG-2014
BHEL ACHIEVES MAJOR BREAKTHROUGH BY DEVELOPING FUEL FLEXIBLE SUPERCRITICAL
BOILERS - A MAJOR STEP TOWARDS MANAGING THE UNCERTAINTIES REGARDING COAL
India’s Power Generation is mainly Coal based and the Power Sector
is currently plagued by Coal shortages where Power Plants are stranded due to
non-availability of Indigenous Coal supplies. This has triggered a series of
Companies to either resort to operating the plant on part load due to
non-availability of domestic coal or make up for the shortfall by blending
indigenous coal with imported coal. Being heterogeneous in nature, the
properties of Coal vary from source to source. The performance of Power
equipment is dependent on the coal being fed to the power plant.
Bharat Heavy Electricals Limited (BHEL), a Maharatna PSU,
has been designing boilers for the past 30 years and has extensive experience of
designing boilers fired with indigenous as well as imported coals exhibiting
wide variations in properties. Based on BHEL’s
extensive in-house experience of working with a great variety of indigenous as
well as imported coals over the years,BHEL has developed a new Boiler with Fuel
flexibility of Indigenous & Imported Coals. BHEL is now ready to offer the new boiler
design to overcome these issues.
This new boiler design is based on a unique combination of
indigenous and imported coals but is capable of firing both extremes of 100%
domestic coal as well as 100% imported coal. It will provide developers with
much needed freedom regarding the ratio of blending as well as the
characteristics of the domestic and imported coal to be blended. This enables
the boiler to work over the entire range of blending ratios and would protect
the project developer against the vagaries in coal availability, thereby
providing him with an opportunity to operate the plant throughout the year.
BHEL has an advanced state of
the art Coal Research Centre at its Tiruchirapally plant which will be used to
identify the unique combination of blended coal after carrying out the analysis
of imported and domestic coal samples supplied by the customers. The associated
boiler auxiliaries, also manufactured by BHEL,
will be designed to accommodate the variation during firing of different type
of fuels.
With this development, BHEL is being true to their vision
statement as a solution provider for better tomorrow in the energy sector by
addressing the major concern among Owners/ Developers about the growing
uncertainty of coal availability in the country.
Addressing today’s environment where thermal power plants are
starved for fuel and developers face severe uncertainties regarding the availability
of domestic and imported coals, BHEL’s
new design with fuel flexibility will be a major step forward in this
direction.
01-AUG-2014
BHEL COMMISSIONS FIFTH 68 MW HYDRO GENERATING UNIT AT RAMPUR HEP IN HIMACHAL
PRADESH
In quick succession, another hydro generating unit of 68 MW at
Rampur Hydro Electric Project (HEP) in Himachal Pradesh has been commissioned
by Bharat Heavy Electricals Limited (BHEL). With this, BHEL has successfully commissioned five
units of the 412 MW hydro power plant of SJVN Limited. The earlier four units
at Rampur HEP were commissioned between March 2014 and June 2014. All the four
have since been put into commercial operation. The sixth and last Unit is in an
advanced stage of execution and is likely to be commissioned by BHEL shortly.
Rampur HEP powerhouse is located on River Satluj, a major
tributary of the Indus Basin in Himachal Pradesh - 120 km from Shimla. BHEL’s scope of work in the
project includes supply, erection and commissioning of 6 numbers 68 MW Francis
turbines operating at a head of 119 meters with matching synchronous generators
of 200 rpm, static excitation system, main inlet valves, digital governors,
state-of-the-art control & monitoring system (SCADA), associated station
auxiliaries, Gas Insulated Switchgear (GIS) and electrical & mechanical
Balance of Plant (BoP).
BHEL has a long standing
association with SJVN Limited commencing with their first hydro generating
plant - 1,500 MW Nathpa Jhakri HEP, which was commissioned in 2003-04.
Notably, nine hydro sets totalling to 641 MW were commissioned by BHEL in the year 2013-14. Fiscal 2014-15 is
also progressing on a promising note for hydro projects, with the commissioning
of a 130 MW set at Parbati in May, 2014 and one 68 MW Unit of Rampur in June,
2014, now followed by another 68 MW unit at Rampur HEP. BHEL is presently executing Hydro power
projects of around 5,000 MW which are under various stages of implementation.
Significantly, so far, more than 500 hydro generating sets of
various ratings have been contracted on BHEL in India and abroad, with a cumulative
capacity of more than 26,000 MW, out of which, equipment for about 5,000 MW
generating capacity has been contracted outside India. In 2013-14, BHEL had secured the orders for 206 MW
Shahpur Kandi HEP in Punjab and 120 MW Vyasi HEP in Uttarakhand, against stiff
international competition.
BHEL has been committed to
the nation’s power development programme and has reaffirmed its commitment to
the Indian Power Sector by equipping itself by way of contemporary technology,
state-of-the-art manufacturing facilities and skilled technical manpower.
Responding to the growth in the nation's demand for power equipment, BHEL has enhanced its manufacturing
capacity to 20,000 MW per annum.
CMT REPORT (Corruption, Money Laundering & Terrorism]
The Public Notice information has been collected from various sources
including but not limited to: The Courts,
1] INFORMATION ON
DESIGNATED PARTY
No exist designating subject or any of its beneficial owners,
controlling shareholders or senior officers as terrorist or terrorist
organization or whom notice had been received that all financial transactions
involving their assets have been blocked or convicted, found guilty or against
whom a judgement or order had been entered in a proceedings for violating
money-laundering, anti-corruption or bribery or international economic or
anti-terrorism sanction laws or whose assets were seized, blocked, frozen or
ordered forfeited for violation of money laundering or international
anti-terrorism laws.
2] Court Declaration :
No exist to suggest that subject is or was
the subject of any formal or informal allegations, prosecutions or other
official proceeding for making any prohibited payments or other improper
payments to government officials for engaging in prohibited transactions or
with designated parties.
3] Asset Declaration :
No records exist to suggest that the property or assets of the subject are
derived from criminal conduct or a prohibited transaction.
4] Record on Financial
Crime :
Charges or conviction
registered against subject: None
5] Records on Violation of
Anti-Corruption Laws :
Charges or
investigation registered against subject: None
6] Records on Int’l
Anti-Money Laundering Laws/Standards :
Charges or
investigation registered against subject: None
7] Criminal Records
No
available information exist that suggest that subject or any of its principals
have been formally charged or convicted by a competent governmental authority
for any financial crime or under any formal investigation by a competent
government authority for any violation of anti-corruption laws or international
anti-money laundering laws or standard.
8] Affiliation with
Government :
No record
exists to suggest that any director or indirect owners, controlling
shareholders, director, officer or employee of the company is a government
official or a family member or close business associate of a Government
official.
9] Compensation Package :
Our market
survey revealed that the amount of compensation sought by the subject is fair
and reasonable and comparable to compensation paid to others for similar
services.
10] Press Report :
No press reports / filings exists on
the subject.
CORPORATE GOVERNANCE
MIRA INFORM as part of its Due Diligence do provide comments on
Corporate Governance to identify management and governance. These factors often
have been predictive and in some cases have created vulnerabilities to credit
deterioration.
Our Governance Assessment focuses principally on the interactions
between a company’s management, its Board of Directors, Shareholders and other
financial stakeholders.
CONTRAVENTION
Subject is not known to have contravened any existing local laws,
regulations or policies that prohibit, restrict or otherwise affect the terms
and conditions that could be included in the agreement with the subject.
FOREIGN EXCHANGE RATES
|
Currency |
Unit
|
Indian Rupees |
|
US Dollar |
1 |
Rs.60.44 |
|
|
1 |
Rs.100.24 |
|
Euro |
1 |
Rs.80.35 |
INFORMATION DETAILS
|
Information
Gathered by : |
GYT |
|
|
|
|
Analysis Done by
: |
KRN |
|
|
|
|
Report Prepared
by : |
NKT |
SCORE & RATING EXPLANATIONS
|
SCORE FACTORS |
RANGE |
POINTS |
|
HISTORY |
1~10 |
9 |
|
PAID-UP CAPITAL |
1~10 |
8 |
|
OPERATING SCALE |
1~10 |
8 |
|
FINANCIAL CONDITION |
|
|
|
--BUSINESS SCALE |
1~10 |
8 |
|
--PROFITABILIRY |
1~10 |
7 |
|
--LIQUIDITY |
1~10 |
8 |
|
--LEVERAGE |
1~10 |
8 |
|
--RESERVES |
1~10 |
8 |
|
--CREDIT LINES |
1~10 |
8 |
|
--MARGINS |
-5~5 |
-- |
|
DEMERIT POINTS |
|
|
|
--BANK CHARGES |
YES/NO |
YES |
|
--LITIGATION |
YES/NO |
YES |
|
--OTHER ADVERSE INFORMATION |
YES/NO |
NO |
|
MERIT POINTS |
|
|
|
--SOLE DISTRIBUTORSHIP |
YES/NO |
NO |
|
--EXPORT ACTIVITIES |
YES/NO |
NO |
|
--AFFILIATION |
YES/NO |
YES |
|
--LISTED |
YES/NO |
NO |
|
--OTHER MERIT FACTORS |
YES/NO |
YES |
|
DEFAULTER |
|
|
|
--RBI |
YES/NO |
NO |
|
--EPF |
YES/NO |
NO |
|
|
|
|
|
TOTAL |
|
72 |
This score serves as a reference to assess SC’s credit risk
and to set the amount of credit to be extended. It is calculated from a composite
of weighted scores obtained from each of the major sections of this report. The
assessed factors and their relative weights (as indicated through %) are as
follows:
Financial
condition (40%) Ownership
background (20%) Payment
record (10%)
Credit history
(10%) Market trend
(10%) Operational
size (10%)
RATING EXPLANATIONS
|
RATING |
STATUS |
PROPOSED CREDIT LINE |
|
|
>86 |
Aaa |
Possesses an extremely sound financial base with the strongest capability
for timely payment of interest and principal sums |
Unlimited |
|
71-85 |
Aa |
Possesses
adequate working capital. No caution needed for credit transaction. It has
above average (strong) capability for payment of interest and principal sums |
Large |
|
56-70 |
A |
Financial & operational base are regarded healthy. General
unfavourable factors will not cause fatal effect. Satisfactory capability for
payment of interest and principal sums |
Fairly Large |
|
41-55 |
Ba |
Overall operation is considered normal. Capable to meet normal
commitments. |
Satisfactory |
|
26-40 |
B |
Capability to overcome financial difficulties seems comparatively
below average. |
Small |
|
11-25 |
Ca |
Adverse factors are apparent. Repayment of interest and principal sums
in default or expected to be in default upon maturity |
Limited with
full security |
|
<10 |
C |
Absolute credit risk exists. Caution needed to be exercised |
Credit not
recommended |
|
NB |
NEW BUSINESS |
||
This report is issued at your request without any
risk and responsibility on the part of MIRA INFORM PRIVATE LIMITED (MIPL)
or its officials.