MIRA
INFORM REPORT
|
Report Date : |
23.08.2014 |
IDENTIFICATION DETAILS
|
Name : |
CASTROL INDIA LIMITED |
|
|
|
|
Registered
Office : |
|
|
|
|
|
Country : |
|
|
|
|
|
Financials (as
on) : |
31.12.2013 |
|
|
|
|
Date of
Incorporation : |
31.05.1979 |
|
|
|
|
Com. Reg. No.: |
11-021359 |
|
|
|
|
Capital
Investment / Paid-up Capital : |
Rs.4945.600 Millions |
|
|
|
|
CIN No.: [Company Identification
No.] |
L23200MH1979PLC021359 |
|
|
|
|
TAN No.: [Tax Deduction &
Collection Account No.] |
MUMC03626A |
|
|
|
|
PAN No.: [Permanent Account No.] |
AAACC4481E |
|
|
|
|
Legal Form : |
A Public Limited Liability Company. The Company’s Shares are Listed on
the Stock Exchanges. |
|
|
|
|
Line of Business
: |
Manufacturing and marketing of Automotive, Non-Automotive Lubricants and related services. |
|
|
|
|
No. of Employees
: |
Information declined by the management |
RATING & COMMENTS
|
MIRA’s Rating : |
A (65) |
|
RATING |
STATUS |
PROPOSED CREDIT LINE |
|
|
56-70 |
A |
Financial & operational base are regarded healthy. General unfavourable
factors will not cause fatal effect. Satisfactory capability for payment of
interest and principal sums |
Fairly Large |
|
Status : |
Good |
|
|
|
|
Payment Behaviour : |
Regular |
|
|
|
|
Litigation : |
Exist |
|
|
|
|
Comments : |
Subject is an established company having a fine track. Financial position of the company seems to be sound. Trade relations are reported as fair. Business is active. Payment
terms are reported to be regular and as per commitments. The company can be considered normal for business dealings at usual
trade terms and conditions. |
NOTES :
Any query related to this report can be made
on e-mail : infodept@mirainform.com
while quoting report number, name and date.
INDIAN ECONOMIC OVERVIEW
N E W S
As per the latest IMF study, the total weigh of emerging markets in the
GDP of the world on a purchasing power parity basis has seen a sizeable shift.
It highlights how as against 51 % in 2005, the emerging economies now account
for close to 56 % of the global purchasing power GDP as per the latest survey.
And with the emerging economies growing at a faster rate than their developed
counterparts, there are every possibility that the their share goes up further
in the coming years. China may surpass the US over the next few years.
Politics and economics are very intricately connected. They tend to
influence each other in ways that could be very complex and far-reaching. The
prospects of the India’s economy have been seriously compromised due to
political corruption. High inflation, poor standard of living are to a great
extent a result of rampant corruption in the country. China on the other hand,
seems to be facing diametrically opposite challenge. American hedge fund
manager Jim Chanos has been keenly following the political and economic
development in the dragon economy and has figured out something that is quite
worrying. He is of the view that the Chinese economy could be heading toward
trouble on account of new Chinese President Xi Jingping’s very aggressive
anti-corruption drive. Chanos believes tat many things such as apartment sales,
luxury products, etc. were largely bought with dirty money. And it is now
beginning to impact consumption. This may indeed be bad news for an economy
that is struggling to transition from an investment-driven export-oriented
economy to a domestic consumption-driven economy.
A study published by Firstpost has revealed that asset classes like real
estate and equities were the biggest beneficiaries of the liberalization
policies. A firm called Ciane Analytics studied returns from assets
including equities, gold, fixed deposits, G-Secs and real estate since 1991.
Real estate outperformed every other asset classes during the 23-year period
with an annualized return of 20 % ! Equities came in second with annualized
return of 15.5 % ! However, while these returns may seem mouthwatering, the
fact is that the return from equities adjusted for inflation came down to just
7.1 %.
Some brief news are as under
. R-Power to buy Jaypee’s hydro assets
. Investors await justice in NSEL case
. India seeks MFN status from Pakistan ahead of meeting
. Ukrain’s clashes with rebels hinder MH17 crash investigation
. India exploring merger of state-owned hydro PSUs
..Higher costs weigh down profit growth to slowest in 9 quarters
..Wal-Mart to expand wholesale business in India
. GMR group moves to strengthen balance sheet
. Central Bank to sell 4 % stake to Life Insurance Corporation
. Tata Chemicals plans to raise up to Rs 10000 mn.
RBI DEFAULTERS’ LIST STATUS
Subject’s name is not enlisted as a defaulter
in the publicly available RBI Defaulters’ list.
EPF (Employee Provident Fund) DEFAULTERS’ LIST STATUS
Subject’s name is not enlisted as a defaulter
in the publicly available EPF (Employee Provident Fund) Defaulters’ list as of
31-03-2014.
INFORMATION DENIED
Management Non Co-Operative (91-22-66984100)
LOCATIONS
|
Registered Office : |
Technopolis Knowledge Park, Mahakali Caves Road, Andheri (East),
Mumbai – 400093, Maharashtra, India |
|
Tel. No.: |
91-22-66984100/ 23632511/ 23632512/ 23632513 |
|
Fax No.: |
91-22-56984101 |
|
E-Mail : |
|
|
Website : |
DIRECTORS
As on: 31.12.2013
|
Name : |
Mr. S. M. Datta |
|
Designation : |
Chairman |
|
|
|
|
Name : |
Mr. Ravi Kirpalani |
|
Designation : |
Managing Director |
|
|
|
|
Name : |
Mr. R. Gopalakrishnan |
|
Designation : |
Non-Executive Director |
|
|
|
|
Name : |
Mr. Uday Khanna |
|
Designation : |
Non-Executive Director |
|
|
|
|
Name : |
Mr. Ralph Hewins |
|
Designation : |
Non-Executive Director |
|
|
|
|
Name : |
Mr. Peter Weidner |
|
Designation : |
Non-Executive Director |
|
|
|
|
Name : |
Mr. Sashi Mukundan |
|
Designation : |
Non-Executive Director |
|
|
|
|
Name : |
Ms. Rashmi Joshi |
|
Designation : |
Director - Finance |
KEY EXECUTIVES
|
Name : |
Mr. Sandeep Deshmukh |
|
Designation : |
Company Secretary |
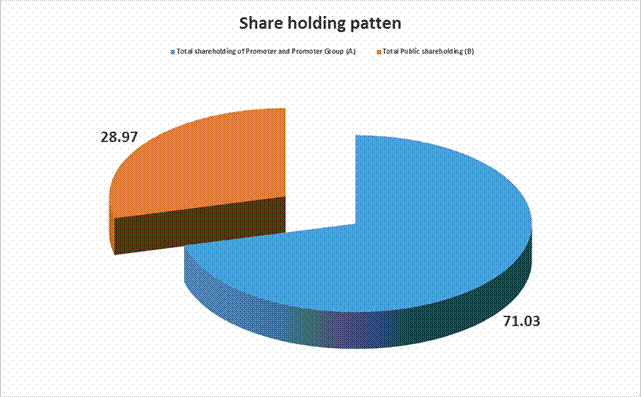
MAJOR SHAREHOLDERS / SHAREHOLDING PATTERN
As on: 30.06.2014
|
Category
of Shareholders |
No. of Shares |
Percentage of Holding |
|
(A)
Shareholding of Promoter and Promoter Group |
|
|
|
|
|
|
|
|
|
|
|
|
351291716 |
71.03 |
|
|
351291716 |
71.03 |
|
Total shareholding
of Promoter and Promoter Group (A) |
351291716 |
71.03 |
|
(B) Public
Shareholding |
|
|
|
|
|
|
|
|
920602 |
0.19 |
|
|
318154 |
0.06 |
|
|
26440412 |
5.35 |
|
|
40485840 |
8.19 |
|
|
68165008 |
13.78 |
|
|
|
|
|
|
6802748 |
1.38 |
|
|
|
|
|
|
59663416 |
12.06 |
|
|
8634304 |
1.75 |
|
|
4000 |
0.00 |
|
|
4000 |
0.00 |
|
|
75104468 |
15.19 |
|
Total Public
shareholding (B) |
143269476 |
28.97 |
|
Total (A)+(B) |
494561192 |
100.00 |
|
(C) Shares held by Custodians and against which Depository Receipts have been issued |
0 |
0.00 |
|
|
0 |
0.00 |
|
|
0 |
0.00 |
|
|
0 |
0.00 |
|
Total (A)+(B)+(C) |
494561192 |
0.00 |
Shareholding
belonging to the category "Promoter and Promoter Group"
|
Sl.No. |
Name of the Shareholder |
Details of Shares held |
Total shares (including underlying shares assuming full
conversion of warrants and convertible securities) as a % of diluted share
capital |
|
|
No. of Shares held |
As a % of grand total (A)+(B)+(C) |
|
||
|
1 |
Castrol Limited |
35,07,49,820 |
70.92 |
70.92 |
|
2 |
BP Mauritius Limited |
5,41,896 |
0.11 |
0.11 |
|
|
Total |
35,12,91,716 |
71.03 |
71.03 |
Shareholding
belonging to the category "Public" and holding more than 1% of the Total
No. of Shares
|
Sl. No. |
Name of the Shareholder |
No. of Shares held |
Shares as % of Total No. of Shares |
Total shares (including underlying shares assuming full
conversion of warrants and convertible securities) as a % of diluted share
capital |
|
|
1 |
Aberdeen Global Indian Equity Fund Mauritius Limited |
8445122 |
1.71 |
1.71 |
|
|
2 |
Life Insurance Corporation of India |
20859631 |
4.22 |
4.22 |
|
|
3 |
Aberdeen Global Asian Smaller Companies Fund |
7095738 |
1.43 |
1.43 |
|
|
|
Total |
36400491 |
7.36 |
7.36 |
BUSINESS DETAILS
|
Line of Business : |
Manufacturing and marketing of Automotive, Non-Automotive
Lubricants and related services. |
GENERAL INFORMATION
|
No. of Employees : |
Information declined by the management |
|
|
|
|
Bankers : |
· Deutsche Bank · HDFC Bank Limited · The Hong Kong and Shanghai Banking Corporation Limited · State Bank of India · Citibank N.A. · DBS Bank Limited ·
J P Morgan Chase Bank N.A. |
|
|
|
|
Facilities : |
-- |
|
|
|
|
Banking
Relations : |
-- |
|
|
|
|
Auditors : |
|
|
Name : |
S. R. Batliboi and Company LLP Chartered Accountants |
|
Address : |
29, senapati Bapat Marg, Dadar (West), Mumbai – 400028, Maharashtra,
India |
|
Tel. No.: |
91-22-61920000 |
|
Fax No.: |
91-22-61921000 |
|
|
|
|
Holding Companies : |
· Castrol Limited, U.K. (Holding Company of Castrol India Limited) · Burmah Castrol PLC (Holding Company of Castrol Limited, U.K.) ·
BP PLC (Holding Company of Burmah Castrol
PLC), Ultimate Holding Company |
|
|
|
|
Fellow Subsidiaries (where transaction
exists) : |
· Arabian Production and Marketing Lubricants Company · AsPac Lubricants (Malaysia) Sdn. Bhd · BP – Castrol (Thailand) Limited · BP (China) Industrial Lubricants Limited · BP Asia Pacific (Malaysia) Sdn. Bhd · BP Australia Pty Limited · BP Corporation North America Inc · BP Europa SE · BP Europa SE – BP Belgium (Branch) · BP Exploration (Alpha) Limited · BP Exploration Operating Company Limited · BP France · BP France SA Branch Office (Trading as BP Middle East) · BP India Services Private Limited · BP International Limited · BP Italia SpA · BP Japan K.K. · BP Korea Limited · BP Lubricants USA Inc · BP Marine Limited · BP Mauritius Limited · BP Oil International Limited · BP Products North America Inc · BP Singapore Pte. Limited · BP Southern Africa (Proprietary) Limited · BP Taiwan Marketing Limited · Burmah Castrol Australia PTY Limited · Castrol (Shenzhen) Company Limited · Castrol (Shenzhen) Company Limited Shanghai Pudong Branch · Castrol BP Petco Limited Liability Company · Castrol Industrial North America Inc · Castrol Philippines, Inc. · Lubricants UK Limited ·
Tata BP Solar India Limited (up to 28.06.2012) |
CAPITAL STRUCTURE
As on: 31.12.2013
Authorised Capital :
|
No. of Shares |
Type |
Value |
Amount |
|
|
|
|
|
|
495000000 |
Equity Shares |
Rs.10/- each |
Rs.4950.000 Millions |
|
|
|
|
|
Issued, Subscribed & Paid-up Capital :
|
No. of Shares |
Type |
Value |
Amount |
|
|
|
|
|
|
494561192 |
Equity Shares |
Rs.10/- each |
Rs.4945.600 Millions |
|
|
|
|
|
Reconciliation of the
shares outstanding at the beginning and at the end of the reporting year:
|
Equity shares |
As at December 31, 2013 |
|
|
|
No. of Shares |
Rs. In Millions |
|
At the beginning of the year |
494,561,192 |
4945.600 |
|
Bonus shares issued during the year [refer note (i) below] |
-- |
-- |
|
Outstanding at the
end of the year |
494,561,192 |
4945.600 |
Note (i) The Company has allotted bonus shares on September 6, 2012 in the ratio of one equity share for every one equity share of Rs. 10/- each held in the Company on the record date.
b. Terms/rights
attached to equity shares:
The Company has only one class of equity shares having par value of Rs. 10 per share. Each holder of equity shares is entitled to one vote per share. The dividend proposed by the Board of Directors is subject to the approvals of the shareholders in the ensuing Annual General Meeting. The Company declares and pays dividend in Indian Rupees.
During the year ended December 31, 2013, the amount of per share interim dividend recognised as distribution to equity shareholders was Rs. 3.50 (2012 : Rs. 7.00). The amount of interim dividend distributed to equity shareholders is Rs. 1731.000 Millions (2012 : Rs. 173.10 Millions). In addition, the Company has also proposed a per share final dividend recognised as distribution to equity shareholders of Rs. 3.50 (2012 : Rs. 3.50). The amount of final proposed dividend distributed to equity shareholders is Rs. 1731.000 Millions (2012 : Rs. 1731.000 Millions). Both dividends aggregating to Rs. 7.00 per share (2012 : Rs. 10.50 per share).
In the event of the Company being liquidated, since the equity shares of the Company are fully paid-up, there would be no additional liability on the shareholders of the Company. However, post settlement of the liabilities of the Company, the surplus, if any, would be distributed amongst the shareholders in proportion to the number of shares held by each one of them.
c. Equity shares in
the Company held by its holding/ultimate holding company and/or their
subsidiaries/associates are as below:
|
|
As at December 31, 2013 Rs. In Millions |
|
Castrol Limited, U.K. 350,749,820 (2012 : 350,749,820) equity shares of Rs. 10/- each fully paid (holding company) |
3507.500 |
|
BP Mauritius Limited 541,896 (2012 : 541,896) equity shares of Rs. 10/- each fully paid (subsidiary of ultimate holding company) |
5.400 |
d. Aggregate number of
bonus shares issued, for consideration other than cash during the period of
five years immediately preceding the reporting date:
|
|
As at December 31, 2013 No. of Shares |
|
Equity shares allotted as fully paid bonus shares by capitalisation of general reserve |
370,920,894 |
e. Details of
shareholder holding more than 5% shares in the Company are as below:
|
Equity shares |
As at December 31, 2013 |
|
|
|
No. of Shares |
% holding in the class |
|
Equity shares of Rs. 10/- each fully paid-up. |
|
|
|
Castrol Limited, U.K |
350,749,820 |
70.92% |
As per of the Company, including its register of shareholders/members and other declarations received from shareholders regarding beneficial interest, the above shareholding represents both legal and beneficial ownership of shares.
f. Pursuant to the scheme of reduction of share capital u/s 100 to 105 of the Companies Act, 1956 as approved by the shareholders and the Hon’ble High Court of Bombay, the Company will reduce the fully paid-up face value of equity shares from Rs. 10 per share to Rs. 5 per share effective from January 20, 2014. Consequently, the Company will pay Rs. 5 per share to the shareholders in the due course of time.
FINANCIAL DATA
[all figures are
in Rupees Millions]
ABRIDGED BALANCE
SHEET
|
SOURCES
OF FUNDS |
31.12.2013 |
31.12.2012 |
31.12.2011 |
|
|
|
|
|
|
I.
EQUITY AND LIABILITIES |
|
|
|
|
(1)Shareholders' Funds |
|
|
|
|
(a) Share Capital |
4945.600 |
4945.600 |
2472.800 |
|
(b) Reserves & Surplus |
2568.600 |
1546.700 |
3569.200 |
|
(c) Money received against
share warrants |
0.000 |
0.000 |
0.000 |
|
|
|
|
|
|
(2) Share Application money
pending allotment |
0.000 |
0.000 |
0.000 |
|
Total
Shareholders’ Funds (1) + (2) |
7514.200 |
6492.300 |
6042.000 |
|
|
|
|
|
|
(3) Non-Current Liabilities |
|
|
|
|
(a) long-term borrowings |
0.000 |
0.000 |
0.000 |
|
(b) Deferred tax liabilities
(Net) |
0.000 |
0.000 |
0.000 |
|
(c) Trade Payables |
0.000 |
0.000 |
33.600 |
|
(d) Other long term
liabilities |
108.300 |
82.900 |
90.600 |
|
(e) long-term provisions |
24.800 |
34.300 |
34.200 |
|
Total
Non-current Liabilities (3) |
133.100 |
117.200 |
158.400 |
|
|
|
|
|
|
(4) Current Liabilities |
|
|
|
|
(a) Short term borrowings |
0.000 |
0.000 |
0.000 |
|
(b) Trade payables |
4728.300 |
4366.300 |
3927.300 |
|
(c) Other current liabilities |
1209.500 |
1185.800 |
1029.400 |
|
(d) Short-term provisions |
2565.000 |
2634.100 |
2771.100 |
|
Total
Current Liabilities (4) |
8502.800 |
8186.200 |
7727.800 |
|
|
|
|
|
|
TOTAL |
16150.100 |
14795.700 |
13928.200 |
|
|
|
|
|
|
II.
ASSETS |
|
|
|
|
(1) Non-current assets |
|
|
|
|
(a) Fixed Assets |
|
|
|
|
(i) Tangible assets |
1432.200 |
1250.700 |
1108.300 |
|
(ii) Intangible Assets |
2.400 |
10.500 |
16.900 |
|
(iii) Capital work-in-progress |
318.700 |
309.600 |
293.000 |
|
(iv) Intangible assets under
development |
0.000 |
0.000 |
0.000 |
|
(b) Non-current Investments |
0.000 |
0.000 |
0.000 |
|
(c) Deferred tax assets (net) |
529.600 |
650.900 |
562.400 |
|
(d) Long-term Loan and Advances |
875.900 |
848.500 |
683.200 |
|
(e) Other Non-current assets |
0.000 |
2.600 |
0.000 |
|
Total
Non-Current Assets |
3158.800 |
3072.800 |
2663.800 |
|
|
|
|
|
|
(2) Current assets |
|
|
|
|
(a) Current investments |
0.000 |
0.000 |
0.000 |
|
(b) Inventories |
3740.100 |
3157.600 |
3009.200 |
|
(c) Trade receivables |
2372.400 |
2166.200 |
2189.500 |
|
(d) Cash and cash equivalents |
5942.200 |
5745.900 |
5490.000 |
|
(e) Short-term loans and
advances |
864.400 |
510.300 |
490.600 |
|
(f) Other current assets |
72.200 |
142.900 |
85.100 |
|
Total
Current Assets |
12991.300 |
11722.900 |
11264.400 |
|
|
|
|
|
|
TOTAL |
16150.100 |
14795.700 |
13928.200 |
PROFIT & LOSS
ACCOUNT
|
|
PARTICULARS |
31.12.2013 |
31.12.2012 |
31.12.2011 |
|
|
SALES |
|
|
|
|
|
Income |
31796.200 |
31208.600 |
29932.700 |
|
|
Other Income |
836.400 |
721.800 |
730.900 |
|
|
TOTAL
(A) |
32632.600 |
31930.400 |
30663.600 |
|
|
|
|
|
|
|
Less |
EXPENSES |
|
|
|
|
|
Cost of Materials Consumed |
16814.200 |
16894.400 |
15954.800 |
|
|
Purchases of traded goods |
1384.700 |
1468.300 |
1258.200 |
|
|
Changes in inventories of
finished goods, work-in-progress and Stock-in-Trade |
(314.200) |
(120.000) |
(268.100) |
|
|
Employees benefits expense |
1459.700 |
1284.000 |
1159.000 |
|
|
Other expenses |
5577.000 |
5452.700 |
5132.300 |
|
|
Exceptional Item |
-228.000 |
0.000 |
0.000 |
|
|
TOTAL
(B) |
24693.400 |
24979.400 |
23236.200 |
|
|
|
|
|
|
|
Less |
PROFIT/
(LOSS) BEFORE INTEREST, TAX, DEPRECIATION
AND AMORTISATION (C) |
7939.200 |
6951.000 |
7427.400 |
|
|
|
|
|
|
|
Less |
FINANCIAL
EXPENSES (D) |
17.100 |
21.400 |
251.100 |
|
|
|
|
|
|
|
|
PROFIT
/ (LOSS) BEFORE TAX, DEPRECIATION AND AMORTISATION (C-D) (E) |
7922.100 |
6929.600 |
7176.300 |
|
|
|
|
|
|
|
Less/
Add |
DEPRECIATION/
AMORTISATION (F) |
304.500 |
266.400 |
16.800 |
|
|
|
|
|
|
|
|
PROFIT/
(LOSS) BEFORE TAX (E-F) (G) |
7617.600 |
6663.200 |
7159.500 |
|
|
|
|
|
|
|
Less |
TAX (I) |
2531.900 |
2189.300 |
2349.200 |
|
|
|
|
|
|
|
|
PROFIT/
(LOSS) AFTER TAX (G-I)
(J) |
5085.700 |
4473.900 |
4810.300 |
|
|
|
|
|
|
|
Add |
PREVIOUS
YEARS’ BALANCE BROUGHT FORWARD |
435.300 |
432.400 |
406.500 |
|
|
|
|
|
|
|
Less |
APPROPRIATIONS |
|
|
|
|
|
Interim Dividend |
1731.000 |
1731.000 |
1731.000 |
|
|
Final Dividend |
1731.000 |
1731.000 |
1978.200 |
|
|
Interim |
294.200 |
280.800 |
280.800 |
|
|
Final |
294.200 |
280.800 |
320.900 |
|
|
Final - 2012 |
13.400 |
0.000 |
-7.600 |
|
|
Transfer to General Reserve |
508.600 |
447.400 |
481.100 |
|
|
|
|
|
|
|
|
BALANCE
CARRIED TO THE B/S |
948.600 |
435.300 |
432.400 |
|
|
|
|
|
|
|
|
EARNINGS
IN FOREIGN CURRENCY |
|
|
|
|
|
Supplies to foreign vessels |
37.800 |
98.400 |
133.200 |
|
|
Commission |
46.700 |
52.100 |
73.500 |
|
|
FOB value of goods exported |
32.000 |
48.100 |
49.100 |
|
|
Energy supplies |
16.500 |
12.200 |
0.000 |
|
|
Others |
30.800 |
25.500 |
0.000 |
|
|
TOTAL
EARNINGS |
163.800 |
236.300 |
255.800 |
|
|
|
|
|
|
|
|
IMPORTS |
|
|
|
|
|
Raw Materials |
7587.900 |
7731.900 |
7776.700 |
|
|
Capital Goods |
66.300 |
58.300 |
65.800 |
|
|
TOTAL
IMPORTS |
7654.200 |
7790.200 |
7842.500 |
|
|
|
|
|
|
|
|
Earnings
/ (Loss) Per Share (Rs.) |
10.28 |
9.05 |
9.73 |
KEY RATIOS
|
PARTICULARS |
|
31.12.2013 |
31.12.2012 |
31.12.2011 |
|
PAT / Total Income |
(%) |
15.58 |
14.01 |
15.69 |
|
|
|
|
|
|
|
Net Profit Margin (PBT/Sales) |
(%) |
23.96 |
21.35 |
23.92 |
|
|
|
|
|
|
|
Return on Total Assets (PBT/Total Assets} |
(%) |
49.78 |
48.16 |
54.77 |
|
|
|
|
|
|
|
Return on Investment (ROI) (PBT/Networth) |
|
1.01 |
1.03 |
1.18 |
|
|
|
|
|
|
|
Debt Equity Ratio (Total Debt/Networth) |
|
0.00 |
0.00 |
0.00 |
|
|
|
|
|
|
|
Current Ratio (Current Asset/Current Liability) |
|
1.53 |
1.43 |
1.46 |
FINANCIAL ANALYSIS
[all figures are
in Rupees Millions]
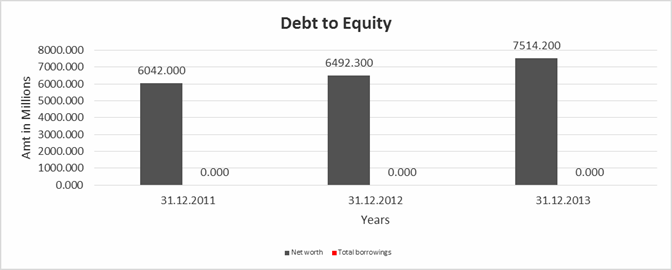
DEBT EQUITY RATIO
|
Particular |
31.12.2011 |
31.12.2012 |
31.12.2013 |
|
|
(Rs.
In Millions) |
(Rs.
In Millions) |
(Rs.
In Millions) |
|
Share Capital |
2472.800 |
4945.600 |
4945.600 |
|
Reserves & Surplus |
3569.200 |
1546.700 |
2568.600 |
|
Net
worth |
6042.000 |
6492.300 |
7514.200 |
|
|
|
|
|
|
long-term borrowings |
0.000 |
0.000 |
0.000 |
|
Short term borrowings |
0.000 |
0.000 |
0.000 |
|
Total
borrowings |
0.000 |
0.000 |
0.000 |
|
Debt/Equity
ratio |
0.000 |
0.000 |
0.000 |
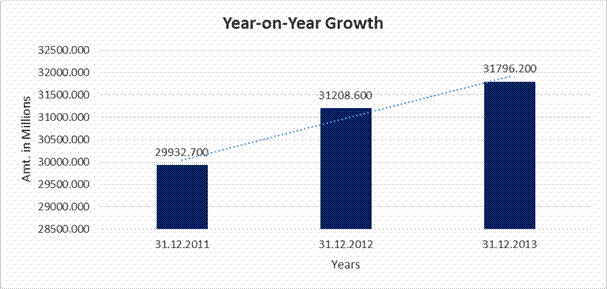
YEAR-ON-YEAR GROWTH
|
Year
on Year Growth |
31.12.2011 |
31.12.2012 |
31.12.2013 |
|
|
(Rs.
In Millions) |
(Rs.
In Millions) |
(Rs.
In Millions) |
|
Sales |
29932.700 |
31208.600 |
31796.200 |
|
|
|
4.263 |
1.883 |
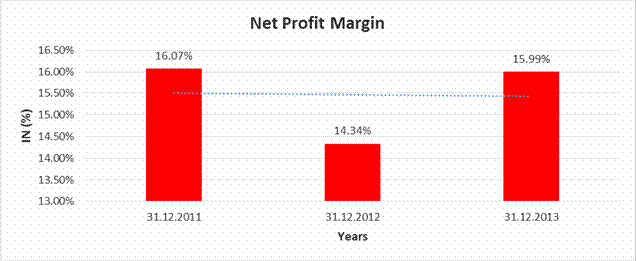
NET PROFIT MARGIN
|
Net
Profit Margin |
31.12.2011 |
31.12.2012 |
31.12.2013 |
|
|
(Rs.
In Millions) |
(Rs.
In Millions) |
(Rs.
In Millions) |
|
Sales |
29932.700 |
31208.600 |
31796.200 |
|
Profit |
4810.300 |
4473.900 |
5085.700 |
|
|
16.07% |
14.34% |
15.99% |
LOCAL AGENCY FURTHER INFORMATION
CURRENT
MATURITIES OF LONG-TERM DEBT DETAILS – NOT AVAILABLE
|
Sr. No. |
Check List by Info
Agents |
Available in Report
(Yes / No) |
|
1] |
Year of Establishment |
Yes |
|
2] |
Locality of the firm |
Yes |
|
3] |
Constitutions of the firm |
Yes |
|
4] |
Premises details |
No |
|
5] |
Type of Business |
Yes |
|
6] |
Line of Business |
Yes |
|
7] |
Promoter's background |
No |
|
8] |
No. of employees |
No |
|
9] |
Name of person contacted |
No |
|
10] |
Designation of contact person |
No |
|
11] |
Turnover of firm for last three years |
Yes |
|
12] |
Profitability for last three years |
Yes |
|
13] |
Reasons for variation <> 20% |
-- |
|
14] |
Estimation for coming financial year |
No |
|
15] |
Capital in the business |
Yes |
|
16] |
Details of sister concerns |
Yes |
|
17] |
Major suppliers |
No |
|
18] |
Major customers |
No |
|
19] |
Payments terms |
No |
|
20] |
Export / Import details (if applicable) |
No |
|
21] |
Market information |
-- |
|
22] |
Litigations that the firm / promoter involved in |
Yes |
|
23] |
Banking Details |
Yes |
|
24] |
Banking facility details |
No |
|
25] |
Conduct of the banking account |
-- |
|
26] |
Buyer visit details |
-- |
|
27] |
Financials, if provided |
Yes |
|
28] |
Incorporation details, if applicable |
Yes |
|
29] |
Last accounts filed at ROC |
Yes |
|
30] |
Major Shareholders, if available |
Yes |
|
31] |
Date of Birth of Proprietor/Partner/Director, if available |
No |
|
32] |
PAN of Proprietor/Partner/Director, if available |
No |
|
33] |
Voter ID No of Proprietor/Partner/Director, if available |
No |
|
34] |
External Agency Rating, if available |
No |
|
LITIGATION DETAILS |
|||||||
|
Lodging No:- |
STRL/71/2013 |
Failing Date:- |
28/11/2013 |
Reg. No.:- |
STR/13/2014 |
Reg. Date:- |
25/02/2014 |
|
Petitioner:- |
THE COMMISSIONER OF SALES TAX, MAHARASHTRA |
Respondent:- |
M/S CASTROL INDIA LTD- |
||||
|
Petn.Adv:- |
GOVT PLEADER (0) |
||||||
|
District:- |
MUMBAI |
||||||
|
|
|||||||
|
Bench:- |
DIVISION |
Category:- |
SALES TAX REFERENCES |
||||
|
Status:- |
Pre-Admission |
||||||
|
Act:- |
Code of civil Procedure 1908 |
||||||
PERFORMANCE
Sales realisations of the Company have increased by about 2% over the previous year to Rs. 36640.000 Millions, mainly due to an increase in unit sales realizations. However, the sales volumes have declined by 3% over the previous year. Costs of materials have decreased by about 2% over the previous year to Rs. 17880.000 Millions. Despite the challenging economic environment, a pro-active margin management strategy helped the Company to improve its unit gross margin and gross profit. Operating and other expenses increased by about Rs. 340.000 Millions as compared to the previous year mainly due to inflation. Profit Before Tax increased by about 14% over previous year to Rs. 7620.000 Millions.
Tax rate for the current year has remained at nearly the same level as that of the previous year. Profit after tax increased by 14% over the previous year to Rs. 5090.000 Millions.
MANAGEMENT DISCUSSION
AND ANALYSIS REPORT
Industry structure and developments – 2013
The Company operates across all three major market sectors of the lubricant industry – Automotive, Industrial and Marine and Energy.
The overall industry is led by the Company and Indian national oil companies, who contribute to approximately 55% of the market in terms of volumes. Another 20% of the market, by volume, is accounted for by private multinationals that are mostly integrated oil companies and the rest of the market is constituted by numerous smaller players, largely local in nature. There are over 30 established players in the Indian lubricant industry, making it very competitive. The market for automotive applications, where the Company has earned a wellentrenched position over the years, is the predominant one amongst the three sectors within the lubricant industry.
Demand drivers: India is an important market for the lubricant industry worldwide, contributing to over 5.5% of global automotive lubricant demand and over 4% of industrial lubricant demand.
Demand for automotive lubricants is driven by the dual forces of growth in vehicle population and the extent of use of these vehicles.
The demand for lubricants in the Industrial sector is primarily driven by industrial production. The Index of Industrial Production (IIP) has been observed to have a strong correlation to consumption demand for industrial lubricants in India.
In case of Marine applications, global and local ship movements are the drivers of demand. Large-scale global movement of goods happens predominantly by sea. This demand for shipping services drives fleet utilization and freight rates for shipping companies, in turn driving consumption of marine lubricants. With Energy lubricants, the installed base of off-shore rigs along the coast-line of India and their up-time, drive demand for such products.
Supply drivers: Lubricants are manufactured by blending base oils and additives, with base oil being the main component. India is a net base oil deficit market and many additives used in lubricants are sourced from outside India. This necessitates largescale import of raw materials and thus also exposes lubricant businesses to fluctuations in foreign exchange rates.
Major industry
developments
The year 2013 was a challenging business environment due to the twin effects of a slower GDP growth rate of around 4.7% and relatively high inflation rates prevailing through the year. In addition, the lubricant industry faced many other strong headwinds from demand and supply drivers alike during the year.
Automotive sector
Vehicle sales in India grew by 1.7% in the year 2013 compared to the previous year. With respect to sales in the previous year, commercial vehicle sales declined by 15%, passenger car and utility vehicle sales declined by 8%, while two-wheeler sales grew by 4%. In addition, the slowing down of the economic growth translated into weakening of goods movement across the country and also a slowing down of infrastructure projects. This has had a direct impact on lubricant consumption in the commercial vehicle sector and other business-to-business segments.
The choice of lubricant and its specification plays a key role in enabling Original Equipment Manufacturers (OEMs) to comply with tightening regulations on tail-pipe emissions and to meet demands for lower cost of operations. This places onus on the lubricant industry to respond with products that are able to cope with the increasing sophistication of these modern vehicles. These improved products, typically ‘synthetic’ lubricants, are also able to maintain their physicochemical and performance properties for a longer period of usage than earlier generation lubricants, thus lengthening oil drain intervals.
This has had an impact on structural demand in the industry. Lubricant volume consumption for the same rate of use decreases while per unit cost and price realization increases. Therefore, other drivers remaining unchanged, the growth in demand for lubricants is expected to lag vehicle population growth rate in the foreseeable future.
Commercial vehicles
Trucks: The medium and heavy commercial vehicle (M and HCV) population in India grew by circa 2%, while the micro-light commercial vehicles grew by 22% during 2013. Continuing weak transporter sentiment due to higher interest rates, vehicle and fuel prices and weaker freight rates, continued to adversely impact M and HCV usage in 2013. The Company estimates that this has resulted in a circa 5% decline in consumption of truck engine oils.
Tractors: Tractor sales have experienced 15% growth in 2013 over previous year, on the back of a good monsoon and better price realization for the Rabi crop in large agriculture-driven states. As a result, tractor population in India is estimated to have increased by 6% during the year.
Off-road vehicles: Off-road vehicle sales and utilization were also negatively impacted by the slowing down of many material infrastructure-related projects and due to the bottle-necks in the mining sector.
Non-automotive
sectors
Industrial lubricants
The year 2013 was one of unprecedented challenges for some of the key industrial sectors and for the Indian economy alike. Industrial activity remained subdued for most of the year, reflecting a flat growth in aggregate output. Industrial output measured by the Index of Industrial Production (IIP), has grown by circa 0.6% in 2013. This was the lowest growth recorded for the index in more than a decade. This is believed to have been triggered by sustained inflation, higher raw material prices and lower demand for consumer durables and capital goods. All of the above has had a knock-on effect on sectors such as automobile manufacturing, machinery manufacturing and fabricated metal goods (FMG) industries, causing a decline in their respective outputs.
This has impacted the overall demand for Industrial lubricants which remained flat during the year.
Marine and Energy
lubricants
Global shipping industry is still passing through one of its worst phases in several decades. The Indian shipping industry has followed the global pattern to a large extent, where global trade had grown 12.6% in 2010, before slowing down to 3.2% in 2012.
The ban on iron ore export from India, changes in tax structure of coal exporting countries and high cost of funding have exacerbated the problems of the Indian shipping business.
During 2013, many Indian shipping and ship management companies increased scrapping or sale of vessels, with several companies turning delinquent.
Market behaviour and
outlook
GDP growth rate is expected to have bottomed out in 2013 and
to average slightly higher in 2014 than it was for 2013. The Wholesale Price
Index for inflation is expected to increase marginally from the average of 5.5%
in 2013 to about 6.3%. Consumer sentiment is expected to be muted, especially
in the first half of 2014.
Automotive sector
The outlook for the automotive sector has been examined closely by the Company through the three broad dimensions of demand drivers, distribution channels and competitive activity.
Non-automotive sector
Industrial lubricants
The manufacturing activity is expected to gather momentum during 2014, owing to a pick-up in the domestic demand and likely growth in exports. Improved rural income due to good agricultural output and an improvement in consumer sentiment in the urban areas are expected to generate higher demand. Besides, the investment demand is also expected to show a gradual improvement. Some of the key Industrial sectors like automobiles, metals, machinery manufacturing and cement are expected to capitalize on the higher demand and record better growth during 2014.
Marine and Energy
lubricants
Decisions on policy changes are under discussion within the Oil and Gas Ministry and with other key stakeholders. Policy decisions and investments in this sector would be a significant stimulus to the Energy lubricants sub-sector.
Performance of
segments and categories
I. Automotive
lubricants
Overview
The Company delivered a strong performance across the personal mobility segments of two-wheelers and passenger car oils in the year 2013, driven by performance of its Power Brands – Castrol Activ, Castrol Power1, Castrol GTX and Castrol Magnatec. The strong head-winds in the commercial vehicle oils segment, impacted the Company’s performance in this category. This was offset to some extent through new product introductions and a play in the mid-price segment.
There were also significant challenges that the Company encountered in the Heavy Duty category which caters to large fleets, mining, and building and construction equipment applications. This is due to the twin effects of lowered economic activity in this category and rising input costs for the industry.
The Castrol brand continued to pioneer and drive the movement towards synthetics in response to the demands from vehicle manufacturers (OEMs) for better performing and environment-friendly products, while also selectively making a play in the midprice segment in certain categories. The Company continued its close association with its OEM partners, especially Maruti Suzuki, Jaguar Land Rover, BMW, Ford and the Volkswagen group and introduced coengineered products with Tata Motors during the year.
The Company also further deepened relations with key retail channel partners through the highly successful Anmol Ratn programme. The Castrol Engine Experts Club was launched during the second half of 2013 to further endear brand Castrol to mechanics, who are key influencers in the choice of oil and who are the primary handlers of lubricants in many categories.
The following sub-sections of the report detail out the performance of each category within automotive lubricants.
UNAUDITED FINANCIAL
RESULTS FOR THE QUARTER ENDED MARCH 31, 2014
(Rs. In Millions)
|
Particular |
Quarter Ended |
|
|
31.03.2014 |
|
|
(Unaudited) |
|
Income from operations |
|
|
Sales/Income from
Operations |
9446.000 |
|
Less: Excise duty
|
1295.000 |
|
Net Sales/Income
from Operations |
8151.000 |
|
Other operating
income |
19.000 |
|
Total Income |
8170.000 |
|
Expenditure |
|
|
Changes
in inventories of finished goods, work in progress and stock in trade |
(69.000) |
|
Cost
of materials consumed |
4587.000 |
|
Purchase
of stock in trade |
364.000 |
|
Employee
benefits expenses |
391.000 |
|
Depreciation
and amortization expenses |
84.000 |
|
Other
expenses |
|
|
Advertisement
and Sales Promotion |
621.000 |
|
Carriage,
Insurance and Freight |
265.000 |
|
Other
Expenditure |
549.000 |
|
Total Expenses |
6792.000 |
|
Profit/ (Loss) from Operations
before Other Income, Interest and Exceptional Items (1-2) |
1378.000 |
|
Other
Income |
156.000 |
|
Profit/ (Loss) from ordinary activities
before finance costs and Exceptional
Items (3+4) |
1534.000 |
|
Finance
Cost (net) |
4.000 |
|
Profit/ (Loss) from ordinary
activities after finance costs and but before Exceptional Items (5-6) |
1530.000 |
|
Exceptional
Items |
- |
|
Profit/ (Loss) from ordinary
activities before tax (7+8) |
1530.000 |
|
Tax
Expense |
528.000 |
|
Profit/ (Loss) from ordinary
activities after tax (9-10) |
1002.000 |
|
Paid-up Equity Share Capital (Face Value per share Re.10) |
2473.000 |
|
Earnings Per Share
– (Before Extraordinary Items) |
|
|
Basic and Diluted |
2.03 |
|
|
|
|
PARTICULARS OF
SHAREHOLDING |
|
|
Public Shareholding |
|
|
-Number
of Shares |
143269476 |
|
-
Percentage of Shareholding |
28.97% |
|
|
|
|
Promoters and Promoter Group
Shareholding |
|
|
a) Pledged/Encumbered |
|
|
-
Number of Shares |
NIL |
|
-
Percentage of Shares (as a % of the Total Shareholding of promoter and
promoter group) |
NA |
|
- Percentage
of Shares (as a % of the Total Share Capital of the Company) |
NA |
|
|
|
|
b) Non Encumbered |
|
|
-
Number of Shares |
351291716 |
|
-
Percentage of Shares (as a % of the Total Shareholding of Promoter and
Promoter Group) |
100.00% |
|
-
Percentage of Shares (as a % of the Total Share Capital of the Company) |
71.03% |
SEGMENT-WISE DETAILS
OF REVENUE, RESULT AND CAPITAL EMPLOYED UNDER CLAUSE 41 OF THE LISTING
AGREEMENT
(Rs. In Millions)
|
Sr. No. |
Particular |
Quarter Ended |
|
|
|
31.03.2014 |
|
|
|
(Unaudited) |
|
1. |
Segment Revenue |
|
|
|
Automotive |
7197.000 |
|
|
Non Automotive |
973.000 |
|
|
Total |
8170.000 |
|
2. |
Segment Result |
|
|
|
Automotive |
1254.000 |
|
|
Non Automotive |
145.000 |
|
|
Total |
1399.000 |
|
|
Un-allocable income net of Unallocated (Expenditure) |
135.000 |
|
|
Finance Charges |
4.000 |
|
|
Profit from ordinary activities before tax (Including Exceptional items) |
1530.000 |
|
3. |
Segment Capital
Employed |
|
|
|
Automotive |
2504.000 |
|
|
Non Automotive |
1028.000 |
|
|
Add: Unallocable Assets less liabilities |
2091.000 |
|
|
Total capital
employed |
5623.00 |
|
Particulars |
Quarter Ended 31.03.2014 |
|
Pending at the beginning of the quarter |
Nil |
|
Received during the quarter |
5 |
|
Disposed of during the quarter |
3 |
|
Remaining unresolved at the end of the
quarter |
2 |
Notes:
1. The above results were reviewed by the Audit Committee and approved by the Board of Directors at its meeting held on May 13, 2014.
2. The above results have been subjected to "Limited Review" by the Statutory Auditors of the Company.
3. Tax Expenses include Current Tax and Deferred Tax.
4. The figures for the quarter ended December 31, 2013 are the balancing figures between the audited figures in respect of the full financial year ended December 31, 2013 and the published year to date figures up to the third quarter ended September 30, 2013.
5. Pursuant to the scheme of reduction of share capital under sections 100 to 105 of the Companies Act, 1956, as approved by the shareholders and Hon'ble High Court of Bombay, the fully paid-up face value of Equity Shares was reduced from Rs. 10/-per share to Rs. 5/- per share, effective from January 20, 2014. Consequently, the balance of Rs. 5/- per share was paid during the current quarter, to the eligible shareholders as per the record date of March 03, 2014.
6. Previous period's figures have been regrouped wherever necessary.
CONTINGENT
LIABILITIES
(Rs. In Millions)
|
Particular |
31.12.2013 |
31.12.2012 |
|
Excise/sales tax demands made by the authorities, in respect of which appeals have been filed |
167.700 |
222.200 |
|
Claims against the Company not acknowledged as debts estimated at : In respect of third parties – miscellaneous |
9.800 |
18.500 |
FIXED ASSETS
Tangible assets
· Freehold land
· Leasehold land
· Building
· Plant and machinery
· Furniture and fixture
· Office equipment
· Motor vehicles
Intangible assets
· Computer software
CMT REPORT (Corruption, Money Laundering & Terrorism]
The Public Notice information has been collected from various sources
including but not limited to: The Courts,
1] INFORMATION ON
DESIGNATED PARTY
No records exist designating subject or any of its beneficial owners,
controlling shareholders or senior officers as terrorist or terrorist
organization or whom notice had been received that all financial transactions
involving their assets have been blocked or convicted, found guilty or against
whom a judgement or order had been entered in a proceedings for violating
money-laundering, anti-corruption or bribery or international economic or
anti-terrorism sanction laws or whose assets were seized, blocked, frozen or
ordered forfeited for violation of money laundering or international
anti-terrorism laws.
2] Court Declaration :
No records exist to suggest that subject is
or was the subject of any formal or informal allegations, prosecutions or other
official proceeding for making any prohibited payments or other improper
payments to government officials for engaging in prohibited transactions or
with designated parties.
3] Asset Declaration :
No records exist to suggest that the property or assets of the subject
are derived from criminal conduct or a prohibited transaction.
4] Record on Financial
Crime :
Charges or conviction
registered against subject: None
5] Records on Violation of
Anti-Corruption Laws :
Charges or
investigation registered against subject: None
6] Records on Int’l
Anti-Money Laundering Laws/Standards :
Charges or
investigation registered against subject: None
7] Criminal Records
No available
information exist that suggest that subject or any of its principals have been
formally charged or convicted by a competent governmental authority for any
financial crime or under any formal investigation by a competent government
authority for any violation of anti-corruption laws or international anti-money
laundering laws or standard.
8] Affiliation with
Government :
No record
exists to suggest that any director or indirect owners, controlling
shareholders, director, officer or employee of the company is a government
official or a family member or close business associate of a Government
official.
9] Compensation Package :
Our market
survey revealed that the amount of compensation sought by the subject is fair
and reasonable and comparable to compensation paid to others for similar
services.
10] Press Report :
No press reports / filings exists on
the subject.
CORPORATE GOVERNANCE
MIRA INFORM as part of its Due Diligence do provide comments on
Corporate Governance to identify management and governance. These factors often
have been predictive and in some cases have created vulnerabilities to credit
deterioration.
Our Governance Assessment focuses principally on the interactions
between a company’s management, its Board of Directors, Shareholders and other
financial stakeholders.
CONTRAVENTION
Subject is not known to have contravened any existing local laws,
regulations or policies that prohibit, restrict or otherwise affect the terms
and conditions that could be included in the agreement with the subject.
FOREIGN EXCHANGE RATES
|
Currency |
Unit
|
Indian Rupees |
|
US Dollar |
1 |
Rs.60.44 |
|
|
1 |
Rs.100.24 |
|
Euro |
1 |
Rs.80.35 |
INFORMATION DETAILS
|
Information
Gathered by : |
SVA |
|
|
|
|
Analysis Done by
: |
RAS |
|
|
|
|
Report Prepared
by : |
VRN |
SCORE & RATING EXPLANATIONS
|
SCORE FACTORS |
RANGE |
POINTS |
|
HISTORY |
1~10 |
7 |
|
PAID-UP CAPITAL |
1~10 |
7 |
|
OPERATING SCALE |
1~10 |
7 |
|
FINANCIAL CONDITION |
|
|
|
--BUSINESS SCALE |
1~10 |
7 |
|
--PROFITABILIRY |
1~10 |
8 |
|
--LIQUIDITY |
1~10 |
7 |
|
--LEVERAGE |
1~10 |
7 |
|
--RESERVES |
1~10 |
8 |
|
--CREDIT LINES |
1~10 |
7 |
|
--MARGINS |
-5~5 |
- |
|
DEMERIT POINTS |
|
|
|
--BANK CHARGES |
YES/NO |
NO |
|
--LITIGATION |
YES/NO |
YES |
|
--OTHER ADVERSE INFORMATION |
YES/NO |
NO |
|
MERIT POINTS |
|
|
|
--SOLE DISTRIBUTORSHIP |
YES/NO |
NO |
|
--EXPORT ACTIVITIES |
YES/NO |
NO |
|
--AFFILIATION |
YES/NO |
YES |
|
--LISTED |
YES/NO |
YES |
|
--OTHER MERIT FACTORS |
YES/NO |
YES |
|
DEFAULTER |
|
|
|
--RBI |
YES/NO |
NO |
|
--EPF |
YES/NO |
NO |
|
|
|
|
|
TOTAL |
|
65 |
This score serves as a reference to assess SC’s credit risk
and to set the amount of credit to be extended. It is calculated from a composite
of weighted scores obtained from each of the major sections of this report. The
assessed factors and their relative weights (as indicated through %) are as
follows:
Financial
condition (40%) Ownership
background (20%) Payment
record (10%)
Credit history
(10%) Market trend
(10%) Operational
size (10%)
RATING EXPLANATIONS
|
RATING |
STATUS |
PROPOSED CREDIT LINE |
|
|
>86 |
Aaa |
Possesses an extremely
sound financial base with the strongest capability for timely payment of interest
and principal sums |
Unlimited |
|
71-85 |
Aa |
Possesses adequate
working capital. No caution needed for credit transaction. It has above
average (strong) capability for payment of interest and principal sums |
Large |
|
56-70 |
A |
Financial & operational
base are regarded healthy. General unfavourable factors will not cause fatal
effect. Satisfactory capability for payment of interest and principal sums |
Fairly
Large |
|
41-55 |
Ba |
Overall operation is considered
normal. Capable to meet normal commitments. |
Satisfactory |
|
26-40 |
B |
Capability to overcome
financial difficulties seems comparatively below average. |
Small |
|
11-25 |
Ca |
Adverse factors are apparent.
Repayment of interest and principal sums in default or expected to be in
default upon maturity |
Limited
with full security |
|
<10 |
C |
Absolute credit risk
exists. Caution needed to be exercised |
Credit
not recommended |
|
-- |
NB |
New Business |
-- |
This report is issued at your request without any
risk and responsibility on the part of MIRA INFORM PRIVATE LIMITED (MIPL)
or its officials.