MIRA
INFORM REPORT
|
Report Date : |
23.08.2014 |
IDENTIFICATION DETAILS
|
Name : |
INVE [ |
|
|
|
|
Registered Office : |
79/1 Moo 1, |
|
|
|
|
Country : |
|
|
|
|
|
Financials (as on) : |
31.12.2013 |
|
|
|
|
Date of Incorporation : |
06.02.1996 |
|
|
|
|
Com. Reg. No.: |
0135539000624 |
|
|
|
|
Legal Form : |
Private
Limited Company |
|
|
|
|
Line of Business : |
The subject is
engaged in manufacturing, distributing and
exporting aquaculture feeds,
nutrition, additive feed
and health products
for shrimp, fish and
shell. |
|
|
|
|
No of Employees : |
200 |
RATING & COMMENTS
|
MIRA’s Rating : |
B |
|
RATING |
STATUS |
PROPOSED CREDIT LINE |
|
|
26-40 |
B |
Capability to overcome financial difficulties seems comparatively
below average. |
Small |
|
Status : |
Moderate |
|
|
|
|
Payment Behaviour : |
Slow but correct |
|
|
|
|
Litigation : |
Clear |
NOTES :
Any query related to this report can be made
on e-mail : infodept@mirainform.com
while quoting report number, name and date.
ECGC Country Risk Classification List – June 01, 2014
|
Country Name |
Previous Rating (31.03.2014) |
Current Rating (01.06.2014) |
|
|
B1 |
B1 |
|
Risk Category |
ECGC
Classification |
|
Insignificant |
A1 |
|
Low Risk |
A2 |
|
Moderate Low Risk |
B1 |
|
Moderate Risk |
B2 |
|
Moderate High Risk |
C1 |
|
High Risk |
C2 |
|
Very High Risk |
D |
With a well-developed
infrastructure, a free-enterprise economy, generally pro-investment policies, and
strong export industries,
|
Source
: CIA |
COMPANY NAME
INVE [
SUMMARY
BUSINESS ADDRESS : 79/1
MOO 1,
NONGLUM, WACHIRABARAMI,
TELEPHONE : [66] 56
609-800
FAX :
[66] 56
692-499
E-MAIL
ADDRESS : ith@invethailand.com
REGISTRATION
ADDRESS : SAME
AS BUSINESS ADDRESS
ESTABLISHED
: 1996
REGISTRATION
NO. : 0135539000624 [Former
: POR. THOR. 2409]
TAX
ID NO. : 3181031788
CAPITAL REGISTERED : BHT. 235,000,000
CAPITAL PAID-UP : BHT.
235,000,000
SHAREHOLDER’S PROPORTION : FOREIGN : 100%
FISCAL YEAR CLOSING DATE : DECEMBER 31
LEGAL
STATUS : PRIVATE LIMITED
COMPANY
EXECUTIVE : MR. WIM ALOYS
LUTGARDE MARTENS, BELGIAN
MANAGING DIRECTOR
NO.
OF STAFF : 200
LINES
OF BUSINESS : AQUACULTURE FEED
AND HEALTH PRODUCTS
MANUFACTURER, DISTRIBUTOR
AND EXPORTER
CORPORATE PROFILE
OPERATING
TREND : STABLE
PRESENT
SITUATION : OPERATING NORMALLY
REPUTATION : GOOD
WITH NORMAL BUSINESS
ENGAGEMENT
MANAGEMENT
STANDARD : MANAGEMENT WITH
FAIR PERFORMANCE
HISTORY
The subject was
established on February
6, 1996 as
a private limited
company under the name
style INVE [THAILAND]
LIMITED by foreign
groups. It is
a subsidiary of Inve
Asia Limited in
Hong Kong, which
is a member
of Inve Group
worldwide. The subject is
engaged in producing
and distributing aquaculture
feed and health
products for both
domestic and overseas
markets. It currently
employs approximately 200
staff.
The subject was granted a
promotional privilege by
the Board of
Investment [BOI] on
April 5, 1996.
The subject’s registered address
was initially at 165/802
Tivanont Rd., Bangkradi,
Muang, Nonthaburi 11000.
On September 4, 1996,
the registered address
was changed to
445 Airport Rd.,
Naimuang, Muang, Phisanuloke
65000.
On November 23, 2000,
the registered address
was relocated to
79/1 Moo 1,
Nakornsawan-Phisanuloke Rd., Nonglum,
Wachirabarami, Pichit 66220, and this is
the company’s current
operation address.
THE BOARD
OF DIRECTOR
|
Name |
|
Nationality |
Age |
|
|
|
|
|
|
Mr. Wim Aloys Lutgarde
Martens |
|
Belgian |
41 |
|
Mr. Philippe P.J.M. Leger |
|
Belgian |
60 |
|
Mr. Pierre Joseph Jean
Hugo |
|
Belgian |
42 |
AUTHORIZED PERSON
Anyone of the
above directors can
sign on behalf
of the subject
with company’s affixed.
MANAGEMENT
Mr. Wim Aloys Lutgarde
Martens is the
Managing Director.
He is Belgian
nationality with the
age of 41 years
old.
Mr. Suranard
Srinara is the
Deputy Managing Director
& Operation Division
Manager.
He is Thai
nationality with the
age of 40 years
old.
Ms. Srisunan Lanphon is
the Human Resource
Manager.
She is Thai
nationality.
Ms. Kannikar Srisa-ard is
the Administration Manager.
She is Thai
nationality.
BUSINESS OPERATIONS
The subject is
engaged in manufacturing, distributing
and exporting aquaculture
feeds, nutrition, additive
feed and health
products for shrimp,
fish and shell, under
its own brands
“INVE” and “NUTRIAD”.
PRODUCTION CAPACITY
800 tons per
month
PURCHASE
Raw materials for
production mainly fish
meal, vitamin and
chemical are purchased
from over 20 suppliers
both domestic and
overseas, by 50%
is purchased from suppliers
and agents in
Thailand, the remaining
50% is imported
from Belgium, Spain,
Netherlands, Vietnam, Hong Kong,
Republic of China
and Germany.
MAJOR SUPPLIERS
Inve Aquaculture NV. : Belgium
Inve Asia Limited : Hong Kong
DISTRIBUTION
60% of its
products is exported
to Belgium, Republic
of China, India, Vietnam, U.S.A., and
the countries in
Europe, the remaining
40% is sold
locally.
PARENT COMPANY
Inve Asia Limited
Address : Suite 15B
Lokville Commercial Bldg.,
25-27 Lock Rd.,
Tsim Sha Tsui,
Kowloon, Hong
Kong
RELATED COMPANY
Inve Asia Services
Co., Ltd.
Business Type : Consultant
service of animal
feed industry
LITIGATION
Bankruptcy
and Receivership
There are no
litigation on bankruptcy
and receivership cases
filed against the
subject found at
Legal Execution Department
for the past
five years.
Others
There are no
legal suits filed
against the subject
according to the
past two years.
CREDIT
Sales are on
the credits term
of 30-60 days.
Local bills are
by cash or
on the credits
term of 30-60
days.
Imports are by
L/C at sight
or T/T.
Exports are against
T/T.
BUSINESS TRANSMISSION
In term of
sales, the products
are sold mainly
to local customers
with the maximum
credit given at
60 days. The
subject is not
found to have late payment. For the
purchasing, the subject
purchased its raw
material from local
suppliers with maximum
credit receipt at 60
days, and from overseas
suppliers by L/C
or T/T. The
subject is not
found to have
late payment for its
purchasing.
BANKING
Bangkok Bank Public
Co., Ltd.
[Hayaek Kokmatoom
Branch : 117/1-4 Phraongdam
Rd., Muang, Pisanuloke
Province]
TMB Bank Public
Co., Ltd.
[Samngam Branch : 3/13
Moo 13, Pichit-Kampaengpetch Rd.,
Samngam, Pichit Province]
EMPLOYMENT
The subject employs approximately
200 staff. [office
staff and factory
workers]
LOCATION DETAILS
The premise is
owned for administration office
and factory on
32,000 square meters plot of land
at the heading
address. Premise is
located in provincial.
Branch Office: 471
Bond Street Rd.,
Bangpood, Pakkred, Nonthaburi
11120.
Overseas Representative Office:
- 307/25 Nguyen
Van Troi, Ward 1,
District Tan Binh,
Ho Chi Minh
City, Vietnam.
- 19 Raja
Garden, 1st Street,
Kottivakkam, Chennai, India.
COMMENT
The aqua feed products industry
remains in strong demand
especially in overseas
markets. Export consumption
has continuously grown, while
domestic demand has grown
slowly.
Despite slow sales in
domestic market, subject
still maintains good
business.
FINANCIAL INFORMATION
The capital was
initially registered at
Bht. 40,000,000 divided into 40,000
shares of Bht.
1,000 each.
The capital was
increased later as follows:
Bht. 200,000,000
on January 16,
2002
Bht. 235,000,000
on December 11,
2009
The latest registered
capital was increased
to Bht. 235,000,000 divided
into 235,000 shares
of Bht. 1,000
each with fully
paid.
THE SHAREHOLDERS
LISTED WERE
[as at April
30, 2014]
|
NAME |
HOLDING |
% |
|
|
|
|
|
Inve Asia Limited
Nationality: Hong Kong Address : Suite 15B
Lokville Commercial Bldg., 25-27 Lock
Rd., Tsim Sha Tsui, Kowloon, Hong Kong |
234,998 |
100.00 |
|
Inve Aquaculture Holding
BV. Nationality: Dutch Address : Netherlands |
1 |
- |
|
Inve Asia Services
Co., Ltd. Nationality: Thai Address : 471
Bond Street Rd., Bangpood, Pakkred,
Nonthaburi 11120 |
1 |
- |
Total Shareholders : 3
Share Structure [as
at April 30,
2014]
|
Nationality |
Shareholders |
No. of Share |
% Shares |
|
|
|
|
|
|
Thai |
1 |
1 |
- |
|
Foreign |
2 |
234,999 |
100.00 |
|
Total |
3 |
235,000 |
100.00 |
NAME OF AUDITOR
& CERTIFIED PUBLIC
ACCOUNTANT NO
Mr. Krisda Lertvana No.
4958
BALANCE SHEET [BAHT]
The
latest financial figures
published for December
31, 2013, 2012
& 2011 were:
ASSETS
|
Current Assets |
2013 |
2012 |
2011 |
|
|
|
|
|
|
Cash in Hand
& at Bank |
19,341,190 |
18,353,345 |
1,173,677 |
|
Trade Accounts & Other Receivable |
260,798,173 |
283,591,268 |
371,758,852 |
|
Inventories |
489,944,728 |
404,094,602 |
394,866,043 |
|
Other Current Assets
|
4,621,036 |
5,552,814 |
16,256,677 |
|
|
|
|
|
|
Total Current Assets
|
774,705,127 |
711,592,029 |
784,055,249 |
|
Cash at Bank pledged as a Collateral |
900,000 |
900,000 |
900,000 |
|
Fixed Assets |
121,664,092 |
118,964,253 |
124,902,747 |
|
Intangible Assets |
1,049,239 |
225,409 |
106,048 |
|
Other Non-current Assets |
914,908 |
679,118 |
524,138 |
|
Total Assets |
899,233,366 |
832,360,809 |
910,488,182 |
LIABILITIES &
SHAREHOLDERS' EQUITY [BAHT]
|
Current
Liabilities |
2013 |
2012 |
2011 |
|
|
|
|
|
|
Short-term Loan from Financial Institution |
134,000,000 |
176,000,000 |
222,128,850 |
|
Trust Receipt Payable |
59,022,065 |
94,117,838 |
99,495,414 |
|
Trade Accounts &
Other Payable |
338,848,333 |
213,993,243 |
284,516,514 |
|
Current Portion of Long-term
Loan from Financial
Institution |
- |
- |
23,790,000 |
|
Accrued Income Tax |
2,764,703 |
12,904,161 |
30,319,649 |
|
Other Current Liabilities |
1,119,672 |
2,105,771 |
3,468,523 |
|
|
|
|
|
|
Total Current Liabilities |
535,754,773 |
499,121,013 |
663,718,950 |
|
|
|
|
|
|
Long-term Loan from Other
Company |
49,000,000 |
49,000,000 |
42,500,000 |
|
Other Liabilities |
1,062,864 |
1,597,635 |
2,249,233 |
|
Total Liabilities |
585,817,637 |
549,718,648 |
708,468,183 |
|
|
|
|
|
|
Shareholders' Equity |
|
|
|
|
|
|
|
|
|
Share capital : Baht 1,000
par value authorized, issued
and fully paid share
capital 235,000 shares |
235,000,000 |
235,000,000 |
235,000,000 |
|
|
|
|
|
|
Capital Paid |
235,000,000 |
235,000,000 |
235,000,000 |
|
Retained Earning Appropriated for
Statutory Reserve |
4,000,000 |
4,000,000 |
4,000,000 |
|
Unappropriated |
74,415,729 |
43,642,161 |
[36,980,001] |
|
Total Shareholders' Equity |
313,415,729 |
282,642,161 |
202,019,999 |
|
Total Liabilities &
Shareholders' Equity |
899,233,366 |
832,360,809 |
910,488,182 |
PROFIT &
LOSS ACCOUNT
|
Revenue |
2013 |
2012 |
2011 |
|
|
|
|
|
|
Sales |
885,426,285 |
1,109,039,687 |
1,067,255,985 |
|
Commission Income |
- |
- |
23,956,389 |
|
Gain on Exchange
Rate |
16,294,759 |
- |
20,923,178 |
|
Other Income |
2,735,319 |
2,319,454 |
1,830,696 |
|
Total Revenues |
904,456,363 |
1,111,359,141 |
1,113,966,248 |
|
Expenses |
|
|
|
|
|
|
|
|
|
Cost of Goods
Sold |
740,682,410 |
831,837,383 |
814,719,639 |
|
Selling Expenses |
60,405,463 |
88,459,666 |
99,606,374 |
|
Administrative Expenses |
44,466,979 |
58,679,490 |
55,767,957 |
|
Loss on Exchange Rate |
- |
591,613 |
- |
|
Total Expenses |
845,554,852 |
979,568,152 |
970,093,970 |
|
|
|
|
|
|
Profit before Financial Cost & Income Tax |
58,901,511 |
131,790,989 |
143,872,278 |
|
Financial Cost |
[18,553,979] |
[23,819,160] |
[28,933,868] |
|
|
|
|
|
|
Profit before Income Tax |
40,347,532 |
107,971,829 |
114,938,410 |
|
Income Tax |
[9,573,964] |
[27,349,667] |
[35,149,894] |
|
|
|
|
|
|
Net Profit / [Loss] |
30,773,568 |
80,622,162 |
79,788,516 |
FINANCIAL ANALYSIS
|
ITEM |
UNIT |
2013 |
2012 |
2011 |
|
|
|
|
|
|
|
LIQUIDITY RATIO |
|
|
|
|
|
CURRENT RATIO |
TIMES |
1.45 |
1.43 |
1.18 |
|
QUICK RATIO |
TIMES |
0.52 |
0.60 |
0.56 |
|
|
|
|
|
|
|
ACTIVITY RATIO |
|
|
|
|
|
FIXED ASSETS TURNOVER |
TIMES |
7.28 |
9.32 |
8.54 |
|
TOTAL ASSETS TURNOVER |
TIMES |
0.98 |
1.33 |
1.17 |
|
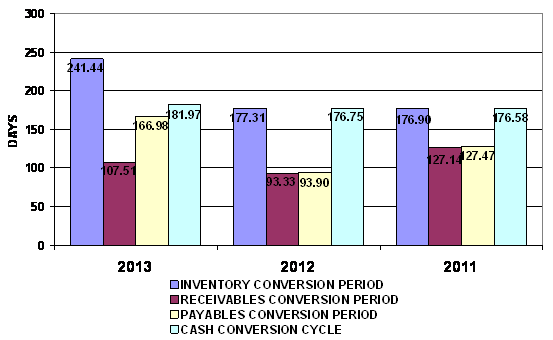
INVENTORY CONVERSION PERIOD |
DAYS |
241.44 |
177.31 |
176.90 |
|
INVENTORY TURNOVER |
TIMES |
1.51 |
2.06 |
2.06 |
|
RECEIVABLES CONVERSION PERIOD |
DAYS |
107.51 |
93.33 |
127.14 |
|
RECEIVABLES TURNOVER |
TIMES |
3.40 |
3.91 |
2.87 |
|
PAYABLES CONVERSION PERIOD |
DAYS |
166.98 |
93.90 |
127.47 |
|
CASH CONVERSION CYCLE |
DAYS |
181.97 |
176.75 |
176.58 |
|
|
|
|
|
|
|
PROFITABILITY
RATIO |
|
|
|
|
|
COST OF GOODS SOLD |
% |
83.65 |
75.01 |
76.34 |
|
SELLING & ADMINISTRATION |
% |
11.84 |
13.27 |
14.56 |
|
INTEREST |
% |
2.10 |
2.15 |
2.71 |
|
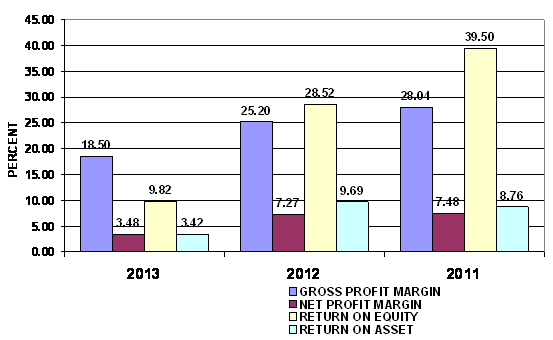
GROSS PROFIT MARGIN |
% |
18.50 |
25.20 |
28.04 |
|
NET PROFIT MARGIN BEFORE EX. ITEM |
% |
6.65 |
11.88 |
13.48 |
|
NET PROFIT MARGIN |
% |
3.48 |
7.27 |
7.48 |
|
RETURN ON EQUITY |
% |
9.82 |
28.52 |
39.50 |
|
RETURN ON ASSET |
% |
3.42 |
9.69 |
8.76 |
|
EARNING PER SHARE |
BAHT |
130.95 |
343.07 |
339.53 |
|
|
|
|
|
|
|
LEVERAGE RATIO |
|
|
|
|
|
DEBT RATIO |
TIMES |
0.65 |
0.66 |
0.78 |
|
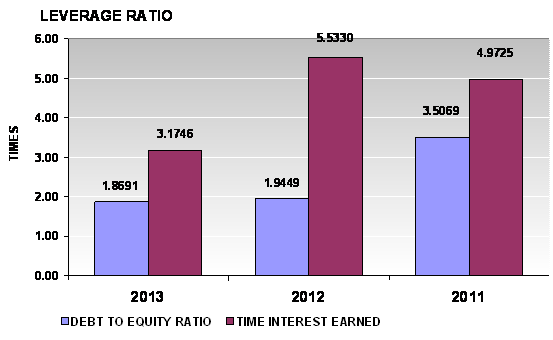
DEBT TO EQUITY RATIO |
TIMES |
1.87 |
1.94 |
3.51 |
|
TIME INTEREST EARNED |
TIMES |
3.17 |
5.53 |
4.97 |
|
|
|
|
|
|
|
ANNUAL GROWTH |
|
|
|
|
|
SALES GROWTH |
% |
(20.16) |
3.92 |
|
|
OPERATING PROFIT |
% |
(55.31) |
(8.40) |
|
|
NET PROFIT |
% |
(61.83) |
1.04 |
|
|
FIXED ASSETS |
% |
2.27 |
(4.75) |
|
|
TOTAL ASSETS |
% |
8.03 |
(8.58) |
|
ANNUAL GROWTH :
ACCEPTABLE
An annual sales growth is -20.16%. Turnover has decreased from THB
PROFITABILITY :
SATISFACTORY
PROFITABILITY
RATIO
|
Gross Profit Margin |
18.50 |
Impressive |
Industrial
Average |
2.58 |
|
Net Profit Margin |
3.48 |
Impressive |
Industrial
Average |
3.21 |
|
Return on Assets |
3.42 |
Acceptable |
Industrial
Average |
6.10 |
|
Return on Equity |
9.82 |
Acceptable |
Industrial
Average |
13.84 |
Gross Profit Margin used to assess a firm's financial health by
revealing the proportion of money left over from revenues after accounting for the
cost of goods sold. Gross profit margin serves as the source for paying
additional expenses and future savings. The
company’s figure is 18.5%. When compared with the industry
average, the ratio of the company was higher, indicated that company was more
profitable than the same industry.
Net Profit Margin is the indicator of the company's efficiency in that
net profit takes into consideration all expenses of the company. A low profit
margin indicates a low margin of safety, higher risk that a decline in sales
will erase profits and result in a net loss. The company’s figure is 3.48%,
higher figure when compared with those of its average competitors in the same
industry, indicated that business was an efficient operator in a dominant position within its industry.
Return on Assets measures how efficiently profits are being generated
from the assets employed in the business when compared with the ratios of firms
in a similar business. A low ratio in comparison with industry averages
indicates an inefficient use of business assets. When compared with the
industry average, it was lower, the
company's figure is 3.42%.
Return on Equity indicates how profitable a company is by comparing its
net income to its average shareholders' equity, ROE measures how much the
shareholders earned for their investment in the company. When compared with the
industry average, it was lower, the company's figure is 9.82%.
Trend of the
average competitors in the same industry for last 5 years
Return on Assets Uptrend
Return on Equity Uptrend
LIQUIDITY :
ACCEPTABLE
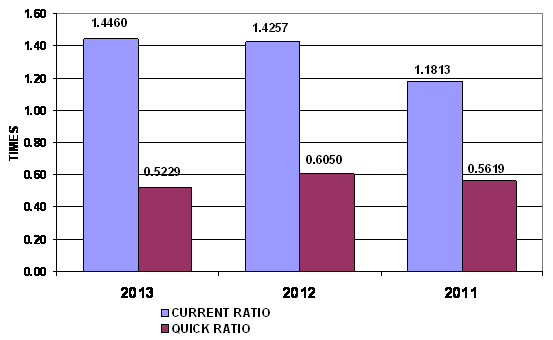
LIQUIDITY RATIO
|
Current Ratio |
1.45 |
Impressive |
Industrial
Average |
1.10 |
|
Quick Ratio |
0.52 |
|
|
|
|
Cash Conversion Cycle |
181.97 |
|
|
|
The Current Ratio is to ascertain whether a company's short-term assets
are readily available to pay off its short-term liabilities. The company's
figure is 1.45 times in 2013, increased from 1.43 times, then it is generally
considered to have good short-term financial strength. When compared with the
industry average, the ratio of the company was higher, indicated that company
was an efficient operator in a dominant position within its industry.
The Quick Ratio is a liquidity indicator that further refines the
current ratio by measuring the amount of the most liquid current assets there
are to cover current liabilities. The company's figure is 0.52 times in 2013,
decreased from 0.6 times, then the company has not enough current assets that
presumably can be quickly converted to cash for pay financial obligations.
The Cash Conversion Cycle measures the number of days a company's cash
is tied up in the production and sales process of its operations and the benefit
from payment terms from its creditors. It meant the company could survive when
no cash inflow was received from sale for 182 days.
Trend of the
average competitors in the same industry for last 5 years
Current Ratio Downtrend
LEVERAGE : ACCEPTABLE
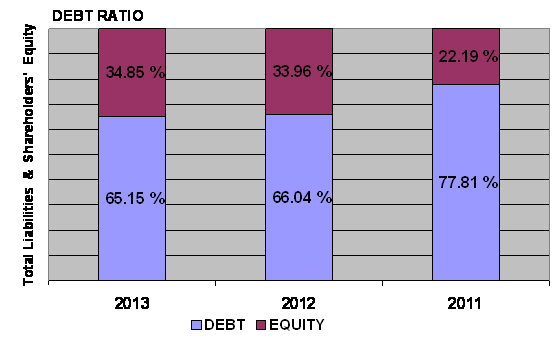
LEVERAGE RATIO
|
Debt Ratio |
0.65 |
Acceptable |
Industrial
Average |
0.58 |
|
Debt to Equity Ratio |
1.87 |
Risky |
Industrial
Average |
1.34 |
|
Times Interest Earned |
3.17 |
Impressive |
Industrial
Average |
- |
Debt to Equity Ratio a measurement of how much suppliers, lenders,
creditors and obligors have committed to the company versus what the
shareholders have committed. A higher the percentage means that the company is
using less equity and has stronger leverage position.
Times Interest Earned measuring a company's ability to meet its debt
obligations. Ratio is 3.18 higher than 1, so the company can pay interest
expenses on outstanding debt.
Debt Ratio shows the proportion of a company's assets which are financed
through debt. The company's figure is 0.65 greater than 0.5, most of the
company's assets are financed through debt.
Trend of the
average competitors in the same industry for last 5 years
Debt Ratio Uptrend
Times Interest Earned Stable
ACTIVITY :
ACCEPTABLE
ACTIVITY RATIO
|
Fixed Assets Turnover |
7.28 |
Impressive |
Industrial
Average |
- |
|
Total Assets Turnover |
0.98 |
Acceptable |
Industrial
Average |
1.90 |
|
Inventory Conversion Period |
241.44 |
|
|
|
|
Inventory Turnover |
1.51 |
Deteriorated |
Industrial
Average |
7.15 |
|
Receivables Conversion Period |
107.51 |
|
|
|
|
Receivables Turnover |
3.40 |
Acceptable |
Industrial
Average |
4.99 |
|
Payables Conversion Period |
166.98 |
|
|
|
The company's Account Receivable Ratio is calculated as 3.40 and
Inventory Turnover in Days Ratio indicates the liquidity of inventory.
It estimates the number of days that it will take to sell the current
inventory. Inventory is particularly sensitive to change in business
activities. The inventory turnover in days has increased from 177 days at the
end of 2012 to 241 days at the end of 2013. This represents a negative trend.
And Inventory turnover has decreased from 2.06 times in year 2012 to 1.51 times
in year 2013.
The company's Total Asset Turnover is calculated as 0.98 times and 1.33
times in 2013 and 2012 respectively. This ratio is determined by dividing total
assets into total sales turnover. The ratio measures the activity of the assets
and the ability of the firm to generate sales through the use of the assets.
Trend of the
average competitors in the same industry for last 5 years
Fixed Assets Turnover Stable
Total Assets Turnover Uptrend
Inventory Turnover Uptrend
Receivables Turnover Uptrend
FOREIGN EXCHANGE RATES
|
Currency |
Unit
|
Indian Rupees |
|
US Dollar |
1 |
Rs.60.44 |
|
UK Pound |
1 |
Rs.100.24 |
|
Euro |
1 |
Rs.80.35 |
INFORMATION DETAILS
|
Analysis Done by
: |
DIV |
|
|
|
|
Report Prepared
by : |
SMN |
RATING EXPLANATIONS
|
RATING |
STATUS |
PROPOSED CREDIT LINE |
|
|
>86 |
Aaa |
Possesses an extremely sound financial base with the strongest
capability for timely payment of interest and principal sums |
Unlimited |
|
71-85 |
Aa |
Possesses adequate working capital. No caution needed for credit
transaction. It has above average (strong) capability for payment of interest
and principal sums |
Large |
|
56-70 |
A |
Financial & operational base are regarded healthy. General unfavourable
factors will not cause fatal effect. Satisfactory capability for payment of
interest and principal sums |
Fairly Large |
|
41-55 |
Ba |
Overall operation is considered normal. Capable to meet normal
commitments. |
Satisfactory |
|
26-40 |
B |
Capability to overcome financial difficulties seems comparatively
below average. |
Small |
|
11-25 |
Ca |
Adverse factors are apparent. Repayment of interest and principal sums
in default or expected to be in default upon maturity |
Limited with full
security |
|
<10 |
C |
Absolute credit risk exists. Caution needed to be exercised |
Credit not
recommended |
|
-- |
NB |
New Business |
-- |
This score serves as a reference to assess SC’s credit risk and
to set the amount of credit to be extended. It is calculated from a composite
of weighted scores obtained from each of the major sections of this report. The
assessed factors and their relative weights (as indicated through %) are as
follows:
Financial
condition (40%) Ownership
background (20%) Payment
record (10%)
Credit history
(10%) Market trend
(10%) Operational
size (10%)
This report is issued at your request without any
risk and responsibility on the part of MIRA INFORM PRIVATE LIMITED (MIPL)
or its officials.