MIRA
INFORM REPORT
|
Report Date : |
25.08.2014 |
IDENTIFICATION DETAILS
|
Name : |
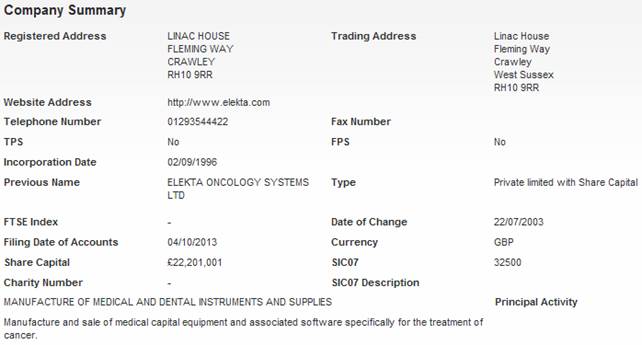
ELEKTA LIMITED |
|
|
|
|
Formerly Known As : |
ELEKTA ONCOLOGY SYSTEMS LTD |
|
|
|
|
Registered Office : |
Linac House, |
|
|
|
|
Country : |
|
|
|
|
|
Financials (as on) : |
30.04.2013 |
|
|
|
|
Date of Incorporation : |
04.10.2013 |
|
|
|
|
Legal Form : |
Private Limited With Share Capital |
|
|
|
|
Line of Business : |
Manufacture and Sale of Medical Capital Equipment and Associated
Software Specifically For the Treatment of Cancer. |
|
|
|
|
No of Employees : |
595 |
RATING & COMMENTS
|
MIRA’s Rating : |
Ba |
|
RATING |
STATUS |
PROPOSED CREDIT LINE |
|
|
41-55 |
Ba |
Overall operation is considered normal. Capable to meet normal
commitments. |
Satisfactory |
|
Status : |
Satisfactory |
|
Payment Behaviour : |
No Complaints |
|
Litigation : |
Clear |
NOTES :
Any query related to this report can be made
on e-mail : infodept@mirainform.com
while quoting report number, name and date.
ECGC Country Risk Classification List – June 01, 2014
|
Country Name |
Previous Rating (31.03.2014) |
Current Rating (01.06.2014) |
|
United Kingdom |
A1 |
A1 |
|
Risk Category |
ECGC
Classification |
|
Insignificant |
A1 |
|
Low Risk |
A2 |
|
Moderate Low Risk |
B1 |
|
Moderate Risk |
B2 |
|
Moderate High Risk |
C1 |
|
High Risk |
C2 |
|
Very High Risk |
D |
UNITED KINGDOM - ECONOMIC OVERVIEW
The UK, a leading trading
power and financial center, is the third largest economy in Europe after
Germany and France. Over the past two decades, the government has greatly
reduced public ownership. Agriculture is intensive, highly mechanized, and
efficient by European standards, producing about 60% of food needs with less
than 2% of the labor force. The UK has large coal, natural gas, and oil
resources, but its oil and natural gas reserves are declining and the UK became
a net importer of energy in 2005. Services, particularly banking, insurance,
and business services, are key drivers of British GDP growth. Manufacturing,
meanwhile, has declined in importance but still accounts for about 10% of
economic output. After emerging from recession in 1992, Britain's economy
enjoyed the longest period of expansion on record during which time growth
outpaced most of Western Europe. In 2008, however, the global financial crisis
hit the economy particularly hard, due to the importance of its financial
sector. Falling home prices, high consumer debt, and the global economic
slowdown compounded Britain's economic problems, pushing the economy into
recession in the latter half of 2008 and prompting the then BROWN (Labour) government to implement a number of measures to
stimulate the economy and stabilize the financial markets; these included
nationalizing parts of the banking system, temporarily cutting taxes,
suspending public sector borrowing rules, and moving forward public spending on
capital projects. Facing burgeoning public deficits and debt levels, in 2010
the CAMERON-led coalition government (between Conservatives and Liberal
Democrats) initiated a five-year austerity program, which aimed to lower
London's budget deficit from about 11% of GDP in 2010 to nearly 1% by 2015. In
November 2011, Chancellor of the Exchequer George OSBORNE announced additional
austerity measures through 2017 largely due to the euro-zone debt crisis. The
CAMERON government raised the value added tax from 17.5% to 20% in 2011. It has
pledged to reduce the corporation tax rate to 21% by 2014. The Bank of England
(BoE) implemented an asset purchase program of £375
billion (approximately $605 billion) as of December 2013. During times of
economic crisis, the BoE coordinates interest rate
moves with the European Central Bank, but Britain remains outside the European
Economic and Monetary Union (EMU). In 2012, weak consumer spending and subdued
business investment weighed on the economy, however, in 2013 GDP grew 1.4%,
accelerating unexpectedly in the second half of the year because of greater
consumer spending and a recovering housing market. The budget deficit is
falling but remains high at nearly 7% and public debt has continued to
increase.
|
Source
: CIA |
REGISTERED NAME & COMPANY
SUMMARY
ELEKTA LIMITED
DIRECTORS/MANAGEMENT
CURRENT DIRECTORS
|
Name |
Per Hakan Bergstrom |
Date of Birth |
17/01/1956 |
|
Officers Title |
Mr |
Nationality |
Swedish |
|
Present Appointments |
2 |
Function |
Director |
|
Appointment Date |
01/10/2001 |
|
|
|
Address |
Tryffelstigen
2, Nykoping, S-611 63 |
||
|
Other Actions |
View Director Report |
View Consumer Report |
View AML Report |
|
|
View Trace Report |
|
|
|
Name |
Johan Axel Edvin Alfred Sedihn |
Date of Birth |
14/05/1965 |
|
Officers Title |
Mr |
Nationality |
Swedish |
|
Present Appointments |
2 |
Function |
Director |
|
Appointment Date |
01/11/2005 |
|
|
|
Address |
Wimlands Wimlands Lane, Faygate,
Horsham, West Sussex, RH12 4SP |
||
|
Other Actions |
View Director Report |
View Consumer Report |
View AML Report |
|
|
View Trace Report |
|
|
|
Name |
Lutz Hagen Schaefer |
Date of Birth |
10/03/1967 |
|
Officers Title |
Mr |
Nationality |
German |
|
Present Appointments |
1 |
Function |
Director |
|
Appointment Date |
05/10/2011 |
|
|
|
Address |
Linac House, Fleming
Way, Crawley, West Sussex, RH10 9RR |
||
|
Other Actions |
View Director Report |
View Consumer Report |
View AML Report |
|
|
View Trace Report |
|
|
|
Name |
William Dean Yaeger |
Date of Birth |
22/10/1961 |
|
Officers Title |
Mr |
Nationality |
American |
|
Present Appointments |
3 |
Function |
Director |
|
Appointment Date |
27/04/2012 |
|
|
|
Address |
Linac House Fleming
Way, Crawley, West Sussex, RH10 9RR |
||
|
Other Actions |
View Director Report |
View Consumer Report |
View AML Report |
|
|
View Trace Report |
|
|
|
Name |
Steven Mark Wort |
Date of Birth |
04/04/1963 |
|
Officers Title |
Mr |
Nationality |
British |
|
Present Appointments |
1 |
Function |
Director |
|
Appointment Date |
08/03/2013 |
|
|
|
Address |
Linac House, Fleming
Way, Crawley, West Sussex, RH10 9RR |
||
|
Other Actions |
View Director Report |
View Consumer Report |
View AML Report |
|
|
View Trace Report |
|
|
|
Name |
Thomas Tetley Beazley |
Date of Birth |
26/03/1961 |
|
Officers Title |
Mr |
Nationality |
British |
|
Present Appointments |
1 |
Function |
Director |
|
Appointment Date |
08/03/2013 |
|
|
|
Address |
Linac House, Fleming
Way, Crawley, West Sussex, RH10 9RR |
||
|
Other Actions |
View Director Report |
View Consumer Report |
View AML Report |
|
|
View Trace Report |
|
|
|
Name |
David Ian Alexander |
Date of Birth |
10/03/1958 |
|
Officers Title |
Mr |
Nationality |
British |
|
Present Appointments |
1 |
Function |
Director |
|
Appointment Date |
08/03/2013 |
|
|
|
Address |
Linac House, Fleming
Way, Crawley, West Sussex, RH10 9RR |
||
|
Other Actions |
View Director Report |
View Consumer Report |
|
|
|
View Trace Report |
|
|
Current Company Secretary
|
Name |
Samantha Cookman |
Date of Birth |
- |
|
Officers Title |
Mrs |
Nationality |
|
|
Present Appointments |
1 |
Function |
Company Secretary |
|
Appointment Date |
08/03/2013 |
|
|
|
Address |
Linac House, Fleming
Way, Crawley, West Sussex, RH10 9RR |
||
Previous Director/Company
Secretaries
|
Name |
Current Directorships |
Previous Directorships |
|
Laurent Leksell |
0 |
4 |
|
David Charles Carter |
9 |
44 |
|
Jonas
Serlachius |
0 |
2 |
|
Jonas
Serlachius |
0 |
2 |
|
Frank Harris Low |
0 |
1 |
|
Manfred
Sturm |
0 |
4 |
|
Manfred
Sturm |
0 |
4 |
|
Volker
Steiber |
0 |
2 |
|
Mans
Ekelof |
0 |
2 |
|
2 |
3 |
|
|
Fritz Harald Nils Bauer |
2 |
3 |
|
0 |
2 |
|
|
Catherine Geraldine
Regan |
2 |
24 |
|
0 |
4 |
|
|
0 |
4 |
|
|
0 |
2 |
|
|
1 |
4 |
|
|
1 |
4 |
|
|
Nils
Chriser Sverker Glans |
0 |
1 |
|
2 |
1 |
|
|
0 |
1 |
|
|
0 |
1 |
|
|
0 |
1 |
|
|
34 |
165 |
NEGATIVE INFORMATION
Mortgage Summary
Total Mortgage 1
Outstanding 0
Satisfied 1
Trade Debtors / Bad Debt Summary
Total Number of Documented
Trade 0
Total Value of Documented
Trade £0
CCJ
|
Total Number of Exact CCJs - |
Total Value of Exact CCJs - |
||
|
Total Number of Possible
CCJs - |
Total Value of Possible CCJs - |
||
|
Total Number of Satisfied
CCJs - |
Total Value of Satisfied
CCJs - |
||
|
Total Number of Writs - |
- |
|
|
Exact CCJ Details
|
No CCJs
found. |
Possible CCJs Details
|
There are no possible
CCJ details. |
Writ Details
|
No writs found. |
Mortgage Details
|
Mortgage Type: |
MORTGAGE |
||
|
Date Charge Created: |
10/05/00 |
|
|
|
Date Charge Registered: |
12/05/00 |
|
|
|
Date Charge Satisfied: |
19/03/01 |
|
|
|
Status: |
SATISFIED |
|
|
|
Person(s) Entitled: |
FRED HUTCHINSON CANCER
RESEARCH CENTER |
||
|
Amount Secured: |
ALL MONIES DUE OR TO BECOME
DUE FROM THE COMPANY TO THE CHARGEE IN RELATION TOTHE PURCHASE AGREEMENT
DATED 27 JULY 1999 (AS DEFINED) AND UNDER THIS MORTGAGE |
||
|
Details: |
THE EQUIPMENT AND ALL
INSURANCES THEREON SEE THE MORTGAGE CHARGE DOCUMENT FOR FULL DETAILS |
||
SHARE & SHARE CAPITAL
INFORMATION
TOP 20 SHAREHOLDERS
|
Name |
Currency |
Share Count |
Share Type |
Nominal Value |
% of Total Share Count |
|
ELEKTA
HOLDINGS LTD |
GBP |
22,201,001 |
ORDINARY |
1 |
100 |
GROUP STRUCTURE & AFFILIATED
COMPANIES
GROUP STRUCTURE
|
Company Name |
Registered Number |
Latest Key
Financials |
Consol. Accounts |
Turnover |
|
ELEKTA AB (PUBL) |
5561704015 |
30.04.2013 |
Y |
|
|
CMS WORLDWIDE INC |
N/A |
- |
- |
|
|
ELEKTA HOLDINGS LIMITED |
02699176 |
30.04.2013 |
N |
|
|
ELEKTA LIMITED |
03244454 |
30.04.2013 |
N |
£442,470,000 |
FINANCIAL INFORMATION
Profit & Loss
|
Date Of Accounts |
30/04/13 |
(%) |
30/04/12 |
(%) |
30/04/11 |
(%) |
30/04/10 |
(%) |
30/04/09 |
|
Weeks |
52 |
(%) |
52 |
(%) |
52 |
(%) |
52 |
(%) |
52 |
|
Currency |
GBP |
(%) |
GBP |
(%) |
GBP |
(%) |
GBP |
(%) |
GBP |
|
Consolidated A/cs |
N |
(%) |
N |
(%) |
N |
(%) |
N |
(%) |
N |
|
Turnover |
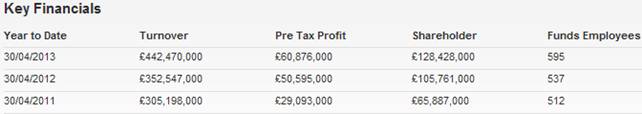
£442,470,000 |
25.5% |
£352,547,000 |
15.5% |
£305,198,000 |
14.4% |
£266,820,000 |
22.2% |
£218,295,000 |
|
Export |
- |
- |
- |
- |
- |
- |
- |
- |
- |
|
Cost of Sales |
£285,318,000 |
29.2% |
£220,892,000 |
11.7% |
£197,716,000 |
18.2% |
£167,295,000 |
23.9% |
£135,000,000 |
|
Gross Profit |
£157,152,000 |
19.4% |
£131,655,000 |
22.5% |
£107,482,000 |
8% |
£99,525,000 |
19.5% |
£83,295,000 |
|
Wages & Salaries |
£34,474,000 |
12.4% |
£30,663,000 |
5.2% |
£29,151,000 |
14% |
£25,578,000 |
10.2% |
£23,215,000 |
|
Directors Emoluments |
£1,113,000 |
94.2% |
£573,000 |
4.4% |
£549,000 |
24.5% |
£441,000 |
3% |
£428,000 |
|
Operating Profit |
£62,521,000 |
19.9% |
£52,130,000 |
72.9% |
£30,158,000 |
-10.8% |
£33,805,000 |
48% |
£22,847,000 |
|
Depreciation |
£2,773,000 |
28.6% |
£2,157,000 |
24.8% |
£1,728,000 |
1.2% |
£1,708,000 |
16.3% |
£1,468,000 |
|
Audit Fees |
£76,000 |
-27.6% |
£105,000 |
12.9% |
£93,000 |
3.3% |
£90,000 |
9.8% |
£82,000 |
|
Interest Payments |
£1,767,000 |
9.3% |
£1,617,000 |
46.3% |
£1,105,000 |
48.1% |
£746,000 |
-69.5% |
£2,445,000 |
|
Pre Tax Profit |
£60,876,000 |
20.3% |
£50,595,000 |
73.9% |
£29,093,000 |
-12.1% |
£33,083,000 |
59.4% |
£20,751,000 |
|
Taxation |
-£13,209,000 |
-23.2% |
-£10,721,000 |
-51.3% |
-£7,087,000 |
22% |
-£9,085,000 |
-128.3% |
-£3,979,000 |
|
Profit After Tax |
£47,667,000 |
19.5% |
£39,874,000 |
81.2% |
£22,006,000 |
-8.3% |
£23,998,000 |
43.1% |
£16,772,000 |
|
Dividends Payable |
£25,000,000 |
- |
- |
- |
- |
-100% |
£25,000,000 |
- |
- |
|
Retained Profit |
£22,667,000 |
-43.2% |
£39,874,000 |
81.2% |
£22,006,000 |
999.9% |
-£1,002,000 |
-106% |
£16,772,000 |
Balance Sheet
|
Date Of Accounts |
30/04/13 |
(%) |
30/04/12 |
(%) |
30/04/11 |
(%) |
30/04/10 |
(%) |
30/04/09 |
|
Tangible Assets |
£11,975,000 |
-11.1% |
£13,466,000 |
29.7% |
£10,381,000 |
24.3% |
£8,349,000 |
-2.2% |
£8,541,000 |
|
Intangible Assets |
£9,602,000 |
-10.2% |
£10,687,000 |
164% |
£4,048,000 |
-15% |
£4,763,000 |
-13.1% |
£5,478,000 |
|
Total Fixed Assets |
£21,577,000 |
-10.7% |
£24,153,000 |
67.4% |
£14,429,000 |
10% |
£13,112,000 |
-6.5% |
£14,019,000 |
|
Stock |
£38,561,000 |
52.6% |
£25,270,000 |
24.2% |
£20,347,000 |
-13.2% |
£23,447,000 |
26.6% |
£18,527,000 |
|
Trade Debtors |
£83,898,000 |
85% |
£45,346,000 |
-23.7% |
£59,452,000 |
40.3% |
£42,373,000 |
25.1% |
£33,863,000 |
|
Cash |
£44,998,000 |
- |
0 |
- |
0 |
- |
0 |
- |
0 |
|
Other Debtors |
£162,779,000 |
18.8% |
£137,031,000 |
35.9% |
£100,835,000 |
10.8% |
£90,970,000 |
16.6% |
£78,049,000 |
|
Miscellaneous Current
Assets |
0 |
- |
0 |
- |
0 |
- |
0 |
- |
0 |
|
Total Current Assets |
£330,236,000 |
59% |
£207,647,000 |
15% |
£180,634,000 |
15.2% |
£156,790,000 |
20.2% |
£130,439,000 |
|
Trade Creditors |
£62,982,000 |
65.3% |
£38,094,000 |
48.5% |
£25,654,000 |
18.6% |
£21,633,000 |
-14.1% |
£25,174,000 |
|
Bank Loans &
Overdrafts |
0 |
-100% |
£2,216,000 |
-63.3% |
£6,046,000 |
4% |
£5,811,000 |
447.2% |
£1,062,000 |
|
Other Short Term Finance |
£51,578,000 |
58.7% |
£32,506,000 |
13.9% |
£28,544,000 |
-19.3% |
£35,386,000 |
3.7% |
£34,107,000 |
|
Miscellaneous Current
Liabilities |
£93,652,000 |
147.2% |
£37,886,000 |
-28.9% |
£53,298,000 |
13.1% |
£47,132,000 |
103.5% |
£23,165,000 |
|
Total Current
Liabilities |
£208,212,000 |
88.1% |
£110,702,000 |
-2.5% |
£113,542,000 |
3.3% |
£109,962,000 |
31.7% |
£83,508,000 |
|
Bank Loans &
Overdrafts and LTL |
£15,173,000 |
-13.6% |
£17,553,000 |
-19% |
£21,680,000 |
-0.9% |
£21,870,000 |
27.7% |
£17,129,000 |
|
Other Long Term Finance |
£13,500,000 |
- |
£13,500,000 |
- |
£13,500,000 |
- |
£13,500,000 |
- |
£13,500,000 |
|
Total Long Term
Liabilities |
£15,173,000 |
-1.1% |
£15,337,000 |
-1.9% |
£15,634,000 |
-2.6% |
£16,059,000 |
0% |
£16,067,000 |
Capital & Reserves
|
Date Of Accounts |
30/04/13 |
(%) |
30/04/12 |
(%) |
30/04/11 |
(%) |
30/04/10 |
(%) |
30/04/09 |
|
Called Up Share Capital |
£22,201,000 |
- |
£22,201,000 |
- |
£22,201,000 |
- |
£22,201,000 |
- |
£22,201,000 |
|
P & L Account
Reserve |
£106,227,000 |
27.1% |
£83,560,000 |
91.3% |
£43,686,000 |
101.5% |
£21,680,000 |
-4.4% |
£22,682,000 |
|
Revaluation Reserve |
- |
- |
- |
- |
- |
- |
- |
- |
- |
|
Sundry Reserves |
- |
- |
- |
- |
- |
- |
- |
- |
- |
|
Shareholder Funds |
£128,428,000 |
21.4% |
£105,761,000 |
60.5% |
£65,887,000 |
50.1% |
£43,881,000 |
-2.2% |
£44,883,000 |
Other Financial Items
|
Date Of Accounts |
30/04/13 |
(%) |
30/04/12 |
(%) |
30/04/11 |
(%) |
30/04/10 |
(%) |
30/04/09 |
|
Net Worth |
£118,826,000 |
25% |
£95,074,000 |
53.7% |
£61,839,000 |
58.1% |
£39,118,000 |
-0.7% |
£39,405,000 |
|
Working Capital |
£122,024,000 |
25.9% |
£96,945,000 |
44.5% |
£67,092,000 |
43.3% |
£46,828,000 |
-0.2% |
£46,931,000 |
|
Total Assets |
£351,813,000 |
51.8% |
£231,800,000 |
18.8% |
£195,063,000 |
14.8% |
£169,902,000 |
17.6% |
£144,458,000 |
|
Total Liabilities |
£223,385,000 |
77.2% |
£126,039,000 |
-2.4% |
£129,176,000 |
2.5% |
£126,021,000 |
26.6% |
£99,575,000 |
|
Net Assets |
£128,428,000 |
21.4% |
£105,761,000 |
60.5% |
£65,887,000 |
50.1% |
£43,881,000 |
-2.2% |
£44,883,000 |
Cash Flow
|
Date Of Accounts |
30/04/13 |
(%) |
30/04/12 |
(%) |
30/04/11 |
(%) |
30/04/10 |
(%) |
30/04/09 |
|
Net Cashflow
from Operations |
- |
- |
- |
- |
- |
- |
- |
- |
- |
|
Net Cashflow
before Financing |
- |
- |
- |
- |
- |
- |
- |
- |
- |
|
Net Cashflow
from Financing |
- |
- |
- |
- |
- |
- |
- |
- |
- |
|
Increase in Cash |
- |
- |
- |
- |
- |
- |
- |
- |
- |
Miscellaneous
|
Date Of Accounts |
30/04/13 |
(%) |
30/04/12 |
(%) |
30/04/11 |
(%) |
30/04/10 |
(%) |
30/04/09 |
|
Contingent Liability |
YES |
- |
YES |
- |
YES |
- |
YES |
- |
YES |
|
Capital Employed |
£143,601,000 |
18.6% |
£121,098,000 |
48.5% |
£81,521,000 |
36% |
£59,940,000 |
-1.7% |
£60,950,000 |
|
Number of Employees |
595 |
10.8% |
537 |
4.9% |
512 |
4.9% |
488 |
5.2% |
464 |
|
Auditors |
PRICEWATERHOUSECOOPERS LLP |
||||||||
|
Auditor Comments |
The audit report contains no adverse comments |
||||||||
|
Bankers |
HSBC BANK PLC |
||||||||
|
Bank Branch Code |
|
||||||||
Ratios
|
Date Of Accounts |
30/04/13 |
30/04/12 |
30/04/11 |
30/04/10 |
30/04/09 |
|
Pre-tax profit margin % |
13.76 |
14.35 |
9.53 |
12.40 |
9.51 |
|
Current ratio |
1.59 |
1.88 |
1.59 |
1.43 |
1.56 |
|
Sales/Net Working
Capital |
3.63 |
3.64 |
4.55 |
5.70 |
4.65 |
|
Gearing % |
11.80 |
16.60 |
32.90 |
49.80 |
38.20 |
|
Equity in % |
37.50 |
47.80 |
34.50 |
26.60 |
32.30 |
|
Creditor Days |
51.81 |
39.33 |
30.59 |
29.51 |
41.97 |
|
Debtor Days |
69.01 |
46.81 |
70.90 |
57.80 |
56.46 |
|
Liquidity/Acid Test |
1.40 |
1.64 |
1.41 |
1.21 |
1.34 |
|
Return On Capital
Employed % |
42.39 |
41.78 |
35.68 |
55.19 |
34.04 |
|
Return On Total Assets
Employed % |
17.30 |
21.82 |
14.91 |
19.47 |
14.36 |
|
Current Debt Ratio |
1.62 |
1.04 |
1.72 |
2.50 |
1.86 |
|
Total Debt Ratio |
1.73 |
1.19 |
1.96 |
2.87 |
2.21 |
|
Stock Turnover Ratio % |
8.71 |
7.16 |
6.66 |
8.78 |
8.48 |
|
Return on Net Assets
Employed % |
47.40 |
47.83 |
44.15 |
75.39 |
46.23 |
FOREIGN EXCHANGE RATES
N/A
ADDITIONAL INFORMATION
Status History
|
No Status History found. |
Event History
|
Date |
Description |
|
16/10/2013 |
New Accounts Filed |
|
16/10/2013 |
New Accounts Filed |
|
13/09/2013 |
Annual Returns |
|
15/03/2013 |
New Board Member Mr D.I.
Alexander appointed |
|
15/03/2013 |
New Board Member Mr T.T.
Beazley appointed |
|
12/03/2013 |
Ms C.G. Regan has
resigned as company secretary |
|
12/03/2013 |
New Board Member Mr S.M.
Wort appointed |
|
12/03/2013 |
New Company Secretary
Mrs S. Cookman appointed |
|
13/12/2012 |
New Accounts Filed |
|
13/12/2012 |
New Accounts Filed |
|
14/09/2012 |
Annual Returns |
|
26/07/2012 |
Mr L.O. Sanden has left the
board |
|
04/05/2012 |
Mr J.R. Boyman has left the board |
|
04/05/2012 |
New Board Member Mr W.D.
Yaeger appointed |
|
24/10/2011 |
New Board Member Mr L.H.
Schaefer appointed |
Previous Company Names
|
Date |
Previous Name |
|
22/07/2003 |
ELEKTA ONCOLOGY SYSTEMS
LTD |
|
30/01/1997 |
REFAL 496 LIMITED |
Other Linked companies
|
Number |
Latest Key
Financials |
||
|
ELEKTA
S.P.A. |
MI1972717 |
30.04.2012 |
€38,428,806 |
|
ELEKTA
INSTRUMENT AB |
5564920949 |
30.04.2013 |
1,473,717 KSEK |
|
ELEKTA
|
414404913 |
30.04.2013 |
€30,029,933 |
|
MEDICAL INTELLIGENCE
MEDIZINTECHNIK GMBH |
HRB 14835 |
30.04.2013 |
€32,012,550 |
|
ELEKTA
B.V. |
17097384 |
30.04.2013 |
|
|
3D LINE RESEARCH AND
DEVELOPMENT S.R.L. |
MI1843687 |
31.12.2011 |
€2,856,160 |
|
NUCLETRON B.V. |
30085856 |
- |
|
|
ELEKTA
MEDICAL |
41472 |
30.04.2013 |
€25,127,863 |
|
ELEKTA
NV |
460510369 |
30.04.2013 |
€8,440,639 |
|
DELFT INSTRUMENTS GMBH |
|
- |
|
|
ELEKTA
ASIA LTD |
|
- |
|
|
ELEKTA BMEI (BEIJING) MEDICAL
EQUIPMENT CO LTD |
|
- |
|
|
ELEKTA CANADA INC |
|
- |
|
|
ELEKTA
FINANCE |
|
- |
|
|
ELEKTA
GMBH |
|
- |
|
|
ELEKTA
HELLAS EPE |
|
- |
|
|
ELEKTA HOLDING LIMITED |
|
- |
|
|
ELEKTA HOLDING US INC |
|
- |
|
|
ELEKTA
INSTRUMENT (SHANGHAI) LTD |
|
- |
|
|
ELEKTA
KFT |
|
- |
|
NOTES & COMMENTS
COMMENTARY
|
No exact match CCJs are recorded against the company. |
|
Sales in the latest
trading period increased 25.5% on the previous trading period. |
|
Net Worth increased by
25% during the latest trading period. |
|
A 51.8% growth in Total
Assets occurred during the latest trading period. |
|
Pre-tax profits
increased by 20.3% compared to the previous trading period. |
|
The audit report contains
no adverse comments. |
|
The company has
undergone recent changes in its directorships. |
|
The company is part of a
group. |
|
The company was
established over 17 years ago. |
FOREIGN EXCHANGE RATES
|
Currency |
Unit
|
Indian Rupees |
|
US Dollar |
1 |
Rs.60.77 |
|
|
1 |
Rs.100.72 |
|
Euro |
1 |
Rs.80.55 |
INFORMATION DETAILS
|
Analysis Done by
: |
SUB |
|
|
|
|
Report Prepared
by : |
TPT |
RATING EXPLANATIONS
|
RATING |
STATUS |
PROPOSED CREDIT LINE |
|
|
>86 |
Aaa |
Possesses an extremely sound financial base with the strongest
capability for timely payment of interest and principal sums |
Unlimited |
|
71-85 |
Aa |
Possesses adequate working capital. No caution needed for credit
transaction. It has above average (strong) capability for payment of interest
and principal sums |
Large |
|
56-70 |
A |
Financial & operational base are regarded healthy. General unfavourable factors will not cause fatal effect.
Satisfactory capability for payment of interest and principal sums |
Fairly Large |
|
41-55 |
Ba |
Overall
operation is considered normal. Capable to meet normal commitments. |
Satisfactory |
|
26-40 |
B |
Capability to overcome financial difficulties seems comparatively below
average. |
Small |
|
11-25 |
Ca |
Adverse factors are apparent. Repayment of interest and principal sums
in default or expected to be in default upon maturity |
Limited with
full security |
|
<10 |
C |
Absolute credit risk exists. Caution needed to be exercised |
Credit not
recommended |
|
-- |
NB |
New Business |
-- |
This score serves as a reference to assess SC’s credit risk and
to set the amount of credit to be extended. It is calculated from a composite
of weighted scores obtained from each of the major sections of this report. The
assessed factors and their relative weights (as indicated through %) are as
follows:
Financial
condition (40%) Ownership
background (20%) Payment
record (10%)
Credit history
(10%) Market trend
(10%) Operational
size (10%)
This report is issued at your request without any
risk and responsibility on the part of MIRA INFORM PRIVATE LIMITED (MIPL)
or its officials.