MIRA
INFORM REPORT
|
Report Date : |
25.08.2014 |
IDENTIFICATION DETAILS
|
Name : |
PERSTORP WASPIK B.V. |
|
|
|
|
Registered Office : |
Industrieweg 8, 5165NH Waspik |
|
|
|
|
Country : |
|
|
|
|
|
Financials (as on) : |
31.12.2013 |
|
|
|
|
Date of Incorporation : |
01.10.1977 |
|
|
|
|
Com. Reg. No.: |
KvK-nummer: 18116759 |
|
|
|
|
Legal Form : |
Besloten Vennootschap |
|
|
|
|
Line of Business : |
Manufacture of pharmaceutical preparations |
|
|
|
|
No. of Employees : |
32 |
RATING & COMMENTS
|
MIRA’s Rating : |
Ba |
|
RATING |
STATUS |
PROPOSED CREDIT LINE |
|
|
41-55 |
Ba |
Overall operation is considered normal. Capable to meet normal
commitments. |
Satisfactory |
|
Status : |
Satisfactory |
|
Payment Behaviour : |
No complaints |
|
Litigation : |
Clear |
NOTES :
Any query related to this report can be made
on e-mail : infodept@mirainform.com
while quoting report number, name and date.
ECGC Country Risk Classification List – June 01, 2014
|
Country Name |
Previous Rating (31.03.2014) |
Current Rating (01.06.2014) |
|
|
A1 |
A1 |
|
Risk Category |
ECGC
Classification |
|
Insignificant |
A1 |
|
Low Risk |
A2 |
|
Moderate Low Risk |
B1 |
|
Moderate Risk |
B2 |
|
Moderate High Risk |
C1 |
|
High Risk |
C2 |
|
Very High Risk |
D |
|
Source
: CIA |
Summary
|
Company name |
Perstorp Waspik B.V. |
|
|
Operative address |
Industrieweg 8 5165NH Waspik
|
|
|
Legal form |
Besloten
Vennootschap |
|
|
Registration number |
KvK-nummer:
18116759 |
|
|
VAT-number |
004441072 |
|
|
Year |
2013 |
|
Mutation |
2012 |
|
Mutation |
2011 |
|
Fixed assets |
3.208 |
|
-99,89 |
2.873.000 |
|
21,74 |
2.360.000 |
|
Total receivables |
4.422 |
4 |
-99,88 |
3.621.000 |
|
-8,47 |
3.956.000 |
|
|
|||||||
|
Total equity |
3.909 |
|
-99,87 |
2.907.000 |
|
20,92 |
2.404.000 |
|
Short term liabilities |
5.518 |
|
-99,89 |
5.252.000 |
|
4,56 |
5.023.000 |
|
|
|||||||
|
Net result |
|
|
-100,00 |
503.000 |
t |
65,46 |
304.000 |
|
|
|||||||
|
Working capital |
851 |
|
-99,75 |
334.000 |
|
-64,84 |
950.000 |
|
Quick ratio |
0,83 |
|
15,28 |
0,72 |
|
-12,20 |
0,82 |
Contact information
Company name Perstorp
Waspik B.V.
Trade names Franklin
Products International
Perstorp Waspik B.V.
Perstorp Waspik B.V.
FPI
FPI
Perstorp Franklin
Perstorp Franklin
Operative address Industrieweg
8
5165NH Waspik
Correspondence address Postbus
10
5165ZG Waspik
Telephone number 0416317700
Fax number 0416316698
Email address info@perstorpfeed.com
Website www.perstorpfeed.com
Registration
Registration number KvK-nummer:
18116759
Branch number
000018616534
VAT-number 004441072
Status Active
Memorandum 1978-02-22
Establishment date 1977-10-01
Legal form Besloten
Vennootschap
Last proposed admendment 2007-10-01
Activities
SBI Manufacture
of pharmaceutical preparations (212)
Manufacture
of pharmaceutical preparations (2120)
Manufacture
of pharmaceutical products, no raw (212001)
Exporter No
Importer No
Branche organisations BMD
Advies Rijndelta
Nefato
(Verengiging van Nederlandse Fabrikanten van Voedertoevoegingen)
Goal De
fabricage van- en groothandel in diergenees- kundige preparaten en
veevoederadditieven, alsmede
de fabricage en productie van- en groothandel in mengsels
van zuren
relations
Shareholders Perstorp
Holding B.V.
Schoolstraat 1
2912CP NIEUWERKERK AD
Registration number: 340892500000
Percentage: 100%
Management
H.C.M. Peijnenburg (Henricus
Cornelis Maria)
Competence: Jointly authorized
Function: Manager
Starting date: 2007-11-01
Date of birth: 1969-09-27, Esch,
NL
H.C.M. Peijnenburg (Henricus
Cornelis Maria)
Competence: Jointly authorized
Function: Manager
Starting date: 2007-11-01
Date of birth: 1969-09-27,
Esch, NL
M. Grönborg (Marie)
Competence: Jointly authorized
Function: Manager
Starting date: 2013-01-01
Date of birth: 1970-09-03,
Varberg, SE
M. Grönborg (Marie)
Competence: Jointly authorized
Function: Manager
Starting date: 2013-01-01
Date of birth: 1970-09-03,
Varberg, SE
R. Kuiper (Rudy)
Competence: Jointly authorized
Function: Manager
Starting date: 2013-04-01
Date of birth: 1968-06-20,
Active management
R. Kuiper (Rudy)
Competence: Jointly authorized
Function: Manager
Starting date: 2013-04-01
Date of birth: 1968-06-20,
Employees
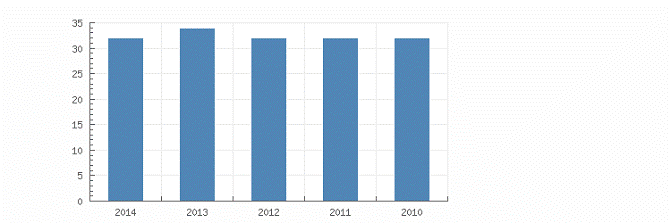
Year 2014
2013 2012 2011 2010
Total 32
34 32 32 32
Payments
Description Payments made under regular
condition
Key figures
|
Year |
2013 |
2012 |
2011 |
2010 |
2009 |
|
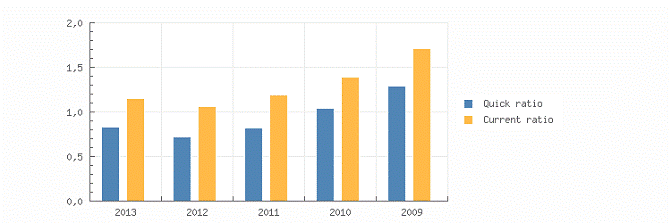
Quick ratio |
0,83 |
0,72 |
0,82 |
1,04 |
1,29 |
|
Current ratio |
1,15 |
1,06 |
1,19 |
1,39 |
1,71 |
|
|
|||||
|
Working capital/ balance
total |
0,09 |
0,04 |
0,11 |
0,19 |
0,29 |
|
Equity / balance total |
0,41 |
0,34 |
0,29 |
0,44 |
0,51 |
|
Equity / Fixed assets |
1,22 |
1,01 |
1,02 |
1,44 |
1,74 |
|
Equity / liabilities |
0,69 |
0,52 |
0,41 |
0,79 |
1,06 |
|
Balance total / liabilities |
1,69 |
1,52 |
1,41 |
1,79 |
2,06 |
|
|
|||||
|
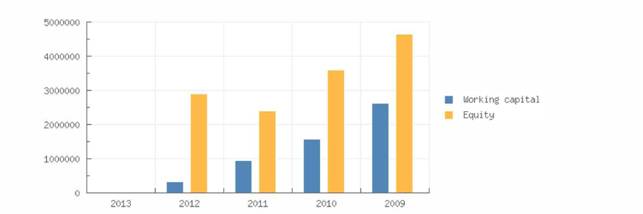
Working capital |
851 |
334.000 |
950.000 |
1.585.000 |
2.636.000 |
|
Equity |
3.909 |
2.907.000 |
2.404.000 |
3.600.000 |
4.651.000 |
|
Mutation equity |
-99,87 |
20,92 |
-33,22 |
-22,60 |
12,67 |
|
Mutation short term
liabilities |
-99,89 |
4,56 |
23,23 |
9,07 |
-4,91 |
|
|
|||||
|
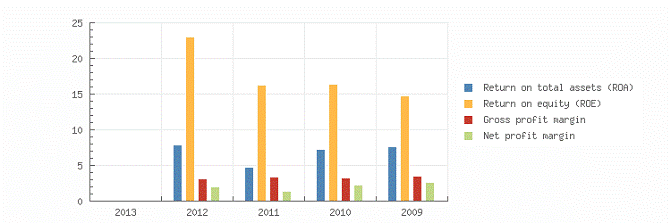
Return on total assets (ROA) |
|
7,92 |
4,70 |
7,21 |
7,60 |
|
Return on equity (ROE) |
|
23,05 |
16,31 |
16,33 |
14,77 |
|
Gross profit margin |
|
3,07 |
3,36 |
3,28 |
3,48 |
|
Net profit margin |
|
1,94 |
1,34 |
2,26 |
2,61 |
|
|
|||||
|
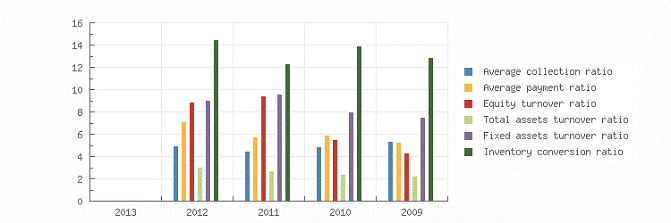
Average collection ratio |
|
4,94 |
4,52 |
4,88 |
5,37 |
|
Average payment ratio |
|
7,16 |
5,73 |
5,91 |
5,29 |
|
Equity turnover ratio |
|
8,92 |
9,43 |
5,53 |
4,31 |
|
Total assets turnover ratio |
|
3,07 |
2,72 |
2,44 |
2,22 |
|
Fixed assets turnover ratio |
|
9,03 |
9,61 |
7,97 |
7,51 |
|
Inventory conversion ratio |
|
14,49 |
12,31 |
13,91 |
12,90 |
|
|
|||||
|
Turnover |
|
25.941.000 |
22.681.000 |
19.897.000 |
20.056.000 |
|
Gross margin |
|
5.833.000 |
4.985.000 |
4.766.000 |
4.932.000 |
|
Operating result |
|
797.000 |
763.000 |
653.000 |
697.000 |
|
Net result after taxes |
|
503.000 |
304.000 |
449.000 |
523.000 |
|
Year |
2013 2012 |
2011 |
2010 |
2009 |
|
|
||||
|
Cashflow |
868.000 |
652.000 |
812.000 |
878.000 |
|
Gross profit |
|
22.681.000 |
19.897.000 |
20.056.000 |
|
EBIT |
797.000 |
763.000 |
653.000 |
697.000 |
|
EBITDA |
1.162.000 |
1.111.000 |
1.016.000 |
1.052.000 |
Summary
The 2013 financial result structure is a postive working
captial of 851 euro, which is in
agreement with 9 % of the total assets of the company.
The working capital has diminished with -99.75 % compared
to previous year. The ratio, with
respect to the total assets of the company has however,
increased.
The deterioration between 2012 and 2013 has been caused by
a current assets reduction
and current liabilities increase.
The current ratio of the company in 2013 was 1.15. When
the current ratio is below 1.5, the
company may have problems meeting its short-term
obligations.
The quick ratio in 2013 of the company was 0.83. A company
with a Quick Ratio of less than
1 cannot currently pay back its current liabilities.
The 2012 financial result structure is a postive working
captial of 334.000 euro, which is in
agreement with 4 % of the total assets of the company.
The working capital has diminished with -64.84 % compared
to previous year. The ratio, with
respect to the total assets of the company has however,
declined.
The deterioration between 2011 and 2012 has mainly been
caused by an increase of the
current liabilities.
The current ratio of the company in 2012 was 1.06. When
the current ratio is below 1.5, the
company may have problems meeting its short-term
obligations.
The quick ratio in 2012 of the company was 0.72. A company
with a Quick Ratio of less than
1 cannot currently pay back its current liabilities
Financial statement
Remark annual account The
company is obliged to file its financial statements.
Type of annual account Corporate
Annual account Perstorp
Waspik B.V.
Industrieweg 8
5165NH Waspik
Registration number: 181167590000
Balance
|
Year |
2013 |
2012 |
2011 |
2010 |
2009 |
|
End date |
2013-12-31 |
2012-12-31 |
2011-12-31 |
2010-12-31 |
2009-12-31 |
|
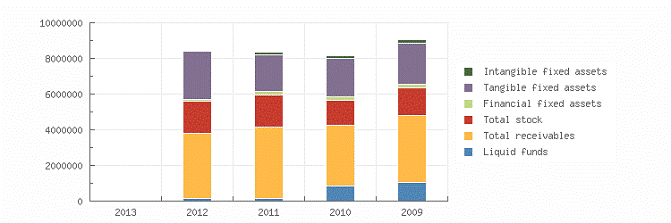
Intangible fixed assets |
19 |
65.000 |
112.000 |
158.000 |
204.000 |
|
Tangible fixed assets |
3.061 |
2.680.000 |
2.082.000 |
2.172.000 |
2.270.000 |
|
Financial fixed assets |
128 |
128.000 |
166.000 |
166.000 |
197.000 |
|
Fixed assets |
3.208 |
2.873.000 |
2.360.000 |
2.496.000 |
2.671.000 |
|
Total stock |
1.772 |
1.790.000 |
1.843.000 |
1.430.000 |
1.555.000 |
|
Accounts receivable |
|
3.200.000 |
3.739.000 |
3.094.000 |
3.282.000 |
|
Other receivables |
|
421.000 |
217.000 |
275.000 |
509.000 |
|
Total receivables |
4.422 |
3.621.000 |
3.956.000 |
3.369.000 |
3.791.000 |
|
Liquid funds |
175 |
175.000 |
174.000 |
862.000 |
1.027.000 |
|
Current assets |
6.369 |
5.586.000 |
5.973.000 |
5.661.000 |
6.373.000 |
|
Total assets |
9.577 |
8.459.000 |
8.333.000 |
8.157.000 |
9.044.000 |
|
|
|||||
|
Issued capital |
19 |
19.000 |
19.000 |
19.000 |
19.000 |
|
Other reserves |
3.890 |
2.385.000 |
2.081.000 |
3.132.000 |
4.109.000 |
|
Non-distributable profit |
|
503.000 |
304.000 |
449.000 |
523.000 |
|
Total reserves |
3.890 |
2.888.000 |
2.385.000 |
3.581.000 |
4.632.000 |
|
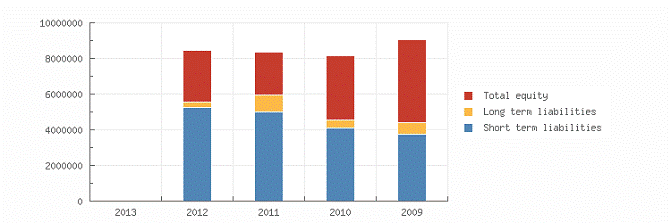
Total equity |
3.909 |
2.907.000 |
2.404.000 |
3.600.000 |
4.651.000 |
|
|
|||||
|
Long term interest yielding
debt |
150 |
300.000 |
906.000 |
481.000 |
656.000 |
|
Long term liabilities |
150 |
300.000 |
906.000 |
481.000 |
656.000 |
|
Accounts payable |
|
831.000 |
822.000 |
631.000 |
1.055.000 |
|
Other short term liabilities |
|
4.421.000 |
4.201.000 |
3.445.000 |
2.682.000 |
|
Short term liabilities |
5.518 |
5.252.000 |
5.023.000 |
4.076.000 |
3.737.000 |
|
Total short and long term liabilities |
5.668 |
5.552.000 |
5.929.000 |
4.557.000 |
4.393.000 |
|
Total liabilities |
9.577 |
8.459.000 |
8.333.000 |
8.157.000 |
9.044.000 |
Summary
The total assets of the company decreased with -99.89 %
between 2012 and 2013.
Assets reduction is explained by a Net Worth decrease of
-99.87 %, and an indebtedness
reduction of -99.9 %.
In 2013 the assets of the company were 33.5 % composed of
fixed assets and 66.5 % by
current assets. The assets are being financed by an equity
of 40.82 %, and total debt of
59.18 %.
The total assets of the company increased with 1.51 %
between 2011 and 2012.
The total asset increase is retrievable in the fixed asset
growth of 21.74 %.
The assets growth has been financed by a Net Worth
increase of 20.92 %. The company's
net increase has also covered a reduction of -6.36 % of
the company's indebtedness.
In 2012 the assets of the company were 33.96 % composed of
fixed assets and 66.04 % by
current assets. The assets are being financed by an equity
of 34.37 %, and total debt of
65.63 %.
Profit and loss
|
Year |
2012 |
2011 |
2010 |
2009 |
|
|
Revenues |
25.941.000 |
23.179.000 |
20.260.000 |
20.271.000 |
|
|
Other operating income |
|
498.000 |
363.000 |
215.000 |
|
|
Net turnover |
|
25.941.000 |
22.681.000 |
19.897.000 |
20.056.000 |
|
|
|||||
|
Gross margin |
|
5.833.000 |
4.985.000 |
4.766.000 |
4.932.000 |
|
|
|||||
|
Wages and salaries |
1.656.000 |
1.574.000 |
1.457.000 |
1.405.000 |
|
|
Amorization and depreciation |
365.000 |
348.000 |
363.000 |
355.000 |
|
|
Sales |
20.108.000 |
17.696.000 |
15.131.000 |
15.124.000 |
|
|
other operating costs |
3.015.000 |
2.798.000 |
2.656.000 |
2.690.000 |
|
|
Operating expenses |
25.144.000 |
22.416.000 |
19.607.000 |
19.574.000 |
|
|
Operating result |
|
797.000 |
763.000 |
653.000 |
697.000 |
|
|
|||||
|
Financial income |
|
4.000 |
1.000 |
12.000 |
|
|
Financial expenses |
127.000 |
375.000 |
66.000 |
22.000 |
|
|
Financial result |
-127.000 |
-371.000 |
-65.000 |
-10.000 |
|
|
Result on ordinary operations before taxes |
|
670.000 |
392.000 |
588.000 |
687.000 |
|
|
|||||
|
Taxation on the result of
ordinary activities |
167.000 |
88.000 |
139.000 |
164.000 |
|
|
Result of ordinary activities after taxes |
|
503.000 |
304.000 |
449.000 |
523.000 |
|
Year |
|
2012 |
2011 |
2010 |
2009 |
|
Net result |
|
503.000 |
304.000 |
449.000 |
523.000 |
Summary
The
turnover of the company grew with 14.37 % between 2011 and 2012.
The gross profit of the company grew with 17.01 % between
2011 and 2012.
The operating result of the company grew with 4.46 %
between 2011 and 2012. This
evolution implies an increase of the company's economic
profitability.
The result of these changes is an increase of the
company's Economic Profitability of 68.51
% of the analysed period, being equal to 2011 % in the
year 2012.
This growth has contributed to the increase in assets
turnover, increasing by 12.87 %
reaching 3.07.
The Net Result of the company decreased by 65.46 % between
2011 and 2012.
The company's Financial Profitability has been negatively
affected by the financial activities in
comparison to the EBITs behaviour. The result of these
variations is a profitability reduction
of 41.32 % of the analysed period, being 23.05 % in the
year 2012.
The company's financial structure has slowed down its
financial profitability
Analysis
Branch (SBI) Manufacture of basic
pharmaceutical products and pharmaceutical preparations (21)
Region Midden-Brabant
In the
In the region Midden-Brabant 17 of the companies are
registered with the SBI code 21
In the
In the region Midden-Brabant 1 of the bankruptcies are
published within this sector
The risk of this specific sector in the
The risk of this specific sector in the region
Midden-Brabant is normal
Publications
Filings 26-03-2013:
De jaarrekening over 2012 is gepubliceerd.
23-05-2012: De jaarrekening
over 2011 is gepubliceerd.
06-12-2011: De jaarrekening
over 2010 is gepubliceerd.
10-06-2010: De jaarrekening
over 2009 is gepubliceerd.
19-01-2010: De jaarrekening
over 2008 is gepubliceerd.
Functions 18-07-2014:
Per 01-06-2014 is bestuurder Maria Helana Cerine Haglund uit functie getreden.
25-03-2014: Per 01-02-2014 is
bestuurder Eva-Brita Valter uit functie getreden.
04-04-2013: Per 03-04-2013 is
bestuurder Leendert Muis uit functie getreden.
03-04-2013: Per 01-04-2013 is
bestuurder Rudy Kuiper in functie getreden.
16-01-2013: Per 01-01-2013 is
bestuurder Marie Grönborg in functie getreden.
05-11-2012: Per 02-11-2012 is
bestuurder Eva-Brita Valter in functie getreden.
01-05-2012: Per 19-04-2012 is
bestuurder Paul Österberg uit functie getreden.
15-10-2010: Per 07-09-2010 is
bestuurder Gunnar Modalen uit functie getreden.
Other 16-08-2012:
... Datum deponering: 15-08-2012 Soort deponering: Geconsolideerde
jaarrekening
408.
08-12-2011:
Datum deponering: 08-12-2011 Soort deponering: Geconsolideerde
jaarrekening
408.
FOREIGN EXCHANGE RATES
|
Currency |
Unit
|
Indian Rupees |
|
US Dollar |
1 |
Rs.60.43 |
|
|
1 |
Rs.100.23 |
|
Euro |
1 |
Rs.80.35 |
INFORMATION DETAILS
|
Analysis Done by
: |
DIV |
|
|
|
|
Report Prepared
by : |
PDT |
RATING EXPLANATIONS
|
RATING |
STATUS |
PROPOSED CREDIT LINE |
|
|
|
>86 |
Aaa |
Possesses an extremely sound financial base with the strongest
capability for timely payment of interest and principal sums |
Unlimited |
|
|
71-85 |
Aa |
Possesses adequate working capital. No caution needed for credit
transaction. It has above average (strong) capability for payment of interest
and principal sums |
Large |
|
|
56-70 |
A |
Financial & operational base are regarded healthy. General
unfavourable factors will not cause fatal effect. Satisfactory capability for
payment of interest and principal sums |
Fairly Large |
|
|
41-55 |
Ba |
Overall operation is considered normal. Capable to meet normal
commitments. |
Satisfactory |
|
|
26-40 |
B |
Capability to overcome financial difficulties seems comparatively
below average. |
Small |
|
|
11-25 |
Ca |
Adverse factors are apparent. Repayment of interest and principal sums
in default or expected to be in default upon maturity |
Limited with
full security |
|
|
<10 |
C |
Absolute credit risk exists. Caution needed to be exercised |
Credit not
recommended |
|
|
-- |
NB |
New Business |
-- |
|
This score serves as a reference to assess SC’s credit risk
and to set the amount of credit to be extended. It is calculated from a
composite of weighted scores obtained from each of the major sections of this
report. The assessed factors and their relative weights (as indicated through
%) are as follows:
Financial
condition (40%) Ownership
background (20%) Payment
record (10%)
Credit history
(10%) Market trend
(10%) Operational
size (10%)
This report is issued at your request without any
risk and responsibility on the part of MIRA INFORM PRIVATE LIMITED (MIPL)
or its officials.