MIRA
INFORM REPORT
|
Report Date : |
26.08.2014 |
IDENTIFICATION DETAILS
|
Name : |
FUNTACY ICY DELIGHTS PRIVATE LIMITED |
|
|
|
|
Registered
Office : |
H. No.505, Vollant, Satrant, Cortalim, Mormugao – 403710, |
|
|
|
|
Country : |
|
|
|
|
|
Date of
Incorporation : |
16.01.2014 |
|
|
|
|
Com. Reg. No.: |
24-007407 |
|
|
|
|
Capital
Investment / Paid-up Capital : |
Rs. 0.100 Million |
|
|
|
|
CIN No.: [Company Identification
No.] |
U15132GA2014PTC007407 |
|
|
|
|
Legal Form : |
Private Limited Liability Company |
|
|
|
|
Line of Business
: |
Manufacturer of Ice Cream. |
|
|
|
|
No. of Employees
: |
3 (Approximately) |
RATING & COMMENTS
|
MIRA’s Rating : |
NB |
|
RATING |
STATUS |
PROPOSED CREDIT LINE |
|
|
- |
NB |
New Business |
- |
|
Status : |
New Business |
|
|
|
|
Payment Behaviour : |
Unknown |
|
|
|
|
Litigation : |
Clear |
|
|
|
|
Comments : |
Subject is a new company incorporated on 16/01/2014, and it is
establishing itself gradually. Mr. Devesh Shirodkar, Director has provided general information and also
informed that company will start its business activity from October 2014. Business is active as per status in registrar of companies. Payment
terms are unknown. The company can be considered for business dealing on a safe and
secured trade terms and conditions. |
NOTES :
Any query related to this report can be made
on e-mail : infodept@mirainform.com
while quoting report number, name and date.
ECGC Country Risk Classification List – June 1, 2014
|
Country Name |
Previous Rating (31.03.2014) |
Current Rating (01.06.2014) |
|
India |
A1 |
A1 |
|
Risk Category |
ECGC
Classification |
|
Insignificant |
A1 |
|
Low |
A2 |
|
Moderate |
B1 |
|
High |
B2 |
|
Very High |
C1 |
|
Restricted |
C2 |
|
Off-credit |
D |
INDIAN ECONOMIC OVERVIEW
N E W S
As per the latest IMF study, the total weigh of emerging markets in the
GDP of the world on a purchasing power parity basis has seen a sizeable shift. It
highlights how as against 51 % in 2005, the emerging economies now account for
close to 56 % of the global purchasing power GDP as per the latest survey. And
with the emerging economies growing at a faster rate than their developed
counterparts, there are every possibility that the their share goes up further
in the coming years. China may surpass the US over the next few years.
Politics and economics are very intricately connected. They tend to influence
each other in ways that could be very complex and far-reaching. The prospects
of the India’s economy have been seriously compromised due to political
corruption. High inflation, poor standard of living are to a great extent a
result of rampant corruption in the country. China on the other hand, seems to
be facing diametrically opposite challenge. American hedge fund manager Jim
Chanos has been keenly following the political and economic development in the
dragon economy and has figured out something that is quite worrying. He is of
the view that the Chinese economy could be heading toward trouble on account of
new Chinese President Xi Jingping’s very aggressive anti-corruption drive.
Chanos believes that many things such as apartment sales, luxury products, etc.
were largely bought with dirty money. And it is now beginning to impact
consumption. This may indeed be bad news for an economy that is struggling to
transition from an investment-driven export-oriented economy to a domestic
consumption-driven economy.
A study published by Firstpost has revealed that asset classes like real
estate and equities were the biggest beneficiaries of the liberalization
policies. A firm called Ciane Analytics studied returns from assets
including equities, gold, fixed deposits, G-Secs and real estate since 1991.
Real estate outperformed every other asset classes during the 23-year period
with an annualized return of 20 % ! Equities came in second with annualized
return of 15.5 % ! However, while these returns may seem mouthwatering, the
fact is that the return from equities adjusted for inflation came down to just
7.1 %.
Some brief news are as under
. R-Power to buy Jaypee’s hydro assets
. Investors await justice in NSEL case
. India seeks MFN status from Pakistan ahead of meeting
. Ukrain’s clashes with rebels hinder MH17 crash investigation
. India exploring merger of state-owned hydro PSUs
..Higher costs weigh down profit growth to slowest in 9 quarters
..Wal-Mart to expand wholesale business in India
. GMR group moves to strengthen balance sheet
. Central Bank to sell 4 % stake to Life Insurance Corporation
. Tata Chemicals plans to raise up to Rs 10000 mn.
RBI DEFAULTERS’ LIST STATUS
Subject’s name is not enlisted as a defaulter
in the publicly available RBI Defaulters’ list.
EPF (Employee Provident Fund) DEFAULTERS’ LIST STATUS
Subject’s name is not enlisted as a defaulter
in the publicly available EPF (Employee Provident Fund) Defaulters’ list as of
31-03-2014.
INFORMATION PARTED BY
|
Name : |
Mr. Devesh Shirodkar |
|
Designation : |
Director |
|
Contact No.: |
91-9960459000 |
|
Date : |
25.08.2014 |
LOCATIONS
|
Registered Office : |
H. No.505, Vollant, Satrant, Cortalim, Mormugao – 403710, Goa, India |
|
Tel. No. : |
91-832-2550258 |
|
Mobile No. : |
91-9960459000 (Mr. Devesh Shirodkar) |
|
Fax No. : |
Not Available |
|
E-Mail : |
|
|
|
|
|
Factory : |
L/127, 3/B Phase, Verna Electronic City, GIDC, Verna – 430709, Goa,
India |
DIRECTORS
|
Name : |
Mr. Devesh Shirodkar |
||||||||||||||||||||||||||||||||||||||||
|
Designation : |
Director |
||||||||||||||||||||||||||||||||||||||||
|
Address : |
H. No. 505, Vollant, Cortalim – 403710, Goa, India |
||||||||||||||||||||||||||||||||||||||||
|
Date of Birth/Age : |
17.04.1975 |
||||||||||||||||||||||||||||||||||||||||
|
Date of Appointment : |
16.01.2014 |
||||||||||||||||||||||||||||||||||||||||
|
DIN No. : |
00247367 |
||||||||||||||||||||||||||||||||||||||||
|
Other Directorship :
|
|||||||||||||||||||||||||||||||||||||||||
|
|
|
||||||||||||||||||||||||||||||||||||||||
|
Name : |
Mrs. Nivedita Devesh Shirodkar |
||||||||||||||||||||||||||||||||||||||||
|
Designation : |
Director |
||||||||||||||||||||||||||||||||||||||||
|
Address : |
H. No. 505, Vollant, Cortalim – 403710, Goa, India |
||||||||||||||||||||||||||||||||||||||||
|
Date of Birth/Age : |
17.10.1976 |
||||||||||||||||||||||||||||||||||||||||
|
Date of Appointment : |
16.01.2014 |
||||||||||||||||||||||||||||||||||||||||
|
DIN No. : |
06782571 |
||||||||||||||||||||||||||||||||||||||||
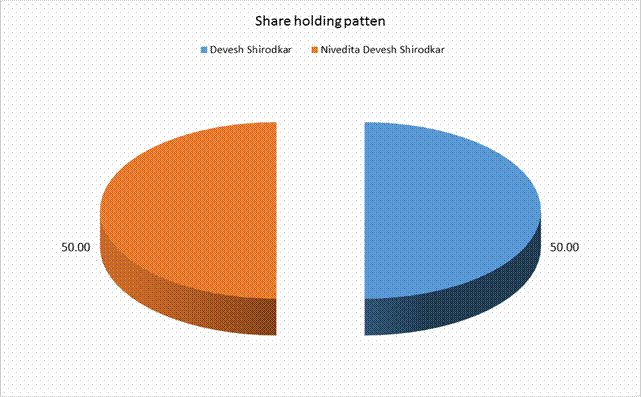
MAJOR SHAREHOLDERS / SHAREHOLDING PATTERN
As on 09.01.2014
|
Names of Shareholders |
No. of Shares |
Percentage of
Holding |
|
Devesh Shirodkar |
500 |
50.00 |
|
Nivedita Devesh Shirodkar |
500 |
50.00 |
|
Total |
1000 |
100.00 |
BUSINESS DETAILS
|
Line of Business : |
Manufacturer of Ice Cream. |
|
|
|
|
Terms : |
|
|
Selling : |
Cash and Advance Payment |
|
|
|
|
Purchasing : |
Cash and Advance Payment |
GENERAL INFORMATION
|
Customers : |
Wholesalers, Retailers and End Users |
|
|
|
|
No. of Employees : |
3 (Approximately) |
|
|
|
|
Bankers : |
· State Bank of India, Margao Branch, Goa, India Corporation Bank, Vasco Da Gama Branch, Goa, India Bank of India, Verna Branch, Goa, India |
|
|
|
|
Banking
Relations : |
-- |
|
|
|
|
Auditors : |
|
|
Name : |
K.P. Angle and Company Chartered Accountants |
|
Address: |
Margao, Goa, India |
CAPITAL STRUCTURE
Authorised Capital :
|
No. of Shares |
Type |
Value |
Amount |
|
|
|
|
|
|
1000 |
Equity Shares |
Rs.100/- each |
Rs. 0.100 Million |
|
|
|
|
|
Issued, Subscribed & Paid-up Capital :
|
No. of Shares |
Type |
Value |
Amount |
|
|
|
|
|
|
1000 |
Equity Shares |
Rs.100/- each |
Rs. 0.100 Million |
|
|
|
|
|
FINANCIAL DATA
[all figures are
in Rupees Millions]
NEW BUSINESS
LOCAL AGENCY FURTHER INFORMATION
|
Sr. No. |
Check List by Info Agents |
Available in
Report (Yes / No) |
|
1] |
Year of Establishment |
Yes |
|
2] |
Locality of the firm |
Yes |
|
3] |
Constitutions of the firm |
Yes |
|
4] |
Premises details |
No |
|
5] |
Type of Business |
Yes |
|
6] |
Line of Business |
Yes |
|
7] |
Promoter's background |
Yes |
|
8] |
No. of employees |
Yes |
|
9] |
Name of person contacted |
Yes |
|
10] |
Designation of contact
person |
Yes |
|
11] |
Turnover of firm for last
three years |
No |
|
12] |
Profitability for last
three years |
No |
|
13] |
Reasons for variation
<> 20% |
----- |
|
14] |
Estimation for coming
financial year |
Yes |
|
15] |
Capital in the business |
Yes |
|
16] |
Details of sister
concerns |
No |
|
17] |
Major suppliers |
No |
|
18] |
Major customers |
No |
|
19] |
Payments terms |
Yes |
|
20] |
Export / Import details
(if applicable) |
No |
|
21] |
Market information |
----- |
|
22] |
Litigations that the firm
/ promoter involved in |
----- |
|
23] |
Banking Details |
Yes |
|
24] |
Banking facility details |
No |
|
25] |
Conduct of the banking
account |
----- |
|
26] |
Buyer visit details |
----- |
|
27] |
Financials, if provided |
No |
|
28] |
Incorporation details, if
applicable |
Yes |
|
29] |
Last accounts filed at
ROC |
Yes |
|
30] |
Major Shareholders, if
available |
Yes |
|
31] |
Date of Birth of Proprietor/Partner/Director,
if available |
Yes |
|
32] |
PAN of
Proprietor/Partner/Director, if available |
No |
|
33] |
Voter ID No of
Proprietor/Partner/Director, if available |
No |
|
34] |
External Agency Rating,
if available |
No |
------------------------------------------------------------------------------------------------------------------------------
ASSESSMENT
OF WORKING CAPITAL REQUIRMENTS UNDER PBS METHOD
(RS. IN MILLIONS)
|
PARTICULARS |
31.03.2015 |
31.03.2016 |
31.03.2017 |
31.03.2018 |
31.03.2019 |
31.03.2020 |
31.03.2021 |
31.03.2022 |
|
|
|
|
|
|
|
|
|
|
|
Total Current Assets |
12.878 |
22.512 |
24.710 |
24.375 |
26.700 |
29.900 |
32.000 |
38.620 |
|
|
|
|
|
|
|
|
|
|
|
Other Current Liabilities |
10.289 |
17.782 |
20.108 |
20.578 |
21.040 |
21.540 |
21.940 |
18.790 |
|
|
|
|
|
|
|
|
|
|
|
Working Capital Gap |
2.589 |
4.730 |
4.602 |
3.797 |
5.660 |
8.360 |
10.060 |
19.830 |
|
|
|
|
|
|
|
|
|
|
|
NWC (Actual/Proj) |
2.589 |
4.730 |
4.602 |
3.797 |
5.660 |
8.360 |
10.060 |
19.830 |
|
|
|
|
|
|
|
|
|
|
|
ABF |
-- |
-- |
-- |
-- |
-- |
-- |
-- |
-- |
|
|
|
|
|
|
|
|
|
|
|
NWC/ TCA (%) |
20.10 |
21.01 |
19.62 |
15.58 |
21.20 |
27.96 |
31.44 |
51.35 |
|
|
|
|
|
|
|
|
|
|
|
OCL/TCA (%) |
79.90 |
78.99 |
81.38 |
84.42 |
78.80 |
72.04 |
68.56 |
48.65 |
|
|
|
|
|
|
|
|
|
|
|
Sundry Creditor/ TCA (%) |
21 |
12 |
12 |
13 |
13 |
13 |
13 |
12 |
|
|
|
|
|
|
|
|
|
|
|
ABF/TCA (%) |
-- |
-- |
-- |
-- |
-- |
-- |
-- |
-- |
|
|
|
|
|
|
|
|
|
|
|
Inventories/ Net Sales (Days) |
63.45 |
40.51 |
42.56 |
47.13 |
48.85 |
49.96 |
51.31 |
64.19 |
|
|
|
|
|
|
|
|
|
|
|
Receivable’s/ Gross Sales (Days) |
57.18 |
54.55 |
62.76 |
61.90 |
64.79 |
67.51 |
65.08 |
65.16 |
|
|
|
|
|
|
|
|
|
|
|
Sundry Creditor/ Purchases (Days) |
80.61 |
49.96 |
42.26 |
52.90 |
40.52 |
54.08 |
55.17 |
55.62 |
|
|
|
|
|
|
|
|
|
|
|
PBDIT/Intt (Times) |
1.41 |
2.18 |
1.98 |
3.15 |
2.20 |
4.96 |
8.30 |
14.56 |
|
|
|
|
|
|
|
|
|
|
|
PAT/ Net Sales (%) |
4 |
9 |
6 |
11 |
5 |
11 |
13 |
15 |
|
|
|
|
|
|
|
|
|
|
|
ROCE (%) |
14.31 |
32.04 |
28.30 |
37.50 |
24.34 |
42.44 |
44.84 |
50.64 |
|
|
|
|
|
|
|
|
|
|
|
Net Sales |
32.501 |
60.368 |
62.651 |
66.411 |
71.724 |
78.896 |
86.785 |
95.523 |
|
|
|
|
|
|
|
|
|
|
|
Gross Sales |
33.185 |
61.623 |
63.969 |
67.808 |
73.233 |
80.555 |
88.611 |
97.472 |
|
|
|
|
|
|
|
|
|
|
|
Receivables |
5.199 |
9.209 |
11.000 |
11.500 |
13.000 |
14.900 |
15.800 |
17.400 |
|
|
|
|
|
|
|
|
|
|
|
Inventory |
5.650 |
6.700 |
7.305 |
8.575 |
9.600 |
10.800 |
12.200 |
16.800 |
|
|
|
|
|
|
|
|
|
|
|
Purchases |
17.875 |
20.885 |
25.655 |
23.349 |
32.554 |
27.522 |
29.849 |
36.100 |
|
|
|
|
|
|
|
|
|
|
|
Sundry Creditors |
2.700 |
2.715 |
2.900 |
3.200 |
3.500 |
3.900 |
4.300 |
4.800 |
|
|
|
|
|
|
|
|
|
|
|
PBDIT |
6.181 |
13.653 |
11.286 |
15.685 |
9.174 |
16.150 |
18.932 |
22.571 |
|
|
|
|
|
|
|
|
|
|
|
Interest |
4.378 |
6.275 |
5.695 |
4.987 |
4.173 |
3.257 |
2.281 |
1.550 |
|
|
|
|
|
|
|
|
|
|
|
TTA |
43.200 |
42.607 |
39.879 |
41.824 |
37.692 |
38.052 |
42.217 |
44.572 |
|
|
|
|
|
|
|
|
|
|
|
Cash Accruals |
3.062 |
9.026 |
7.873 |
11.962 |
7.984 |
13.890 |
17.214 |
20.823 |
|
|
|
|
|
|
|
|
|
|
|
PBT/NS (%) |
5.55 |
12.22 |
8.92 |
16.11 |
6.97 |
16.34 |
19.19 |
22.01 |
------------------------------------------------------------------------------------------------------------------------------
PERFORMANCE AND FINANCIAL
INDICATORS
(RS. IN MILLIONS)
|
PARTICULARS |
31.03.2015 |
31.03.2016 |
31.03.2017 |
31.03.2018 |
31.03.2019 |
31.03.2020 |
31.03.2021 |
31.03.2022 |
|
|
Projection |
Projection |
Projection |
Projection |
Projection |
Projection |
Projection |
Projection |
|
|
|
|
|
|
|
|
|
|
|
Net Sales |
32.501 |
60.368 |
62.651 |
66.411 |
71.724 |
78.896 |
86.785 |
95.523 |
|
|
|
|
|
|
|
|
|
|
|
PBT |
1.803 |
7.378 |
5.591 |
10.698 |
5.001 |
12.893 |
16.651 |
21.021 |
|
|
|
|
|
|
|
|
|
|
|
PAT |
1.262 |
5.164 |
3.913 |
7.489 |
3.501 |
9.025 |
11.656 |
14.715 |
|
|
|
|
|
|
|
|
|
|
|
PAT/ Net Sales (%) |
3.88 |
8.55 |
6.25 |
11.28 |
4.88 |
11.44 |
13.43 |
15.40 |
|
|
|
|
|
|
|
|
|
|
|
Paid up Capital |
11.277 |
11.277 |
11.277 |
11.277 |
11.277 |
11.277 |
11.277 |
11.277 |
|
|
|
|
|
|
|
|
|
|
|
TNW |
12.539 |
17.703 |
21.617 |
29.105 |
32.606 |
41.632 |
53.287 |
68.002 |
|
|
|
|
|
|
|
|
|
|
|
TOL/TNW |
3.71 |
2.78 |
2.10 |
1.36 |
1.05 |
0.70 |
0.45 |
0.28 |
|
|
|
|
|
|
|
|
|
|
|
CR |
27.00 |
27.15 |
29.00 |
32.00 |
35.00 |
39.00 |
43.00 |
48.00 |
|
|
|
|
|
|
|
|
|
|
|
PBT/TTA(%) |
4.17 |
17.32 |
14.02 |
25.58 |
13.27 |
33.88 |
39.44 |
47.16 |
|
|
|
|
|
|
|
|
|
|
|
Net Sales/ TTA (times) |
0.75 |
1.42 |
1.57 |
1.59 |
1.90 |
2.07 |
2.06 |
2.14 |
|
|
|
|
|
|
|
|
|
|
|
Operating Expense / N. Sales (%) |
58.98 |
52.33 |
61.10 |
54.38 |
65.21 |
56.53 |
56.19 |
56.37 |
|
|
|
|
|
|
|
|
|
|
|
BB/TTA (%) |
15.28 |
23.47 |
25.08 |
23.91 |
26.53 |
26.28 |
23.69 |
22.44 |
|
|
|
|
|
|
|
|
|
|
|
Inv+Rec/ Net Sales (Days) |
121.84 |
96.19 |
106.64 |
110.33 |
115.01 |
118.90 |
117.76 |
130.68 |
|
|
|
|
|
|
|
|
|
|
|
TTA |
43.200 |
42.607 |
39.879 |
41.824 |
37.692 |
38.052 |
42.217 |
44.572 |
|
|
|
|
|
|
|
|
|
|
|
Operating Expense |
19.170 |
31.588 |
38.283 |
36.116 |
46.770 |
44.600 |
48.761 |
53.847 |
|
|
|
|
|
|
|
|
|
|
|
Inv+Rec |
10.849 |
15.909 |
18.305 |
20.075 |
22.600 |
25.700 |
28.000 |
34.200 |
|
|
|
|
|
|
|
|
|
|
|
BB |
66.00 |
100.00 |
100.00 |
100.00 |
100.00 |
100.00 |
100.00 |
100.00 |
------------------------------------------------------------------------------------------------------------------------------
RATIO ANALYSIS
(RS. IN MILLIONS)
|
PARTICULARS |
2014-15 |
2015-16 |
2016-17 |
2017-18 |
2018-19 |
2019-20 |
2020-21 |
2021-22 |
|
|
|
|
|
|
|
|
|
|
|
Net Sales |
32.501 |
60.368 |
62.651 |
66.411 |
71.724 |
78.896 |
86.785 |
95.523 |
|
|
|
|
|
|
|
|
|
|
|
Operating Profit |
1.803 |
7.378 |
5.591 |
10.698 |
5.001 |
12.893 |
16.651 |
21.021 |
|
|
|
|
|
|
|
|
|
|
|
PBT |
1.803 |
7.378 |
5.591 |
10.698 |
5.001 |
12.893 |
16.651 |
21.021 |
|
|
|
|
|
|
|
|
|
|
|
PBT/ Net Sales (%) |
5.55 |
12.22 |
8.92 |
16.11 |
6.97 |
16.34 |
19.19 |
22.01 |
|
|
|
|
|
|
|
|
|
|
|
PAT |
1.262 |
5.164 |
3.913 |
7.489 |
3.501 |
9.025 |
11.656 |
14.715 |
|
|
|
|
|
|
|
|
|
|
|
Cash Accruals |
3.062 |
9.026 |
7.873 |
11.962 |
7.984 |
13.890 |
17.214 |
20.823 |
|
|
|
|
|
|
|
|
|
|
|
PBDIT |
6.181 |
13.653 |
11.286 |
15.685 |
9.174 |
16.150 |
18.932 |
22.571 |
|
|
|
|
|
|
|
|
|
|
|
TNW |
12.539 |
17.703 |
21.617 |
29.105 |
32.606 |
41.632 |
53.287 |
68.002 |
|
|
|
|
|
|
|
|
|
|
|
Adjusted TMW |
12.539 |
17.703 |
21.617 |
29.105 |
32.606 |
41.632 |
53.287 |
68.002 |
|
|
|
|
|
|
|
|
|
|
|
TOL/TNW |
3.71 |
2.780 |
2.10 |
1.36 |
1.05 |
0.70 |
0.45 |
0.28 |
|
|
|
|
|
|
|
|
|
|
|
TOL/ adjusted TNW |
3.71 |
2.780 |
2.10 |
1.36 |
1.05 |
0.70 |
0.45 |
0.28 |
|
|
|
|
|
|
|
|
|
|
|
Current Ratio |
1.25 |
1.27 |
1.23 |
1.18 |
1.27 |
1.39 |
1.46 |
2.06 |
------------------------------------------------------------------------------------------------------------------------------
CASH FLOW STATEMENT
(RS. IN MILLIONS)
|
PARTICULARS |
31.03.2015 |
31.03.2016 |
31.03.2017 |
31.03.2018 |
31.03.2019 |
31.03.2020 |
31.03.2021 |
31.03.2022 |
|
|
Projection |
Projection |
Projection |
Projection |
Projection |
Projection |
Projection |
Projection |
|
|
|
|
|
|
|
|
|
|
|
NET INCOME |
1.262 |
5.164 |
3.913 |
7.489 |
3.501 |
9.025 |
11.656 |
14.715 |
|
|
|
|
|
|
|
|
|
|
|
Depreciation |
1.800 |
3.861 |
3.960 |
4.474 |
4.483 |
4.865 |
5.559 |
6.108 |
|
|
|
|
|
|
|
|
|
|
|
Deffered Taxes |
0.541 |
2.213 |
1.677 |
3.209 |
1.500 |
3.868 |
4.995 |
6.306 |
|
|
|
|
|
|
|
|
|
|
|
Gains / Losses |
-- |
-- |
-- |
-- |
-- |
-- |
-- |
-- |
|
|
|
|
|
|
|
|
|
|
|
Changes in Working Capital |
2.589 |
4.730 |
4.602 |
3.797 |
5.660 |
8.360 |
10.060 |
19.830 |
|
|
|
|
|
|
|
|
|
|
|
CASH FLOW FROM OPERATING ACTIVITIES |
4.930 |
10.805 |
10.239 |
11.480 |
11.643 |
17.093 |
20.614 |
32.244 |
|
|
|
|
|
|
|
|
|
|
|
Sale of Long term Assets |
-- |
-- |
-- |
-- |
-- |
-- |
-- |
-- |
|
|
|
|
|
|
|
|
|
|
|
Purchase of Long
term Assets |
3.268 |
1.232 |
6.419 |
0.113 |
4.777 |
8.675 |
6.865 |
-- |
|
|
|
|
|
|
|
|
|
|
|
CASH FLOW FROM
INVESTING ACTIVITIES |
(3.268) |
(1.232) |
(6.419) |
(0.113) |
(4.777) |
(8.675) |
(6.865) |
-- |
|
|
|
|
|
|
|
|
|
|
|
Sale of Stock |
-- |
-- |
-- |
-- |
-- |
-- |
-- |
-- |
|
|
|
|
|
|
|
|
|
|
|
New Borrowings |
36.250 |
31.434 |
25.264 |
19.016 |
13.296 |
7.430 |
1.790 |
-- |
|
|
|
|
|
|
|
|
|
|
|
Debt Payment |
0.289 |
4.167 |
6.108 |
6.148 |
5.640 |
5.640 |
5.640 |
1.790 |
|
|
|
|
|
|
|
|
|
|
|
Dividend |
-- |
-- |
-- |
-- |
-- |
-- |
-- |
-- |
|
|
|
|
|
|
|
|
|
|
|
CASH FLOW FROM
FINANCING ACTIVITIES |
35.961 |
27.267 |
19.156 |
12.838 |
7.656 |
1.790 |
(3.850) |
(1.790) |
|
|
|
|
|
|
|
|
|
|
|
CASH FLOW FROM OPERATING ACTIVITIES |
4.930 |
10.805 |
10.239 |
11.480 |
11.643 |
17.093 |
20.614 |
32.244 |
|
|
|
|
|
|
|
|
|
|
|
CASH FLOW FROM INVESTING ACTIVITIES |
(3.268) |
(1.232) |
(6.419) |
(0.113) |
(4.777) |
(8.675) |
(6.865) |
-- |
|
|
|
|
|
|
|
|
|
|
|
CASH FLOW FROM FINANCING ACTIVITIES |
35.961 |
27.267 |
19.156 |
12.838 |
7.656 |
1.7900 |
(3.850) |
(1.790) |
|
|
|
|
|
|
|
|
|
|
|
NET CHANGE IN CASH |
37.623 |
36.840 |
22.976 |
24.205 |
14.522 |
10.208 |
9.899 |
30.454 |
------------------------------------------------------------------------------------------------------------------------------
ASSESSMENT OF WORKING
CAPITAL REQUIREMENT
OPERATING STATEMENT
(RS. IN MILLIONS)
|
PARTICULARS |
31.03.2015 |
31.03.2016 |
31.03.2017 |
31.03.2018 |
31.03.2019 |
31.03.2020 |
31.03.2021 |
31.03.2022 |
|
|
Projection |
Projection |
Projection |
Projection |
Projection |
Projection |
Projection |
Projection |
|
|
|
|
|
|
|
|
|
|
|
1. GROSS SALES |
|
|
|
|
|
|
|
|
|
Sales |
|
|
|
|
|
|
|
|
|
i)
Domestic Sales |
33.185 |
61.623 |
63.969 |
67.808 |
73.233 |
80.555 |
88.611 |
97.472 |
|
ii)
Export Sales |
-- |
-- |
-- |
-- |
-- |
-- |
-- |
-- |
|
iii)
Other Revenue Income |
-- |
-- |
-- |
-- |
-- |
-- |
-- |
-- |
|
Sub-total |
33.185 |
61.623 |
63.969 |
67.808 |
73.233 |
80.555 |
88.611 |
97.472 |
|
|
|
|
|
|
|
|
|
|
|
2.
Less: Excise Duty |
0.684 |
1.255 |
1.318 |
1.397 |
1.509 |
1.659 |
1.826 |
1.949 |
|
3 Net Sales |
32.501 |
60.368 |
62.651 |
66.411 |
71.724 |
78.896 |
86.785 |
95.523 |
|
|
|
|
|
|
|
|
|
|
|
4
%age rise (+) or fall (-) in net sales as compared to previous year |
NA |
86% |
4% |
6% |
8% |
10% |
10% |
10% |
|
|
|
|
|
|
|
|
|
|
|
5 COST OF SALES |
|
|
|
|
|
|
|
|
|
i) Raw Materials (Including Stores and spares and
other items used in the process of manufacture |
12.225 |
19.835 |
25.050 |
22.079 |
31.529 |
26.322 |
28.449 |
31.500 |
|
(a) Imported |
-- |
-- |
-- |
-- |
-- |
-- |
-- |
-- |
|
|
|
|
|
|
|
|
|
|
|
(b)Indigenous |
12.225 |
19.835 |
25.050 |
22.079 |
31.529 |
26.322 |
28.449 |
31.500 |
|
|
|
|
|
|
|
|
|
|
|
ii)
Other Spares |
|
|
|
|
|
|
|
|
|
(a) Imported |
-- |
-- |
-- |
-- |
-- |
-- |
-- |
-- |
|
(b)Indigenous |
-- |
-- |
-- |
-- |
-- |
-- |
-- |
-- |
|
|
|
|
|
|
|
|
|
|
|
iii)
Power and Fuel |
1.287 |
2.362 |
2.506 |
2.656 |
2.869 |
3.156 |
3.471 |
3.821 |
|
|
|
|
|
|
|
|
|
|
|
iv)Direct
Labour (Factory
Wages and Salary) |
0.965 |
1.771 |
3.133 |
3.322 |
3.586 |
3.945 |
4.339 |
4.776 |
|
|
|
|
|
|
|
|
|
|
|
v)
Other Manufacturing Expenses |
2.893 |
3.759 |
3.634 |
3.586 |
4.303 |
6.312 |
6.943 |
7.642 |
|
|
|
|
|
|
|
|
|
|
|
vi)
Job Work Charges |
-- |
-- |
-- |
-- |
-- |
-- |
-- |
-- |
|
|
|
|
|
|
|
|
|
|
|
vii)
Depreciation |
1.800 |
3.861 |
3.960 |
4.474 |
4.483 |
4.865 |
5.559 |
6.108 |
|
|
|
|
|
|
|
|
|
|
|
viii) SUB-TOTAL (I to vii) |
19.170 |
31.588 |
38.283 |
36.116 |
46.770 |
44.600 |
48.761 |
53.847 |
|
|
|
|
|
|
|
|
|
|
|
(ix)Add:
Opening stock-in-process |
-- |
-- |
-- |
-- |
-- |
-- |
-- |
-- |
|
|
|
|
|
|
|
|
|
|
|
Sub-total |
19.170 |
31.588 |
38.283 |
36.116 |
46.770 |
44.600 |
48.761 |
53.847 |
|
|
|
|
|
|
|
|
|
|
|
(x)
Deduct Closing Stock in process |
-- |
-- |
-- |
-- |
-- |
-- |
-- |
-- |
|
|
|
|
|
|
|
|
|
|
|
(xi) COST OF PRODUCTION |
19.170 |
31.588 |
38.283 |
36.116 |
46.770 |
44.600 |
48.761 |
53.847 |
|
|
|
|
|
|
|
|
|
|
|
(xii)
Add: Opening stock of finished Goods |
-- |
-- |
-- |
-- |
-- |
-- |
-- |
-- |
|
|
|
|
|
|
|
|
|
|
|
Sub-total |
19.170 |
31.588 |
38.283 |
36.116 |
46.770 |
44.600 |
48.761 |
53.847 |
|
|
|
|
|
|
|
|
|
|
|
(xiii)
Deduct: closing Stock Finished goods |
-- |
-- |
-- |
-- |
-- |
-- |
-- |
-- |
|
|
|
|
|
|
|
|
|
|
|
(xiv) SUB TOTAL (Cost of Sales) |
19.170 |
31.588 |
38.283 |
36.116 |
46.770 |
44.600 |
48.761 |
53.847 |
|
|
|
|
|
|
|
|
|
|
|
Gross Profit |
13.331 |
28.780 |
24.369 |
30.295 |
24.954 |
34.296 |
38.024 |
41.676 |
|
|
|
|
|
|
|
|
|
|
|
6.
Selling, General and Administrative Expenses |
7.150 |
15.127 |
13.083 |
14.610 |
15.780 |
18.146 |
19.093 |
19.105 |
|
|
|
|
|
|
|
|
|
|
|
7. SUB TOTAL |
26.320 |
46.715 |
51.366 |
50.726 |
62.549 |
62.746 |
67.853 |
72.951 |
|
|
|
|
|
|
|
|
|
|
|
8.
Operating Profit before interest |
6.181 |
13.653 |
11.286 |
15.685 |
9.174 |
16.150 |
18.932 |
22.571 |
|
|
|
|
|
|
|
|
|
|
|
9.
Interest |
4.378 |
6.275 |
5.695 |
4.987 |
4.173 |
3.257 |
2.281 |
1.550 |
|
|
|
|
|
|
|
|
|
|
|
10.
Operating profit after interest |
1.803 |
7.378 |
5.591 |
10.698 |
5.001 |
12.893 |
16.651 |
21.021 |
|
|
|
|
|
|
|
|
|
|
|
11.
(i) Add other non-operating income |
|
|
|
|
|
|
|
|
|
(d)
Other Income |
-- |
-- |
-- |
-- |
-- |
-- |
-- |
-- |
|
Sub-total (income) |
-- |
-- |
-- |
-- |
-- |
-- |
-- |
-- |
|
|
|
|
|
|
|
|
|
|
|
(ii)
Deduct other non-operating expense |
|
|
|
|
|
|
|
|
|
(d)
Other Income |
-- |
-- |
-- |
-- |
-- |
-- |
-- |
-- |
|
Sub-total (expenses) |
-- |
-- |
-- |
-- |
-- |
-- |
-- |
-- |
|
|
|
|
|
|
|
|
|
|
|
(iii)
Net of other non-operating incomes/expenses |
-- |
-- |
-- |
-- |
-- |
-- |
-- |
-- |
|
|
|
|
|
|
|
|
|
|
|
12. Profit before tax/loss |
1.803 |
7.378 |
5.591 |
10.698 |
5.001 |
12.893 |
16.651 |
21.021 |
|
|
|
|
|
|
|
|
|
|
|
13.
Provision for tax |
0.541 |
2.213 |
1.677 |
3.209 |
1.500 |
3.868 |
4.995 |
6.306 |
|
|
|
|
|
|
|
|
|
|
|
Provision
for deferred tax |
-- |
-- |
-- |
-- |
-- |
-- |
-- |
-- |
|
|
|
|
|
|
|
|
|
|
|
FBT |
-- |
-- |
-- |
-- |
-- |
-- |
-- |
-- |
|
|
|
|
|
|
|
|
|
|
|
14. Net profit / (loss) |
1.262 |
5.164 |
3.913 |
7.489 |
3.501 |
9.025 |
11.656 |
14.715 |
|
|
|
|
|
|
|
|
|
|
|
15.
(i) Dividend and Dividend Tax |
-- |
-- |
-- |
-- |
-- |
-- |
-- |
-- |
|
|
|
|
|
|
|
|
|
|
|
(ii)
Rate |
0% |
0% |
0% |
0% |
0% |
0% |
0% |
0% |
|
|
|
|
|
|
|
|
|
|
|
16.
Retained Profit |
1.262 |
5.164 |
3.913 |
74.89 |
35.01 |
90.25 |
116.56 |
147.15 |
|
|
|
|
|
|
|
|
|
|
|
17. Retained profit / Net Profit (%age) |
100% |
100% |
100% |
100% |
100% |
100% |
100% |
100% |
------------------------------------------------------------------------------------------------------------------------------
ANALYSIS
OF BALANCE SHEET
(RS. IN MILLIONS)
|
PARTICULARS |
31.03.2015 |
31.03.2016 |
31.03.2017 |
31.03.2018 |
31.03.2019 |
31.03.2020 |
31.03.2021 |
31.03.2022 |
|
|
Projection |
Projection |
Projection |
Projection |
Projection |
Projection |
Projection |
Projection |
|
|
|
|
|
|
|
|
|
|
|
CURRENT LIABILITIES |
|
|
|
|
|
|
|
|
|
1.
Short term borrowings from bank (incl. Bills purchased, discounted and excess
borrowings placed on repayment basis) |
|
|
|
|
|
|
|
|
|
(i)
From applicant bank |
-- |
-- |
-- |
-- |
-- |
-- |
-- |
-- |
|
(ii)
From other banks |
-- |
-- |
-- |
-- |
-- |
-- |
-- |
-- |
|
(iii)
of which EP & BD |
-- |
-- |
-- |
-- |
-- |
-- |
-- |
-- |
|
(i) From applicant bank CC |
6.600 |
10.000 |
10.000 |
10.000 |
10.000 |
10.000 |
10.000 |
10.000 |
|
(ii) From other banks |
-- |
-- |
-- |
-- |
-- |
-- |
-- |
-- |
|
Sub Total (A) |
6.600 |
10.000 |
10.000 |
10.000 |
10.000 |
10.000 |
10.000 |
10.000 |
|
|
|
|
|
|
|
|
|
|
|
2.
Sundry Creditors – Capital Goods and Spares |
-- |
-- |
-- |
-- |
-- |
-- |
-- |
-- |
|
|
|
|
|
|
|
|
|
|
|
3.
Sundry Creditor |
2.700 |
2.715 |
2.900 |
3.200 |
3.500 |
3.900 |
4.300 |
4.800 |
|
|
|
|
|
|
|
|
|
|
|
4. Advance payments from customers/
deposits from dealers |
0.700 |
0.900 |
1.100 |
1.200 |
1.900 |
2.000 |
2.000 |
2.200 |
|
|
|
|
|
|
|
|
|
|
|
5.
Provision for Taxation |
-- |
-- |
-- |
-- |
-- |
-- |
-- |
-- |
|
|
|
|
|
|
|
|
|
|
|
6.
Dividend Payable |
-- |
-- |
-- |
-- |
-- |
-- |
-- |
-- |
|
|
|
|
|
|
|
|
|
|
|
7.
Other statutory liabilities (due
within one year) |
-- |
-- |
-- |
-- |
-- |
-- |
-- |
-- |
|
|
|
|
|
|
|
|
|
|
|
8.
Deposits/Instalments of term loan/DPGs/ Debentures etc.(due within one year) |
-- |
3.760 |
5.640 |
5.640 |
5.640 |
5.640 |
5.640 |
1.790 |
|
|
|
|
|
|
|
|
|
|
|
9.
a. Other current liabilities and Provisions (due
within one year) |
0.289 |
0.407 |
0.468 |
0.538 |
-- |
-- |
-- |
-- |
|
|
|
|
|
|
|
|
|
|
|
b.
Other Current Liabilities (repayment of unsecured loans) |
-- |
-- |
-- |
-- |
-- |
-- |
-- |
-- |
|
|
|
|
|
|
|
|
|
|
|
Other Current Liabilities (Sub Total (B)] |
3.689 |
7.782 |
10.108 |
10.578 |
11.040 |
11.540 |
11.940 |
8.790 |
|
|
|
|
|
|
|
|
|
|
|
10. TOTAL CURRENT LIABILITIES (Total of 1
to 9) |
10.289 |
17.782 |
20.108 |
20.578 |
21.040 |
21.540 |
21.940 |
18.790 |
|
|
|
|
|
|
|
|
|
|
|
TERM LIABILITIES |
|
|
|
|
|
|
|
|
|
11.
Debentures (not maturing within one year) |
-- |
-- |
-- |
-- |
-- |
-- |
-- |
-- |
|
|
|
|
|
|
|
|
|
|
|
12.
Preference Shares (redeemable after one year) |
-- |
-- |
-- |
-- |
-- |
-- |
-- |
-- |
|
|
|
|
|
|
|
|
|
|
|
13.
Term loans (excluding instalments payable within one year) |
33.750 |
29.990 |
24.350 |
18.710 |
13.070 |
7.430 |
1.790 |
-- |
|
|
|
|
|
|
|
|
|
|
|
14.
Differed Payment Credits (excl.
instalments due within one year) |
-- |
-- |
-- |
-- |
-- |
-- |
-- |
-- |
|
|
|
|
|
|
|
|
|
|
|
15.
Term deposits (Repayable after one year) |
2.500 |
1.444 |
0.914 |
0.306 |
0.226 |
-- |
-- |
-- |
|
|
|
|
|
|
|
|
|
|
|
16.
Other term liabilities (unsecured loans) |
-- |
-- |
-- |
-- |
-- |
-- |
-- |
-- |
|
|
|
|
|
|
|
|
|
|
|
17. TOTAL TERM LIABILITIES |
36.250 |
31.434 |
25.264 |
19.016 |
13.296 |
7.430 |
1.790 |
-- |
|
|
|
|
|
|
|
|
|
|
|
18. TOTAL OUTSIDE LIABILITIES |
46.539 |
49.216 |
45.372 |
39.594 |
34.336 |
28.970 |
23.730 |
18.790 |
|
|
|
|
|
|
|
|
|
|
|
NET WORTH |
|
|
|
|
|
|
|
|
|
|
|
|
|
|
|
|
|
|
|
19.
Share Capital |
11.277 |
11.277 |
11.277 |
11.277 |
11.277 |
11.277 |
11.277 |
11.277 |
|
|
|
|
|
|
|
|
|
|
|
20
General Reserves |
-- |
1.262 |
6.426 |
10.340 |
17.828 |
21.329 |
30.355 |
42.010 |
|
|
|
|
|
|
|
|
|
|
|
21. Reserve for differed tax liabilities |
-- |
-- |
-- |
-- |
-- |
-- |
-- |
-- |
|
|
|
|
|
|
|
|
|
|
|
22. Other reserves (excluding provisions) |
-- |
-- |
-- |
-- |
-- |
-- |
-- |
-- |
|
|
|
|
|
|
|
|
|
|
|
23. Surplus(+) or deficit(-) in P&L
account |
1.262 |
5.164 |
3.913 |
7.489 |
3.501 |
9.025 |
11.656 |
14.715 |
|
|
|
|
|
|
|
|
|
|
|
23
(a). Others – Share Premium |
-- |
-- |
-- |
-- |
-- |
-- |
-- |
-- |
|
|
|
|
|
|
|
|
|
|
|
23
(b). Deferred tax |
-- |
-- |
-- |
-- |
-- |
-- |
-- |
-- |
|
|
|
|
|
|
|
|
|
|
|
24. NET WORTH |
12.539 |
17.703 |
21.617 |
29.105 |
32.606 |
41.632 |
53.287 |
68.002 |
|
|
|
|
|
|
|
|
|
|
|
25.
TOTAL LIABILITIES |
59.078 |
66.919 |
66.989 |
68.699 |
66.942 |
70.602 |
77.017 |
86.792 |
|
|
|
|
|
|
|
|
|
|
|
CURRENT ASSETS |
|
|
|
|
|
|
|
|
|
|
|
|
|
|
|
|
|
|
|
26.
Cash & Bank Balances |
0.129 |
1.886 |
1.733 |
1.400 |
1.200 |
1.200 |
0.800 |
0.820 |
|
|
|
|
|
|
|
|
|
|
|
27.
Investments (Other than long term investments) |
-- |
-- |
-- |
-- |
-- |
-- |
-- |
-- |
|
(i)
Government and Other Trustee Securities |
-- |
-- |
-- |
-- |
-- |
-- |
-- |
-- |
|
|
|
|
|
|
|
|
|
|
|
(ii)
Fixed deposits with bank and Others |
-- |
-- |
-- |
-- |
-- |
-- |
-- |
-- |
|
|
|
|
|
|
|
|
|
|
|
28.
(i) Receivables other than deferred & export (Including
bills purchased and discounted by banks) |
-- |
-- |
-- |
-- |
-- |
-- |
-- |
-- |
|
|
|
|
|
|
|
|
|
|
|
(ii)
Export receivables (Incld bills purchased and dis. By bank) |
-- |
-- |
-- |
-- |
-- |
-- |
-- |
-- |
|
|
|
|
|
|
|
|
|
|
|
29.
Sundry Debtors |
5.199 |
9.209 |
11.000 |
11.500 |
13.000 |
14.900 |
15.800 |
17.400 |
|
|
|
|
|
|
|
|
|
|
|
30. Inventory |
5.650 |
6.700 |
7.305 |
8.575 |
9.600 |
10.800 |
12.200 |
16.800 |
|
(i)
Raw materials (including stores and other items used in the process of
manufacture) |
5.650 |
6.700 |
7.305 |
8.575 |
9.600 |
10.800 |
12.200 |
16.800 |
|
(a)
Imported |
-- |
-- |
-- |
-- |
-- |
-- |
-- |
-- |
|
(b)
Indigenous |
5.650 |
6.700 |
7.305 |
8.575 |
9.600 |
10.800 |
12.200 |
16.800 |
|
|
|
|
|
|
|
|
|
|
|
(ii)
Work-in-process |
-- |
-- |
-- |
-- |
-- |
-- |
-- |
-- |
|
|
|
|
|
|
|
|
|
|
|
(iii)
Finished goods |
-- |
-- |
-- |
-- |
-- |
-- |
-- |
-- |
|
|
|
|
|
|
|
|
|
|
|
(iv)
Other Consumable Spares |
|
|
|
|
|
|
|
|
|
a)
Imported |
-- |
-- |
-- |
-- |
-- |
-- |
-- |
-- |
|
|
|
|
|
|
|
|
|
|
|
b)
Indigenous |
-- |
-- |
-- |
-- |
-- |
-- |
-- |
-- |
|
|
|
|
|
|
|
|
|
|
|
31.
Advance to suppliers of Raw materials and stores/spares |
1.900 |
2.100 |
2.100 |
2.200 |
2.300 |
2.400 |
2.600 |
2.600 |
|
|
|
|
|
|
|
|
|
|
|
32.
Advance payment of taxes |
-- |
0.450 |
0.372 |
0.700 |
0.600 |
0.600 |
0.600 |
1.000 |
|
|
|
|
|
|
|
|
|
|
|
33.
Other current assets |
-- |
2.167 |
2.200 |
-- |
-- |
-- |
-- |
-- |
|
-
Prepaid Expenses |
-- |
2.167 |
2.200 |
-- |
-- |
-- |
-- |
-- |
|
|
|
|
|
|
|
|
|
|
|
-
Others |
-- |
-- |
-- |
-- |
-- |
-- |
-- |
-- |
|
|
|
|
|
|
|
|
|
|
|
34. TOTAL CURRENT ASSET (total of 26 to 33) |
12.878 |
22.512 |
24.710 |
24.375 |
26.700 |
29.900 |
32.000 |
38.620 |
|
|
|
|
|
|
|
|
|
|
|
FIXED ASSETS |
|
|
|
|
|
|
|
|
|
|
|
|
|
|
|
|
|
|
|
35.
Gross Block (Land and Building, Machinery, work-in-progress) |
45.000 |
48.268 |
49.500 |
55.919 |
56.032 |
60.809 |
69.484 |
76.349 |
|
|
|
|
|
|
|
|
|
|
|
36.
Depreciation to date |
1.800 |
5.661 |
9.621 |
14.095 |
18.340 |
22.757 |
27.267 |
31.777 |
|
|
|
|
|
|
|
|
|
|
|
37. NET BLOCK |
43.200 |
42.607 |
39.879 |
41.824 |
37.692 |
38.052 |
42.217 |
44.572 |
|
|
|
|
|
|
|
|
|
|
|
38.
Investments/book debts /advances/ deposits which are not current assets |
1.100 |
1.100 |
1.800 |
1.800 |
1.800 |
1.800 |
1.800 |
2.400 |
|
|
|
|
|
|
|
|
|
|
|
i.(a)Investments
in subsidiary companies/ affiliates |
-- |
-- |
-- |
-- |
-- |
-- |
-- |
-- |
|
(b)Others |
-- |
-- |
-- |
-- |
-- |
-- |
-- |
-- |
|
|
|
|
|
|
|
|
|
|
|
ii.
Advances to suppliers of capital goods and contractors |
-- |
-- |
-- |
-- |
-- |
-- |
-- |
-- |
|
|
|
|
|
|
|
|
|
|
|
iii.
Deferred receivables |
-- |
-- |
-- |
-- |
-- |
-- |
-- |
-- |
|
|
|
|
|
|
|
|
|
|
|
iv.
Others – Debtors within 6 months |
|
|
|
|
|
|
|
|
|
-
Security deposit |
1.100 |
1.100 |
1.800 |
1.800 |
1.800 |
1.800 |
1.800 |
2.400 |
|
|
|
|
|
|
|
|
|
|
|
-
Loans and Advances for others |
-- |
-- |
-- |
-- |
-- |
-- |
-- |
-- |
|
|
|
|
|
|
|
|
|
|
|
39.
Non consumables stores & spare |
-- |
-- |
-- |
-- |
-- |
-- |
-- |
-- |
|
|
|
|
|
|
|
|
|
|
|
40.
Other non-current assets (incl. Dues from director) |
1.900 |
0.700 |
0.600 |
0.700 |
0.750 |
0.850 |
1.000 |
1.200 |
|
|
|
|
|
|
|
|
|
|
|
41. TOTAL OTHER NON-CURRENT ASSETS |
3.000 |
1.800 |
2.400 |
2.500 |
2.550 |
2.650 |
2.800 |
3.600 |
|
|
|
|
|
|
|
|
|
|
|
42
Intangible assets (patents, goodwill, prelim. expenses, bad/ doubtful debts
not provided for etc.) |
-- |
-- |
-- |
-- |
-- |
-- |
-- |
-- |
|
|
|
|
|
|
|
|
|
|
|
43.
TOTAL ASSETS (34+37+41+42) |
59.078 |
66.919 |
66.989 |
68.699 |
66.942 |
70.602 |
77.017 |
86.792 |
|
|
|
|
|
|
|
|
|
|
|
44. TANGIBLE NET WORTH (24-42) |
12.539 |
17.703 |
21.617 |
29.105 |
32.606 |
41.632 |
53.287 |
68.002 |
|
|
|
|
|
|
|
|
|
|
|
45. NET WORKING CAPITAL (17+24) –
(37+41+42) |
2.589 |
4.730 |
4.602 |
3.797 |
5.660 |
8.360 |
10.060 |
19.830 |
|
|
|
|
|
|
|
|
|
|
|
46.
CURRENT RATIO |
1.25 |
1.27 |
1.23 |
1.18 |
1.27 |
1.39 |
1.46 |
2.06 |
|
|
|
|
|
|
|
|
|
|
|
47. Total Outside Liabilities / Tangible
Net Worth |
3.71 |
2.78 |
2.10 |
1.36 |
1.05 |
0.70 |
0.45 |
0.28 |
|
|
|
|
|
|
|
|
|
|
|
48. Total Term Liabilities / Tangible Net
Worth |
2.89 |
1.78 |
1.17 |
0.65 |
0.41 |
0.18 |
0.03 |
-- |
------------------------------------------------------------------------------------------------------------------------------
COMPARATIVE
STATEMENT OF CURRENT ASSETS & CURRENT LIABILITIES
(RS. IN MILLIONS)
|
PARTICULARS |
31.03.2015 |
31.03.2016 |
31.03.2017 |
31.03.2018 |
31.03.2019 |
31.03.2020 |
31.03.2021 |
31.03.2022 |
|
|
Projection |
Projection |
Projection |
Projection |
Projection |
Projection |
Projection |
Projection |
|
|
|
|
|
|
|
|
|
|
|
I. CURRENT ASSETS: |
|
|
|
|
|
|
|
|
|
1. Raw materials (Including stores and
other items used in the process of manufacture) |
|
|
|
|
|
|
|
|
|
(a)
Imported |
-- |
-- |
-- |
-- |
-- |
-- |
-- |
-- |
|
Months' consumption |
-- |
-- |
-- |
-- |
-- |
-- |
-- |
-- |
|
(b) Indigenous |
5.650 |
6.700 |
7.305 |
8.575 |
9.600 |
10.800 |
12.200 |
16.800 |
|
Months' consumption |
-- |
-- |
-- |
-- |
-- |
-- |
-- |
-- |
|
|
|
|
|
|
|
|
|
|
|
2. Other consumable spares, exclude. Those
included in (1) above |
-- |
-- |
-- |
-- |
-- |
-- |
-- |
-- |
|
|
|
|
|
|
|
|
|
|
|
3. Stocks-in-process |
-- |
-- |
-- |
-- |
-- |
-- |
-- |
-- |
|
Months' cost of Sales |
-- |
-- |
-- |
-- |
-- |
-- |
-- |
-- |
|
|
|
|
|
|
|
|
|
|
|
4. Finished goods |
-- |
-- |
-- |
-- |
-- |
-- |
-- |
-- |
|
Months' cost of sales |
-- |
-- |
-- |
-- |
-- |
-- |
-- |
-- |
|
|
|
|
|
|
|
|
|
|
|
5. Receivables other than export and
deferred receivables (including bills purchased and discounted by bankers) |
5.199 |
9.209 |
11.000 |
11.500 |
13.000 |
14.900 |
15.800 |
17.400 |
|
Months' domestic sales |
-- |
-- |
-- |
-- |
-- |
-- |
-- |
-- |
|
|
|
|
|
|
|
|
|
|
|
6. Exports Receivable (Including bills
purchased and discounted) |
0.000 |
0.000 |
0.000 |
0.000 |
0.000 |
0.000 |
0.000 |
0.000 |
|
Months' export sales |
-- |
-- |
-- |
-- |
-- |
-- |
-- |
-- |
|
|
|
|
|
|
|
|
|
|
|
7. Advance to suppliers of materials and
Stores/ spares, consumables |
1.900 |
2.100 |
2.100 |
2.200 |
2.300 |
2.400 |
2.600 |
2.600 |
|
|
|
|
|
|
|
|
|
|
|
8. Other current assets incl. cash and bank
balance and deferred receivables due within 1 year |
0.129 |
4.503 |
4.305 |
2.100 |
1.800 |
1.800 |
1.400 |
1.820 |
|
Cash and Bank Balances |
0.129 |
1.886 |
1.733 |
1.400 |
1.200 |
1.200 |
0.800 |
0.820 |
|
|
|
|
|
|
|
|
|
|
|
Investment expect long-term investment of
def. receivables |
0.000 |
0.000 |
0.000 |
0.000 |
0.000 |
0.000 |
0.000 |
0.000 |
|
|
|
|
|
|
|
|
|
|
|
Others |
0.000 |
2.617 |
2.572 |
0.700 |
0.600 |
0.600 |
0.600 |
1.000 |
|
|
|
|
|
|
|
|
|
|
|
9. TOTAL CURRENT
ASSETS |
12.878 |
22.512 |
24.710 |
24.375 |
26.700 |
29.900 |
32.000 |
38.620 |
|
|
|
|
|
|
|
|
|
|
|
II. CURRENT LIABILITIES |
|
|
|
|
|
|
|
|
|
(Other than bank borrowing for WC) |
6.600 |
10.000 |
10.000 |
10.000 |
10.000 |
10.000 |
10.000 |
10.000 |
|
|
|
|
|
|
|
|
|
|
|
10. Creditors for purchase of raw
materials, stores and consumable spares |
2.700 |
2.715 |
2.900 |
3.200 |
3.500 |
3.900 |
4.300 |
4.800 |
|
Months' purchases |
-- |
-- |
-- |
-- |
-- |
-- |
-- |
-- |
|
|
|
|
|
|
|
|
|
|
|
11. Advances from customers |
0.700 |
0.900 |
1.100 |
1.200 |
1.900 |
2.000 |
2.000 |
2.200 |
|
|
|
|
|
|
|
|
|
|
|
12. Statutory Liabilities |
-- |
-- |
-- |
-- |
-- |
-- |
-- |
-- |
|
|
|
|
|
|
|
|
|
|
|
13. Other current liabilities |
|
|
|
|
|
|
|
|
|
a) S. Creditors for Capital Goods |
-- |
-- |
-- |
-- |
-- |
-- |
-- |
-- |
|
b) Dividend Payable |
-- |
-- |
-- |
-- |
-- |
-- |
-- |
-- |
|
c) Instalments of TL, DPS and Public
deposits |
-- |
3.760 |
5.640 |
5.640 |
5.640 |
5.640 |
5.640 |
1.790 |
|
d) Other current liabilities and provisions |
0.289 |
0.407 |
0.468 |
0.538 |
-- |
-- |
-- |
-- |
|
|
|
|
|
|
|
|
|
|
|
14. TOTAL CURRENT
LIABILITIES |
10.289 |
17.782 |
20.108 |
20.578 |
21.040 |
21.540 |
21.940 |
18.790 |
------------------------------------------------------------------------------------------------------------------------------
NETWORTH
STATEMENT AS ON 21.08.2014
MRS.
NIVEDITA DEVESH SHIRODKAR
(RS. IN MILLIONS)
|
PARTICULARS |
Amount |
|
A. Immovable Assets |
|
|
Land and Building |
-- |
|
|
|
|
Total Immovable Assets (A) |
-- |
|
|
|
|
B. Movable Assets |
|
|
Investments in equity shares Shares in Funtacy Icy Delights Private
Limited |
0.050 |
|
|
|
|
Investment in group companies |
|
|
Advances to Funtacy Icy Delights Private
Limited |
3.450 |
|
|
|
|
Vehicles |
-- |
|
|
|
|
Jewellary |
0.600 |
|
|
|
|
Current assets (loan and advances to friends and relatives) |
-- |
|
|
|
|
Cash and bank balance |
0.425 |
|
Total Movable
Assets (B) |
4.525 |
|
|
|
|
Total Assets (A+B)8 |
4.525 |
|
|
|
|
Liabilities |
|
|
Bank Loans |
|
|
IOB Cortalim – Gold Loan |
0.385 |
|
|
|
|
Unsecured Loans |
-- |
|
|
|
|
Total Liabilities |
0.385 |
|
|
|
|
Net worth (a+b-c) |
4.140 |
------------------------------------------------------------------------------------------------------------------------------
NETWORTH
STATEMENT AS ON 21.08.2014
MR.
DEVESH M SHIRODKAR
(RS. IN MILLIONS)
|
PARTICULARS |
Amount |
|
A. Immovable Assets |
|
|
Land and Building |
|
|
Share in Plot at Cortalim (Survey No. 90/18
Area 2425M2) (50%) |
21.825 |
|
|
|
|
Flat at Melquiedes Building, 3rd
Floor Vasco da Gama Goa (Area 88.27M2) |
0.820 |
|
|
|
|
Residential House No. 505 with admeasuring
Plot area 1500M2 (50%) |
10.000 |
|
|
|
|
Total Immovable Assets (A) |
32.645 |
|
|
|
|
B. Movable Assets |
|
|
Investments in equity shares |
|
|
Shares in Tirthraj Shipping Private Limited |
1.250 |
|
|
|
|
Shares in Shree Damodar Shipping Line
Private Limited |
0.500 |
|
|
|
|
Shares in Srimanguesh Shipping Lines Private Limited |
0.197 |
|
|
|
|
Shares in Funtacy Icy Delights Private Limited |
0.050 |
|
|
|
|
Investment in group companies |
|
|
Advances to Funtacy Icy Delights Private
Limited |
3.450 |
|
|
|
|
Vehicles |
0.300 |
|
|
|
|
Jewellary |
0.500 |
|
|
|
|
Current assets (loasn and advances to friends and relatives) |
-- |
|
|
|
|
Cash and bank balance |
0.050 |
|
Total Movable
Assets (B) |
6.297 |
|
|
|
|
Total Assets (A+B) |
38.942 |
|
|
|
|
LIABILITIES |
|
|
Bank Loans |
|
|
IOB Cortalim – Gold Loan |
0.475 |
|
|
|
|
Unsecured Loans |
-- |
|
|
|
|
Total Liabilities |
0.475 |
|
|
|
|
Net worth (a+b-c) |
38.467 |
------------------------------------------------------------------------------------------------------------------------------
VALUATION REPORT
|
GENERAL
DETAILS |
|
|
Purpose
for which valuation is made |
To
determine the market value of the property |
|
|
|
|
Date
as on which site inspected, valuation made |
20/06/2014,
23/06/2014 |
|
|
|
|
Name
of the Owner / Owners |
M/s. Fun Cream Foods
(India) Limited 310, Dalamal Towers, 211, Nariman Point, Mumbai – 21. As per allotment letter of GIDC dt. 10/05/1999 |
|
|
|
|
Brief description of the property |
Industrial
shed on plot no. L-127 bearing Survey No. 291, 283, 290 in Phase III – B of Verna
Industrial Estate, Verna Goa. Ice cream factory presently not in production |
|
|
|
|
Location, Street, Ward No. (Postal Address) |
Verna
Industrial Estate, Verna, Goa (Within the limits of the Verna Industrial
Estate) |
|
|
|
|
Survey/Plot
No. of Land |
L-127
bearing Survey No. 291, 283, 290 in Phase III – B V P Loutolim |
|
|
|
|
Is
the property situated in the Residential/ Commercial/ Mixed Area/ Indus trial
area? |
Industrial
Area |
|
|
|
|
Classification
of Locality – High class/ Middle class/ Poor class |
High/
Middle Class/ Industrial Area |
|
|
|
|
Proximity
to civic amenities like School, Hospital, offices, markets, cinema etc |
All
civic amenities within 10 – 15 km distance. Almost equidistant from the
cities of Panjim, Margao, Vasco and Ponda |
|
|
|
|
Means
and proximity to surface communication by which the locality is served |
Located
in the Industrial area on the main NH – 17 equidistant from the main cities Panjim,
Margao, Vasco and Ponda. Public transport is available on the main road
outside |
|
|
|
|
Area
of land supported by documentary proof, dimensions and physical features |
Plot
area is 4,836 sq mts and area of the main industrial shed is around 1,032.14
sq mts and first floor 144 sq mts = 1,176.14 sq mts |
|
|
|
|
Is
it leasehold, the name lessor/ lessee, nature of lease, dates of commencement
and termination of lease and terms of renewal of lease (i)
Initial Premium (ii)
Ground rent payable per annum (iii)
Unearned increase payable to the lessor in the event of sale of transfer |
Lease
deed with GIDC to be studied as per legal opinion
NA |
|
|
|
|
Is
there any restrictive covenant in regard to use of land? if so, attach a copy
of the covenant |
Industrial
land as per the government |
|
|
|
|
Has
the whole or part of land been notified for acquisition by Government or any statutory
body? Give date of the notification |
NA The
industrial estate belongs to the government of Goa |
|
|
|
|
Is
the building owner – occupied / tenanted/ both? |
Owners
Occupied |
|
|
|
|
What
is the FAR permissible and percentage actually utilized? |
Area
falls in industrial zone |
|
|
|
|
Has
the tenant to bear the whole or part of the cost of repairs and maintenance?
Give particulars |
Owners
|
|
|
|
|
Is
the property insured? If so, give the policy no. amount for which it is
insured and the annual premium |
Insurance
is to be done as per the bank’s requirements on sanction |
|
|
|
|
Land
rate adopted in the valuation |
Upto
Rs. 4,500/- for land per sq mt and Rs. 22,500/- for the shed per sq mt. |
|
|
|
|
If
sale instances are not available or not relied upon, the basis of arriving at
the land rate |
Market
value of similar properties in and around the area as per market survey |
|
|
|
|
Year
of commencement of construction and year of completion |
Occupancy
give around 14 years back. Occupancy certificate to be enclosed |
|
|
|
|
TECHNICAL
DETAILS |
|
|
No
of floors and height of each floor |
The
premise under consideration is an ice cream factory in the ground plus one
building. Floors are of around 4 mt height |
|
|
|
|
Plinth
area –floor wise |
Total
area of the main shed is around 1,176.14 sq mts in area with land admeasuring
around 4,836 sq mts |
|
|
|
|
Year
of Completion |
Occupancy
given around 14 years back. Occupancy certificate to be attached |
|
|
|
|
Estimated
future life |
Around
50 years or so (Subject to proper maintenance) |
|
|
|
|
Type
of construction |
RCC
framed structure with masonary infill walls for the main building. |
|
|
|
|
Type
of foundations |
RCC |
|
|
|
|
Walls
|
Mansonary
|
|
|
|
|
Door
and Windows |
Wooden
doors and windows with glazing and grills as well as a rolling shutters etc. |
|
|
|
|
Flooring
|
IPS
flooring |
|
|
|
|
Finishing
|
Industrial
Class |
|
|
|
|
Roofing
and Terracing |
RCC |
|
|
|
|
(a)
Internal Wiring – Surface or Concealed (b)
Class of fitting – Superior/ Standard/ Poor |
Surface
Standard |
|
|
|
|
Sanitary
Installation Class
of fittings |
Provided
as required Standard |
|
|
|
|
Compound
Wall |
Masonary
with gates |
|
|
|
|
Underground
sump - Capacity and types of constructions |
Provided
as required |
|
|
|
|
Overhead
tank |
Provided
as required |
|
|
|
|
Roads
and paving within the compound, approximate area and type of paving |
Paving
and landscaping is partially done |
|
|
|
|
Sewage
: If septic tank provided, No. and capacity |
Provided
as required. There is public water supply and electricity in the area. Also
an effluent plant is provided as required |
|
|
|
|
Landmark
|
Off
the main NH-17 road leading from Panjim to Margao city |
|
|
|
|
GPS
Coordinates |
Latitude
N 15022.159’, Longitude E 73056.862’. |
|
|
|
|
VALUATION : The property consists of an industrial shed (tor production of ice cream - "Funtacy") on plot no. L - 127 bearing survey No. 291, 283, 29O in Phase lll - B of Verna lndustrial Estate, Verna Goa. The plot area is 4,836 sq mts and area of the main industrial shed is around 1,176.14 sq mts. The property is located in the Verna lndustrial Estate, equidistant from the main cities on Panjim, Margao, Vasco and Ponda (15 - 20 km@) and is around 2 km from the main gate of the estate and the highway. The locality is high / middle class and consists of several lndustrial Sheds and Factory complexes. Verna industrial area is the main lndustrial area of Goa. The unit has flooring of mainly lPS, there are wooden doors and glazed windows with grills as well as rolling shutters, etc. The building is provided with public water supply and electricity and is connected to the septic tank, soak pit, effluent treatment plant as needed. The building is constructed of RCC framed stucture with RCc roof slab and having mainly ground floor with part first floor. The walls are of masonary. External face of the building sand faced plaster and inside wall surfaces and ceiling are with neeru finished cement plaster. There is considerable plant and machinery as required. There are ancillary buildings like Change room and tool room 75 sq.mts, Guard room and w/c unit 41.52 sq.mts, parking shed 55 sq mts which are not considered separately. The unit is not in operation for last several months as per the information made available during the inspection. Considering the above mentioned conditions, and the sale rate for similar new industrial sheds in the vicinity, in my opinion, the value of similar new industrial sheds in the area is around Rs. 22,500/- per square metre. Hence the present market value of the industrial shed would be 1,176.14 sq mts x Rs.22,500/- = Rs. 26.463 Millons, Say Rs.26.400 Millions. The depreciated value would thus be Rs.21.282 Millions, say Rs.21.200 Millions. This is inclusive of the values of the other ancillary structures which are not considered separately. Land value would be upto around Rs.4,500/- per sq mts for similar land thus giving a value of Rs.4,500/- x 4,836 sq mts = Rs. 21.762 Millions, say Rs. 21.700 Millions for the land. This thus gives a total value of Rs. 42.900 Millions for the entire property. Therefore in my opinion, the total value of the industrial shed on plot no. L - 127 bearing survey No. 291, 283, 290 in Phase lll - B of Verna lndustrial Estate, Verna, Goa as of today, would be around 42.900 Millions. The distress sale / mortgage value may be considered 70% (Rs. 30.030 Millions) or as per the bank’s guidelines as applicable. The realizable value would be between 80% (Rs. 36.465 Millions) to 100% (Rs. 42.900 Millions) of the value. The registration value is not available. Registration rate would be around Rs. 2,500/- per sq mt for land |
|
------------------------------------------------------------------------------------------------------------------------------
VALUATION REPORT
|
GENERAL
DETAILS |
|
|
Purpose
for which valuation is made |
To
determine the market value of the property |
|
|
|
|
Date
as on which site inspected, valuation made |
20/06/2014,
26/06/2014 |
|
|
|
|
Name
of the Owner / Owners |
Mr. Madhukar Purshottam Shirodkar |
|
|
|
|
Brief description of the property |
The
said part of land bearing Survey no. 330 of Loutulim Village is part of
property known as CANTURLEM and lies within the jurisdiction of the Village
Panchayat of Loutulim and having an area of around 32,875 sq mts. The said
land is property sloping and is zoned mainly for Agriculture use. The
adjoining properties also are similar, sloping and undeveloped land. The said
property is demarcated on site by boundary wall and abuts onto the Cortalim –
Loutulim NH – 17 B road on its north and the Verna Industrial Estate on the
south Amenties like electricity, water supply and public transport are
readily available in the locality, while local markets, schools, health
centre, banks, etc. are within a distance of about 7 – 8 kms at Cortalim
Village. The property is located about 15.0 to 20.0 kms almost equidistant
from the major towns of Margao, Ponda, Panjim and Vasco |
|
|
|
|
Location, Street, Ward No. (Postal Address) |
At
Rassaim, Lotolim, Salcette, Goa |
|
|
|
|
Survey/Plot
No. of Land |
Survey
Nos. 330 at Rassaim, Salcette, Goa |
|
|
|
|
Is
the property situated in the Residential/ Commercial/ Mixed Area/ Indus trial
area? |
Mixed |
|
|
|
|
Classification
of Locality – High class/ Middle class/ Poor class |
Middle
Class |
|
|
|
|
Proximity
to civic amenities like School, Hospital, offices, markets, cinema etc |
All
civic amenities within 12 – 15 km distance towards Vasco or Margao which are
almost equidistant from the property |
|
|
|
|
Means
and proximity to surface communication by which the locality is served |
Located
at Rassaim, Salcette, Goa. Public transport is available on the main NH – 17
B adjacent on the north |
|
|
|
|
Area
of land supported by documentary proof, dimensions and physical features |
Plot
area is 4,836 sq mts and area of the main industrial shed is around 1,032.14
sq mts and first floor 144 sq mts = 1,176.14 sq mts |
|
|
|
|
Is
it leasehold, the name lessor/ lessee, nature of lease, dates of commencement
and termination of lease and terms of renewal of lease (i)
Initial Premium (ii)
Ground rent payable per annum (iii)
Unearned increase payable to the lessor in the event of sale of transfer |
No
|
|
|
|
|
Is
there any restrictive covenant in regard to use of land? if so, attach a copy
of the covenant |
No
|
|
|
|
|
Are
there any agreement of easements? |
No
|
|
|
|
|
Attach
plans and elevations of all structures standing on the land a layout plan |
No
major structures. N.A. |
|
|
|
|
Is
the building owner – occupied / tenanted/ both? |
Land
Only |
|
|
|
|
What
is the FAR permissible and percentage actually utilized? |
Partly
residential zone |
|
|
|
|
Has
the tenant to bear the whole or part of the cost of repairs and maintenance?
Give particulars |
Owners
|
|
|
|
|
Is
the property insured? If so, give the policy no. amount for which it is
insured and the annual premium |
Does
not apply Insurance
is to be done as per the bank’s requirements on sanction |
|
|
|
|
Rate
adopted in the valuation |
Rs.
300/- - Rs. 10,000/- for parts of the land per sq mt. Based on the zoning as
applicable |
|
|
|
|
If
sale instances are not available or not relied upon, the basis of arriving at
the land rate |
Market
value of similar properties in and around the area as per market survey |
|
|
|
|
Year
of commencement of construction and year of completion |
Does
no apply. Non developed land |
|
|
|
|
TECHNICAL
DETAILS |
|
|
No
of floors and height of each floor |
The
property is generally a wooded property with no structures on it expect for some
small sheds towards the road side. The upper portion of the property falls
class to the industrial estate on the top of the hill |
|
|
|
|
Plinth
area –floor wise |
Total
area of the plot is admeasuring around 32, 875 sq mts. Area under settlement
zone would be around 3,598 sq mts (approximately) |
|
|
|
|
Landmark
|
Close
to (@half km) Goa Ore Carriers and Chowgule and Co. shipyards at Rassaim |
|
|
|
|
GPS
Coordinates |
15
22 15.68 N and 73 57 26.06 E |
|
|
|
|
VALUATION : The said part of land bearing Survey no. 330 of Loutulim Village is part of property known as CANTURLEM and lies within the jurisdiction of the Village Panchayat of Loutulim and having a total area of around 32,875 sq mts. The said land is steeply sloping and is zoned for Agriculture use. The adjoining properties also are similar, sloping and undeveloped land. The said property is demarcated on site by boundary wall (rubble) and abuts onto the Cortalim - Loutulim, 17 B road on its north and the Verna industrial Estate towards the South. Amenities tike electricity, water supply and public transport are readily available in the locality, while local market, school, health centre, banks etc. are within a distance of about 7 - 8 kms at Cortalim Village. The property is located about l5.0 to 20.0 kms equidistant (almost) from the major towns of Margao, Ponda, Paniim and Vasco, The property consists of a hilly land located at Rassaim, Loutotim, Salcette, Goa. District of South Goa, State of Goa. The property is located around 5 - 7 km away from the Zuari Bridge on the south bank of the river Zuari across the NH - 17 B. Almost the entire south bank of the Zuari river has developed into an equivalent of the ‘Marine industrial Area' between the Mormugao port and the Zuari bridge and again between the Zuari Bridge and the Borim bridge. lt is adjacent to the main NH - 17 B and nearly equidistant from the two Zuari bridges at cortatim and Borim on NH - 17 and NH - 17 B respectively. Maior cities of Goa mainly vasco, Paniim, Margao and ponda are all within a distance of around 15 - 20 kms. The Dabolim international Airport is around 14 Km away, Mormugao Port is around 20 km and Verna Railway station and Industrial Estate within 5 km away. The surroundings have got considerable amount of shipyard developments and make up the main marine Industrial area in Goa with nearly 10 - 12 medium and large units and several small units. The actual land slopes up steeply from the NH – 17 B on the southern bank of the river Zuari towards the verna Industrial Estate on the top of the hill to the south. From the NH - 17 B except for a part of the area adjacent to the road the property is densely wooded and steep towards the top of the hill. The hilly portion is densely wooded and cannot be easily traversed and has several cashew and other trees. The upper portion of the property is close to the Verna Industrial Estate (within 1 km) but is not easily accessible by road on the top of the hill. The nearest industrial unit to this plot would be Bosch and Cipla power station within in the Verna lndustrial Estate. Considering the above mentioned conditions, and the sale rate for similar properties in the vicinity, in my opinion, the value of similar land in the area may be between Rs.300/- and Rs. 500/- per square metre. However land under settlement zone could be between Rs.3,000/- and upto a maxirnum of around Rs.8,500/- in my opinion. Hence the present market value of the land, under settlement zone, in my opinion would be upto a maximum Rs.8,500 x 3,598 sq mts = Rs. 30.583 Millions, Say Rs. 30.500 Millions for the land as above. N. B. Based on a zoning certificate as per the TCP department of the government the land requires to be surveyed and demarcated for arriving at the correct area figure for land under settlement zone. The above figure of 3,598 sq mts may be treated as 'ad hoc' and 'interim' till then. Thus in my opinion, the total value of the above mentioned property under settlement zone in Survey Nos. 330 at Rassaim, Salcette, Goa, as of today, would be upto around Rupees 35.000 Millions. The distress sale / mortgage value may be considered between 60% - 70% (Rs. 18.300 Millions – Rs. 21.350 Millions) of the market value in view of its present conditions or as per the bank’s guidelines as applicable. The realizable value could be normally be between 85% (Rs. 25.925 Millions) and 100% (Rs. 30.500 Millions) of the value as above. The registration value as per the sale deed is not available. The registration rate for the area would be around Rs. 300/- per sq mt and around Rs. 3,000/- or so per sq mt for the settlement land. |
|
------------------------------------------------------------------------------------------------------------------------------
VALUATION REPORT
|
GENERAL
DETAILS |
|
|
Purpose
for which valuation is made |
To
determine the market value of the property |
|
|
|
|
Date
as on which site inspected, valuation made |
20/06/2014,
23/01/2014 |
|
|
|
|
Name
of the Owner / Owners |
M/s. Shirodker Shipyard |
|
|
|
|
If
the property is under joint ownership/ co-ownership, share of each such owner.
Are the Shares undivided? |
No NA NA |
|
|
|
|
Brief description of the property |
Shipyeard
on land having a total area of around 5,025 sq mts. |
|
|
|
|
Location, Street, Ward No. (Postal Address) |
At
Rassaim, Loutolim, Salcette, Goa |
|
|
|
|
Survey/Plot
No. of Land |
Survey
Nos. 320/ 5&6 Loutolim, Salcette, Goa |
|
|
|
|
Is
the property situated in the Residential/ Commercial/ Mixed Area/ Indus trial
area? |
Marine
Industrial Area |
|
|
|
|
Classification
of Locality – High class/ Middle class/ Poor class |
High/
Middle Class |
|
|
|
|
Proximity
to civic amenities like School, Hospital, offices, markets, cinema etc |
All
civic amenities within 12 – 15 km distance almost equidistant from Vasco and Margao
cities |
|
|
|
|
Means
and proximity to surface communication by which the locality is served |
Located
at Rassaim (Loutolim), Salcette, Goa. Public transport is available on the
main NH – 17 B outside |
|
|
|
|
Is
it leasehold, the name lessor/ lessee, nature of lease, dates of commencement
and termination of lease and terms of renewal of lease (i)
Initial Premium (ii)
Ground rent payable per annum (iii)
Unearned increase payable to the lessor in the event of sale of transfer |
No.
Does no apply |
|
|
|
|
Is
there any restrictive covenant in regard to use of land? if so, attach a copy
of the covenant |
The
area falls under the Coastal Regulation Zone and its use is subject to the
same |
|
|
|
|
Are
there any agreement of easements? |
No |
|
|
|
|
Does
the land fall in an area included in any Town Planning Scheme or any
Development Plan of Government or any statutory body: |
Falls
under CRZ |
|
|
|
|
Has
the whole or part of land been notified for acquisition by Government or any
statutory body? Give date of the notification |
Road
Widening (Details are not available ) |
|
|
|
|
Is
the building owner – occupied / tenanted/ both? |
Owners
Occupied - Shipyard |
|
|
|
|
What
is the FAR permissible and percentage actually utilized? |
Area
falls in the CRZ Zone along the South Bank of the river Zuari. Almost
the entire stretch from MPT to zuari bridge and further on towards the Borim bridge
at Loutolim has developed into a Marine Industrial zone over the last decade
or so. |
|
|
|
|
Are
any of the occupants related to, or close business associates of, the owner? |
Does
not apply The
owner is operating a shipyard on the property |
|
|
|
|
Has
the tenant to bear the whole or part of the cost of repairs and maintenance?
Give particulars |
Owners
|
|
|
|
|
If
a pump is installed, who has to bear the cost of maintenance and operation
owner of tenant? |
Owners
|
|
|
|
|
Who
has to bear the cost of electricity charges for lighting of common space like
entrance hall, stairs, passages, compound, etc. – owner of tenant? |
Owners
|
|
|
|
|
Is
the property insured? If so, give the policy no. amount for which it is
insured and the annual premium |
Insurance
is to be done as per the bank’s requirements on sanction |
|
|
|
|
Rate
adopted in the valuation |
Upto
Rs. 6,000/- for the land per sq mt. |
|
|
|
|
If
sale instances are not available or not relied upon, the basis of arriving at
the land rate |
Market
value of similar properties in and around the area as per market survey |
|
|
|
|
Year
of commencement of construction and year of completion |
Completed
between 1989 and 1999 |
|
|
|
|
TECHNICAL
DETAILS |
|
|
No
of floors and height of each floor |
The
property is an industrial shipyard plot with a dry dock and some single floor
sheds |
|
|
|
|
Plinth
area –floor wise |
Total
area of the sheds would be around 389.67 sq mts and the plot admeasuring a
total of around 4,960 sq mts (5,025 less around 65 sq mts in road widening) |
|
|
|
|
Year
of Completion |
Completed
over the period between 1989 and 1999 |
|
|
|
|
Estimated
future life |
Around
20 years for the shed structures and 18 – 20 years for the RCC structures,
dry dock, etc. (Subject to proper maintenance) |
|
|
|
|
Type
of construction |
Dry
dock in RCC structure other structures with masonary walls an sheds with Fabrication |
|
|
|
|
Type
of foundations |
RCC
for the major structures |
|
|
|
|
Walls
|
Mansonary
and Cladding |
|
|
|
|
Door
and Windows |
Aluminium,
glass and wooden doors and glazed windows |
|
|
|
|
Flooring
|
IPS,
ceramic tiles, etc. in the office and sheds and ceramic in the toilets |
|
|
|
|
Finishing
|
Standard
for the office and basic for the other structures |
|
|
|
|
Roofing
and Terracing |
Sheets
|
|
|
|
|
(a)
Internal Wiring – Surface or Concealed (b)
Class of fitting – Superior/ Standard/ Poor |
Surface
Standard |
|
|
|
|
Sanitary
Installation Class
of fittings |
Toilets
Standard |
|
|
|
|
Compound
Wall |
Masonary
along the perimeter as well as retaining (part) wall along the water |
|
|
|
|
Pump
– No. and their horse power |
Yes
|
|
|
|
|
Roads
and paving within the compound, approximate area and type of paving |
Leveling
and soling is done on a regular basis to maintain a level working surface for
the property |
|
|
|
|
Sewage
: If septic tank provided, No. and capacity |
Provided
as required. There is public water supply and electricity in the area. |
|
|
|
|
Landmark
|
Close
to ‘Chowgule’s shipyard’ at Rassaim |
|
|
|
|
VALUATION : The property consists of three main components, land component – land admeasuring around 4,960 sq mts (5,025 less around 65 sq mts in road widening): building component – sheds (including office) admeasuring a total of around 389.67 sq mts and the drydock component on Survey Nos. 320/5 and 6 at Rassaim (Loutolim), Salcette, Goa, District of South Goa, State of Goa. The property is located around 5 -6 km away from the Zuari Bridge, on the south bank of the river Zuari. The entire south bank of the zuari river has developed into an equilent of a ‘Marine Industrial Area’ between the Mormugao port and the Zuari bridge and again between the Zuari Bridge and the Borim bridge. The shipyard is adjacent to the main NH – 17 B and nearly equidistant from the two Zuari bridges at Cortalim and Borim on NH – 17 and NH – 17 B respectively. Major cities of Goa mainly Vasco, Panjim, Margao and Ponda are all within a distance of around 20 kms. The Dabolim International Airport is around 14 -15 Km away, Mormugao Port is around 20 km and Verna Railway station @ 10 km away. The surroundings have got considerable amount of shipyard developments and make up the main marine industrial area in Goa with nearly 10 – 12 medium and large units and several small units. This gives riverbank land a premium value in the normal scenario and there would be high demand for land in the state. These properties would be affected by the CRZ authorities, Captain of Ports, Panchayat, etc. for the purposes of permissions and licensing. Future road widening would also be applicable but this plot has a considerable length (depth) and may not be much affected very much. The total area of the land is around 4,960 sq meters as per the information available made available to me and consists of the following Survey Nos. 320/5&6 at Rassaim, Salcette, Goa. The land lies on the south bank of the river Zuari and is almost equidistant from the two bridges over the river Zuari at Cortalim and Borim. There are several shipyards in the area adjacent to the newly designated NH – 17 B and the river. The land is well developed with regular leveling, compound wall on the land side and retaining wall (partial) on the river side, etc. This includes the main shipyard, along with the dry dock, office, sheds and security cabin. Most of the construction was completed over the last 10 - 20 years back as per the information made available to me. The completed sheds have an area of around 389.67 sq mts, having foundations and fabricated superstructure or masonary. They have been completed around last 10 years back as per the information given to me' The walls are in masonary. Flooring is in ceramic for the main office shed and IPS / concrete for the others. The office shed is air conditioned with the interiors done up and furnished. The other sheds are used as godowns for storage of their material and for use of the machinery. The average total age of these sheds may be considered as upto 40 - 45 years or so. The dry dock and the ancillary equipment structures are the main structures here and have RCC structure and these structures have been completed over 20 back as per the information made available to me and may be considered to have an average life of around 35 years due to the soil and water conditions. Considering the above mentioned conditions, and the sale rate for similar properties in the vicinity, in my opinion, the value of land in the area may be between Rs.5,000/- upto Rs. 7,000/- per square metre of developed land. Hence the present market value of the property in my opinion would be : - Office and sheds 389.67 sq mts x Rs. 10,000 = Rs. 3.897 Millions. Since the construction is more than 10 year old, the depreciated value would be Rs. 3.020 Millions, Say Rs. 3.000 Millions. - The major structure on the land is the Dry dock and the ancilliary equipment. The completed cost for the Dry dock and the ancillary equipment and structures with its RCC and superstructure would work out to around Rs. 45.000 Millions for a new structure. Since the structure is around 20 years old, in my opinion, the value for the Dry dock and the ancilliary equipment would be Rs. 21.857 Millions, Say Rs. 21.000 Millions in its present state. - The land value would in my opinion be Rs. 6,000/- x 4,960 sq mts = Rs. 29.760 Millions, say Rs. 29.700 Millions for the land. These figures include the cost of the compound wall also. Therefore the total value of the property in the present state would be around Rs. 50.700 Millions. Thus in my opinion, the total value of the above mentioned industrial shipyard property belonging to M/s Shirodker Shipyard on Survey Nos. 320/5&6 at Rassaim, Salcette, Goa, as of today, would be around Rs. 53.700 Millions. The distress sale / mortgage value may be considered 60% - 70% in view of its present conditions or as per the bank’s guidelines as applicable. The realizable value of 85% to 100 % of the value in view of the current scenario in the state may not be feasible or practical. The registration value is not available. Registration rates would be around Rs. 3,000/- per sq mt for the land. |
|
------------------------------------------------------------------------------------------------------------------------------
INDEX OF CHARGES: NO
CHARGES EXIST FOR COMPANY
CMT REPORT (Corruption, Money Laundering & Terrorism]
The Public Notice information has been collected from various sources
including but not limited to: The Courts,
1] INFORMATION ON
DESIGNATED PARTY
No exist designating subject or any of its beneficial owners,
controlling shareholders or senior officers as terrorist or terrorist
organization or whom notice had been received that all financial transactions
involving their assets have been blocked or convicted, found guilty or against
whom a judgement or order had been entered in a proceedings for violating
money-laundering, anti-corruption or bribery or international economic or
anti-terrorism sanction laws or whose assets were seized, blocked, frozen or
ordered forfeited for violation of money laundering or international
anti-terrorism laws.
2] Court Declaration :
No records exist to suggest that subject is
or was the subject of any formal or informal allegations, prosecutions or other
official proceeding for making any prohibited payments or other improper
payments to government officials for engaging in prohibited transactions or
with designated parties.
3] Asset Declaration :
No records exist to suggest that the property or assets of the subject
are derived from criminal conduct or a prohibited transaction.
4] Record on Financial
Crime :
Charges or conviction
registered against subject: None
5] on Violation of
Anti-Corruption Laws :
Charges or
investigation registered against subject: None
6] Records on Int’l
Anti-Money Laundering Laws/Standards :
Charges or
investigation registered against subject: None
7] Criminal Records
No
available information exist that suggest that subject or any of its principals
have been formally charged or convicted by a competent governmental authority
for any financial crime or under any formal investigation by a competent
government authority for any violation of anti-corruption laws or international
anti-money laundering laws or standard.
8] Affiliation with
Government :
No record
exists to suggest that any director or indirect owners, controlling
shareholders, director, officer or employee of the company is a government
official or a family member or close business associate of a Government
official.
9] Compensation Package :
Our market
survey revealed that the amount of compensation sought by the subject is fair
and reasonable and comparable to compensation paid to others for similar
services.
10] Press Report :
No press reports / filings exists on
the subject.
CORPORATE GOVERNANCE
MIRA INFORM as part of its Due Diligence do provide comments on
Corporate Governance to identify management and governance. These factors often
have been predictive and in some cases have created vulnerabilities to credit
deterioration.
Our Governance Assessment focuses principally on the interactions
between a company’s management, its Board of Directors, Shareholders and other
financial stakeholders.
CONTRAVENTION
Subject is not known to have contravened any existing local laws,
regulations or policies that prohibit, restrict or otherwise affect the terms
and conditions that could be included in the agreement with the subject.
FOREIGN EXCHANGE RATES
|
Currency |
Unit
|
Indian Rupees |
|
US Dollar |
1 |
Rs.60.43 |
|
|
1 |
Rs.100.12 |
|
Euro |
1 |
Rs.79.74 |
INFORMATION DETAILS
|
Information
Gathered by : |
SVA |
|
|
|
|
Analysis Done by
: |
SUM |
|
|
|
|
Report Prepared
by : |
MRI |
RATING EXPLANATIONS
|
RATING |
STATUS |
PROPOSED CREDIT LINE |
|
|
>86 |
Aaa |
Possesses an extremely sound financial base with the strongest
capability for timely payment of interest and principal sums |
Unlimited |
|
71-85 |
Aa |
Possesses adequate working capital. No caution needed for credit
transaction. It has above average (strong) capability for payment of interest
and principal sums |
Large |
|
56-70 |
A |
Financial & operational base are regarded healthy. General unfavourable
factors will not cause fatal effect. Satisfactory capability for payment of
interest and principal sums |
Fairly Large |
|
41-55 |
Ba |
Overall operation is considered normal. Capable to meet normal
commitments. |
Satisfactory |
|
26-40 |
B |
Capability to overcome financial difficulties seems comparatively
below average. |
Small |
|
11-25 |
Ca |
Adverse factors are apparent. Repayment of interest and principal sums
in default or expected to be in default upon maturity |
Limited with full
security |
|
<10 |
C |
Absolute credit risk exists. Caution needed to be exercised |
Credit not
recommended |
|
-- |
NB |
New Business |
-- |
This report is issued at your request without any
risk and responsibility on the part of MIRA INFORM PRIVATE LIMITED (MIPL)
or its officials.