MIRA
INFORM REPORT
|
Report Date : |
26.08.2014 |
IDENTIFICATION DETAILS
|
Name : |
HEIPLOEG B.V. |
|
|
|
|
Registered Office : |
Panserweg 14 9974SL Zoutkamp |
|
|
|
|
Country : |
|
|
|
|
|
Financials (as on) : |
31.03.2012 |
|
|
|
|
Date of Incorporation : |
01.01.1900 |
|
|
|
|
Com. Reg. No.: |
KvK-nummer: 02022924 |
|
|
|
|
Legal Form : |
Besloten Vennootschap |
|
|
|
|
Line of Business : |
Manufacture of food products |
|
|
|
|
No. of Employees : |
117 |
RATING & COMMENTS
|
MIRA’s Rating : |
B |
|
RATING |
STATUS |
PROPOSED CREDIT LINE |
|
|
26-40 |
B |
Capability to overcome financial difficulties seems comparatively
below average. |
Small |
|
Status : |
Moderate |
|
Payment Behaviour : |
Slow but correct |
|
Litigation : |
Clear |
NOTES :
Any query related to this report can be made
on e-mail : infodept@mirainform.com
while quoting report number, name and date.
ECGC Country Risk Classification List – June 01, 2014
|
Country Name |
Previous Rating (31.03.2014) |
Current Rating (01.06.2014) |
|
|
A1 |
A1 |
|
Risk Category |
ECGC
Classification |
|
Insignificant |
A1 |
|
Low Risk |
A2 |
|
Moderate Low Risk |
B1 |
|
Moderate Risk |
B2 |
|
Moderate High Risk |
C1 |
|
High Risk |
C2 |
|
Very High Risk |
D |
|
Source
: CIA |
Summary
Company name Heiploeg B.V.
Operative address Panserweg 14 9974SL Zoutkamp
Legal form Besloten Vennootschap
Registration number KvK-nummer: 02022924
VAT-number 001082516
|
Year |
2012 |
|
Mutation |
2011 |
|
Mutation |
2010 |
|
Fixed assets |
47.444.000 |
|
638,31 |
6.426.000 |
|
0,47 |
6.396.000 |
|
Total receivables |
42.890.000 |
|
17,97 |
36.357.000 |
|
-10,82 |
40.770.000 |
|
|
|||||||
|
Total equity |
23.071.000 |
|
-15,15 |
27.189.000 |
|
3,55 |
26.257.000 |
|
Short term liabilities |
107.398.000 |
|
6,89 |
100.477.000 |
|
17,39 |
85.595.000 |
|
|
|||||||
|
Net result |
-4.117.000 |
4 |
-542,21 |
931.000 |
|
-86,00 |
6.648.000 |
|
|
|||||||
|
Working capital |
-23.844.000 |
|
-210,57 |
21.564.000 |
|
3,14 |
20.908.000 |
|
Quick ratio |
0,41 |
4 |
-50,00 |
0,82 |
|
5,13 |
0,78 |
Insolvencies
Insolvency Default:
F.14/28
Publications •
Date: 2014-01-29
Characteristics:
18.nne.14.28.F.1300.1.14
Uitspraak faillissement op 28
januari 2014
Court
Magistrate mr.
L.T. de Jonge
Administrator mr.
P. Lettinga
Postbus 96
9700AB
Telephone number: 050-5206520
Contact information
Company name Heiploeg
B.V.
Trade names Heiploeg
B.V.
Operative address Panserweg
14
9974SL Zoutkamp
Correspondence address Postbus
2
9974ZG Zoutkamp
Telephone number 0595405555
Email address info@heiploeg.nl
Website www.heiploeg.nl
Registration
Registration number KvK-nummer:
02022924
Branch number 000015938069
VAT-number 001082516
Status
Active
Memorandum 1962-10-09
Establishment date 1900-01-01
Legal form Besloten
Vennootschap
Legal person since 1972-10-03
Last proposed admendment 2006-02-03
Activities
SBI AGRICULTURE
(01)
Processing and preserving of
fish and fish products (1020)
Manufacture of prepared feeds
for farm animals (1091)
Wholesale of fish (46382)
Exporter Yes
Importer Yes
Goal Tijdens
het faillissement worden de volgende activiteiten verricht: het exploiteren van
een
groothandel in vis, gepelde en
ongepelde garnalen, puf en nest en visconserven;
Garnalenpellerij en garnalen-
en garnalendoppendrogerij. Maal- en menginrichting en
vismeel- en gritfabriek.
Fabricage van grondstoffen voor indische gerechten Im- en/of export
van garnalen en vis. Al
hetgeen tot bovengenoemde behoort, zowel de handel in haar
onbewerkte, verwerkte en
bewerkte producten
Relations
Shareholders Heiploeg
Beheer B.V.
Panserweg 14
9974SL Zoutkamp
Registration number: 020363320000
Insolvency: Default
Percentage: 100%
Companies on same address Amount:
18
Bank details
Accounts
ABN Amro Bank NV
Account number: 40.53.50.007
ING Bank NV
Account number: 41763
ING Bank NV
Account number: 810210
Accounts
Rabobank Nederland
Account number: 32.94.63.748
Management
Active management Heiploeg
Beheer B.V.
Panserweg 14
9974SL Zoutkamp
Registration number: 020363320000
Insolvency: Default
Competence: Fully authorized
Function: Manager
Starting date: 1988-10-05
E.J.C. Wielinga (Eduard
Johannes Christoffel)
Netherlands
Competence: Limited
authorization
Function: Manager
Starting date: 2013-09-02
Date of birth: 1960-11-09,
Leeuwarden, NL
E.B. Abels (Edo Berend)
Netherlands
Competence: Limited
authorization
Function: Manager
Starting date: 2013-09-02
Date of birth: 1969-05-05,
Smallingerland, NL
Active management
W.D. van Dijken (Willem Derk)
Netherland
Competence: Limited
authorization
Function: Proxy
Starting date: 1993-12-28
Date of birth: 1953-02-02,
Eenrum, NL
M. Tjoelker (Meindert)
Netherlands
Competence: Limited
authorization
Function: Proxy
Starting date: 2005-06-01
Date of birth: 1958-12-02,
Grootegast, NL
M.I.K. Boer (Micha Istvan Kai)
Netherlands
Competence: Limited
authorization
Function: Proxy
Starting date: 2008-09-01
Date of birth: 1981-08-19,
Oldehove, NL
H.O. Pouw (Hermanus Onno)
Netherlands
Competence: Limited
authorization
Function: Proxy
Starting date: 2008-09-01
Date of birth: 1965-11-07,
Delfzijl, NL
J.H. Kort (Jan Harmannus)
Netherlands
Competence: Limited
authorization
Function: Proxy
Starting date: 2011-01-12
Date of birth: 1959-01-11, 't
Zandt, NL
J. Cornelissen (Johannes)
Netherlands
Competence: Limited
authorization
Function: Proxy
Starting date: 2013-02-01
Date of birth: 1965-03-31,
Geleen, NL
Involved with the following
companies
• Heitrans B.V.
Panserweg 14
9974SL Zoutkamp
Netherlands
Registration number: 020424670000
Insolvency: Default
Function: Proxy
P. Westra (Patrick)
Netherlands
Competence: Limited
authorization
Function: Proxy
Starting date: 2012-12-01
Date of birth: 1977-01-13,
Ulrum, NL
Employees
Year 2014
2013 2012 2011 2010
Total 117
117 272 30 31
Payments
Description Activities ceased
Key figures
|
Year |
2012 |
2011 |
2010 |
2009 |
2008 |
|
Quick ratio |
0,41 |
0,82 |
0,78 |
0,59 |
0,42 |
|
Current ratio |
0,78 |
1,21 |
1,24 |
1,16 |
0,96 |
|
|
|||||
|
Working capital/ balance total |
-0,18 |
0,17 |
0,19 |
0,13 |
-0,03 |
|
Equity / balance total |
0,18 |
0,21 |
0,23 |
0,19 |
0,17 |
|
Equity / Fixed assets |
0,49 |
4,23 |
4,11 |
3,44 |
0,83 |
|
Equity / liabilities |
0,21 |
0,27 |
0,30 |
0,23 |
0,21 |
|
Balance total / liabilities |
1,21 |
1,27 |
1,30 |
1,23 |
1,21 |
|
|
|||||
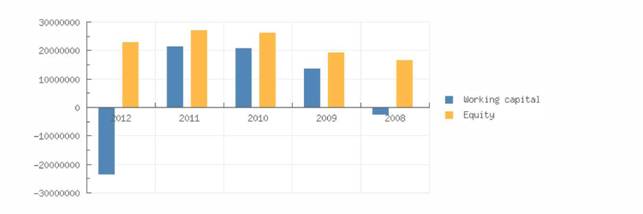
|
Working capital |
-23.844.000 |
21.564.000 |
20.908.000 |
13.913.000 |
-2.830.000 |
|
Equity |
23.071.000 |
27.189.000 |
26.257.000 |
19.610.000 |
16.928.000 |
|
Mutation equity |
-15,15 |
3,55 |
33,90 |
15,84 |
-54,12 |
|
Mutation short term liabilities |
6,89 |
17,39 |
1,13 |
6,83 |
102,29 |
|
|
|||||
|
Return on total assets (ROA) |
-3,80 |
0,99 |
7,93 |
3,41 |
14,15 |
|
Return on equity (ROE) |
-21,56 |
4,66 |
34,09 |
18,13 |
80,87 |
|
Gross profit margin |
-1,53 |
1,21 |
4,66 |
3,72 |
8,85 |
|
Net profit margin |
-1,80 |
0,43 |
3,24 |
1,37 |
4,80 |
|
|
|||||
|
Average collection ratio |
2,13 |
2,17 |
2,40 |
2,28 |
2,64 |
|
Average payment ratio |
5,34 |
5,99 |
5,03 |
4,99 |
6,30 |
|
Equity turnover ratio |
9,93 |
8,01 |
7,81 |
9,86 |
12,35 |
|
Total assets turnover ratio |
1,75 |
1,70 |
1,82 |
1,86 |
2,16 |
|
Fixed assets turnover ratio |
4,83 |
33,90 |
32,06 |
33,95 |
10,26 |
|
Inventory conversion ratio |
5,72 |
5,53 |
5,13 |
3,99 |
4,85 |
|
|
|||||
|
Turnover |
228.994.000 |
217.825.000 |
205.072.000 |
193.386.000 |
209.022.000 |
|
Operating result |
-3.496.000 |
2.645.000 |
9.560.000 |
7.186.000 |
18.502.000 |
|
Net result after taxes |
-4.117.000 |
931.000 |
6.648.000 |
2.642.000 |
10.029.000 |
|
|
|||||
|
Year |
2012 |
2011 |
2010 |
2009 |
2008 |
|
Cashflow |
|
|
|
|
11.600.000 |
|
Gross profit |
|
|
|
|
28.833.000 |
|
EBIT |
-3.496.000 |
2.645.000 |
9.560.000 |
7.186.000 |
18.502.000 |
|
EBITDA |
|
|
|
|
20.073.000 |
Summary
The 2012 financial result structure is a negative working
captial of -23.844.000 euro, which is
in agreement with -18 % of the total assets of the
company.
The working capital has diminished with -210.57 % compared
to previous year. The ratio,
with respect to the total assets of the company has
however, declined.
The deterioration between 2011 and 2012 has mainly been
caused by an increase of the
current liabilities.
The current ratio of the company in 2012 was 0.78. When
the current ratio is below 1.5, the
company may have problems meeting its short-term
obligations.
The quick ratio in 2012 of the company was 0.41. A company
with a Quick Ratio of less than
1 cannot currently pay back its current liabilities.
The 2011 financial result structure is a postive working
captial of 21.564.000 euro, which is in
agreement with 17 % of the total assets of the company.
The working capital has increase with 3.14 % compared to
previous year. The ratio with
respect to the total assets of the company has however,
declined.
The improvement between 2010 and 2011 has mainly been
caused by a current liabilities
reduction.
The current ratio of the company in 2011 was 1.21. When
the current ratio is below 1.5, the
company may have problems meeting its short-term
obligations.
The quick ratio in 2011 of the company was 0.82. A company
with a Quick Ratio of less than
1 cannot currently pay back its current liabilities
Financial statement
Remark annual account The
company is obliged to file its financial statements.
Type of annual account Corporate
Annual account Heiploeg
B.V.
Panserweg 14
9974SL Zoutkamp
Netherlands
Registration number: 020229240000
Insolvency: Default
Balance
|
Year |
2012 |
2011 |
2010 |
2009 |
2008 |
|
End date |
2012-03-31 |
2011-03-31 |
2010-03-31 |
2009-03-31 |
2008-03-31 |
|
Real estate |
|
|
|
|
12.048.000 |
|
Plant and machinery |
|
|
|
|
5.958.000 |
|
Other tangible fixed assets |
|
|
|
|
846.000 |
|
Tangible fixed assets |
8.444.000 |
6.426.000 |
6.229.000 |
5.453.000 |
20.048.000 |
|
Other financial fixed assets |
|
|
|
|
320.000 |
|
Financial fixed assets |
39.000.000 |
|
167.000 |
244.000 |
320.000 |
|
Fixed assets |
47.444.000 |
6.426.000 |
6.396.000 |
5.697.000 |
20.368.000 |
|
|
|||||
|
Raw materials |
|
|
|
|
2.198.000 |
|
Finished products |
|
|
|
|
39.804.000 |
|
Other stock |
|
|
|
|
1.084.000 |
|
Total stock |
40.015.000 |
39.355.000 |
40.007.000 |
48.507.000 |
43.086.000 |
|
Accounts receivable |
33.613.000 |
23.158.000 |
21.974.000 |
17.995.000 |
21.978.000 |
|
Receivables due from group and associated companies |
|
|
|
|
10.992.000 |
|
Other receivables |
9.277.000 |
13.199.000 |
18.796.000 |
20.747.000 |
11.204.000 |
|
Total receivables |
42.890.000 |
36.357.000 |
40.770.000 |
38.742.000 |
33.182.000 |
|
Liquid funds |
649.000 |
46.329.000 |
25.726.000 |
11.304.000 |
134.000 |
|
accruals |
|
|
|
|
212.000 |
|
Current assets |
83.554.000 |
122.041.000 |
106.503.000 |
98.553.000 |
76.402.000 |
|
Total assets |
130.998.000 |
128.467.000 |
112.899.000 |
104.250.000 |
96.770.000 |
|
|
|||||
|
Issued capital |
210.000 |
210.000 |
210.000 |
210.000 |
210.000 |
|
Other reserves |
26.978.000 |
26.048.000 |
19.399.000 |
16.758.000 |
16.718.000 |
|
Non-distributable profit |
4.117.000 |
931.000 |
6.648.000 |
2.642.000 |
|
|
Total reserves |
35.212.000 |
26.979.000 |
26.047.000 |
19.400.000 |
16.718.000 |
|
Total equity |
23.071.000 |
27.189.000 |
26.257.000 |
19.610.000 |
16.928.000 |
|
|
|||||
|
Provisions |
250.000 |
|
|
|
610.000 |
|
Long term interest yielding debt |
279.000 |
801.000 |
1.047.000 |
|
|
|
Long term liabilities |
279.000 |
801.000 |
1.047.000 |
|
|
|
Accounts payable |
22.565.000 |
17.432.000 |
11.362.000 |
7.529.000 |
3.828.000 |
|
Liabilities towards credit institutes |
|
|
|
|
2.803.000 |
|
Short term interest yielding debt |
|
|
|
|
52.113.000 |
|
Tax liabilities |
|
|
|
|
50.000 |
|
Year |
2012 |
2011 |
2010 |
2009 |
2008 |
|
End date |
2012-03-31 |
2011-03-31 |
2010-03-31 |
2009-03-31 |
2008-03-31 |
|
Debts to subsidiary companies |
|
|
|
|
12.534.000 |
|
Other short term liabilities |
84.833.000 |
83.045.000 |
74.233.000 |
77.111.000 |
7.904.000 |
|
Short term liabilities |
107.398.000 |
100.477.000 |
85.595.000 |
84.640.000 |
79.232.000 |
|
Total short and long term liabilities |
107.927.000 |
101.278.000 |
86.642.000 |
84.640.000 |
79.842.000 |
|
Total liabilities |
130.998.000 |
128.467.000 |
112.899.000 |
104.250.000 |
96.770.000 |
Summary
The total assets of the company increased with 1.97 %
between 2011 and 2012.
The total asset increase is retrievable in the fixed asset
growth of 638.31 %.
Asset growth is in contrasts with the net worth decline of
-15.15 %. The company's
indebtedness has, therefore, increased with 6.57 %.
In 2012 the assets of the company were 36.22 % composed of
fixed assets and 63.78 % by
current assets. The assets are being financed by an equity
of 17.61 %, and total debt of
82.39 %.
The total assets of the company increased with 13.79 %
between 2010 and 2011.
The total assets are entirely composed of current assets.
The asset growth has mainly been financed by a debt
increase of 16.89 %. The Net Worth,
however, grew with 3.55 %.
In 2011 the assets of the company were 5 % composed of
fixed assets and 95 % by current
assets. The assets are being financed by an equity of
21.16 %, and total debt of 78.84 %.
Profit and loss
|
Year |
2012 |
2011 |
2010 |
2009 |
2008 |
|
Revenues |
228.994.000 |
217.825.000 |
205.072.000 |
193.386.000 |
212.623.000 |
|
Year |
2012 |
2011 |
2010 |
2009 |
2008 |
|
Other operating income |
|
|
|
|
3.601.000 |
|
Net turnover |
228.994.000 |
217.825.000 |
205.072.000 |
193.386.000 |
209.022.000 |
|
|
|||||
|
Wages and salaries |
|
|
|
|
1.808.000 |
|
Amorization and depreciation |
|
|
|
|
1.571.000 |
|
other operating costs |
|
|
|
|
10.553.000 |
|
Production costs |
|
|
|
|
12.066.000 |
|
Raw materials and consumables |
|
|
|
|
168.123.000 |
|
Operating expenses |
232.490.000 |
215.180.000 |
195.512.000 |
186.200.000 |
194.121.000 |
|
Operating result |
-3.496.000 |
2.645.000 |
9.560.000 |
7.186.000 |
18.502.000 |
|
|
|||||
|
Financial income |
373.000 |
331.000 |
|
|
484.000 |
|
Financial expenses |
1.852.000 |
1.709.000 |
609.000 |
3.631.000 |
5.297.000 |
|
Financial result |
-1.479.000 |
-1.378.000 |
-609.000 |
-3.631.000 |
-4.813.000 |
|
Result on ordinary operations before taxes |
-4.975.000 |
1.267.000 |
8.951.000 |
3.555.000 |
13.689.000 |
|
|
|||||
|
Taxation on the result of ordinary activities |
-858.000 |
336.000 |
2.303.000 |
913.000 |
3.660.000 |
|
Result of ordinary activities after taxes |
-4.117.000 |
931.000 |
6.648.000 |
2.642.000 |
10.029.000 |
|
|
|||||
|
Net result |
-4.117.000 |
931.000 |
6.648.000 |
2.642.000 |
10.029.000 |
Summary
The turnover of the company grew with 5.13 % between 2011
and 2012.
The operating result of the company declined with -232.17
% between 2011 and 2012. This
evolution implies an decrease of the company's economic
profitability.
The result of these changes is a reduction of the
company's Economic Profitability of -483.84
% of the analysed period, being equal to 2011 % in the
year 2012.
Despite the decline the assets turnover increased by 2.94
% reaching 1.75.
The Net Result of the company increased by -542.21 %
between 2011 and 2012.
The company's Financial Profitability has been positively
affected by the financial activities in
comparison to the EBITs behaviour. The result of these
variations is a profitability increase of
-562.66 % of the analysed period, being -21.56 % in the
year 2012.
The company's financial profitability has been positively
affected by its financial structure.
The turnover of the company grew with 6.22 % between 2010
and 2011.
The operating result of the company declined with -72.33 %
between 2010 and 2011. This
evolution implies an decrease of the company's economic
profitability.
The result of these changes is a reduction of the
company's Economic Profitability of -87.52
% of the analysed period, being equal to 2010 % in the
year 2011.
This fall has contributed to a asset turnover decrease,
whose index evolved from -6.59 to a
level of 1.7.
The Net Result of the company increased by -86 % between
2010 and 2011.
The company's Financial Profitability has been positively
affected by the financial activities in
comparison to the EBITs behaviour. The result of these
variations is a profitability increase of
-86.33 % of the analysed period, being 4.66 % in the year
2011.
The company's financial profitability has been positively
affected by its financial structure
Analysis
Branch (SBI) Manufacture
of food products (10)
Region Groningen
In the Netherlands 6059 of the
companies are registered with the SBI code 10
In the region Groningen 184 of
the companies are registered with the SBI code 10
In the Netherlands 140 of the
bankrupcties are published within this sector
In the region Groningen 8 of
the bankruptcies are published within this sector
The risk of this specific
sector in the Netherlands is normal
The risk of this specific
sector in the region Groningen is normal
Publications
Filings 29-03-2013:
De jaarrekening over 2012 (gebroken boekjaar) is gepubliceerd.
04-05-2012: De jaarrekening
over 2011 (gebroken boekjaar) is gepubliceerd.
05-04-2011: De jaarrekening
over 2009 (gebroken boekjaar) is gepubliceerd.
31-03-2011: De jaarrekening
over 2010 (gebroken boekjaar) is gepubliceerd.
Functions 19-12-2013:
Per 02-09-2013 is gevolmachtigde Edo Berend Abels in functie getreden.
11-10-2013: Per 02-09-2013 is
gevolmachtigde Eduard Johannes Christoffel Wielinga in
functie getreden.
25-02-2013: Per 01-02-2013 is
gevolmachtigde Johannes Cornelissen in functie getreden.
24-12-2012: Per 01-12-2012 is
gevolmachtigde Patrick Westra in functie getreden.
30-11-2012: Per 01-10-2012 is
gevolmachtigde Jan Ernst Veenman uit functie getreden.
15-11-2012: Per 26-09-2012 is gevolmachtigde
Ramon Diego Mendes de Leon uit functie
getreden.
15-11-2012: Per 26-09-2012 is
gevolmachtigde Willem Smit uit functie getreden.
15-04-2011: Per 07-04-2011 is
gevolmachtigde Ronny Marinus Johannes Koerhuis uit functie
getreden.
21-01-2011: Per 12-01-2011 is
gevolmachtigde Jan Harmannus Kort in functie getreden.
21-01-2011: Per 12-01-2011 is
gevolmachtigde Onno Nienhuis uit functie getreden
21-01-2011: Per 12-01-2011 is
gevolmachtigde Bernard Tjalling Anton Oosterbaan uit functie
getreden.
30-09-2010: Per 30-09-2010 is
gevolmachtigde Jan Berent Vogel uit functie getreden.
16-09-2010: Per 15-09-2010 is
gevolmachtigde Ronny Marinus Johannes Koerhuis in functie
Getreden
Company structure
Relations 9
Heiploeg Holding B.V.
Panserweg 14
9974SL ZOUTKAMP
Netherlands
Registration number: 302100200000
Insolvency: Default
• Heiploeg Beheer B.V.
Panserweg 14
9974SL Zoutkamp
Netherlands
Registration number: 020363320000
Insolvency: Default
• Heiploeg B.V.
Panserweg 14
9974SL Zoutkamp
Netherlands
Registration number: 020229240000
Insolvency: Default
FOREIGN EXCHANGE RATES
|
Currency |
Unit
|
Indian Rupees |
|
US Dollar |
1 |
Rs.60.42 |
|
|
1 |
Rs.100.11 |
|
Euro |
1 |
Rs.79.74 |
INFORMATION DETAILS
|
Analysis Done by
: |
RAS |
|
|
|
|
Report Prepared
by : |
PDT |
RATING EXPLANATIONS
|
RATING |
STATUS |
PROPOSED CREDIT LINE |
|
|
|
>86 |
Aaa |
Possesses an extremely sound financial base with the strongest
capability for timely payment of interest and principal sums |
Unlimited |
|
|
71-85 |
Aa |
Possesses adequate working capital. No caution needed for credit
transaction. It has above average (strong) capability for payment of interest
and principal sums |
Large |
|
|
56-70 |
A |
Financial & operational base are regarded healthy. General
unfavourable factors will not cause fatal effect. Satisfactory capability for
payment of interest and principal sums |
Fairly Large |
|
|
41-55 |
Ba |
Overall operation is considered normal. Capable to meet normal
commitments. |
Satisfactory |
|
|
26-40 |
B |
Capability to overcome financial difficulties seems comparatively
below average. |
Small |
|
|
11-25 |
Ca |
Adverse factors are apparent. Repayment of interest and principal sums
in default or expected to be in default upon maturity |
Limited with
full security |
|
|
<10 |
C |
Absolute credit risk exists. Caution needed to be exercised |
Credit not
recommended |
|
|
-- |
NB |
New Business |
-- |
|
This score serves as a reference to assess SC’s credit risk
and to set the amount of credit to be extended. It is calculated from a composite
of weighted scores obtained from each of the major sections of this report. The
assessed factors and their relative weights (as indicated through %) are as
follows:
Financial
condition (40%) Ownership
background (20%) Payment
record (10%)
Credit history
(10%) Market trend
(10%) Operational
size (10%)
This report is issued at your request without any
risk and responsibility on the part of MIRA INFORM PRIVATE LIMITED (MIPL)
or its officials.