MIRA
INFORM REPORT
|
Report Date : |
26.08.2014 |
IDENTIFICATION DETAILS
|
Name : |
PARASMANI COLD STORAGE PRIVATE LIMITED |
|
|
|
|
Registered
Office : |
Survey No. 622/1, Krishna Kanan Estate, |
|
|
|
|
Country : |
|
|
|
|
|
Financials (as
on) : |
31.03.2014 |
|
|
|
|
Date of
Incorporation : |
22.05.2009 |
|
|
|
|
Com. Reg. No.: |
04-057036 |
|
|
|
|
Capital
Investment / Paid-up Capital : |
Rs. 6.000 Millions |
|
|
|
|
CIN No.: [Company Identification
No.] |
U63022GJ2009PTC057036 |
|
|
|
|
TAN No.: [Tax Deduction &
Collection Account No.] |
AHMP06954D |
|
|
|
|
PAN No.: [Permanent Account No.] |
AAFCP1306C |
|
|
|
|
Legal Form : |
Private Limited Liability Company |
|
|
|
|
Line of Business
: |
Providing Cold
Storage Services. |
|
|
|
|
No. of Employees
: |
7 (Approximately) |
RATING & COMMENTS
|
MIRA’s Rating : |
B (27) |
|
RATING |
STATUS |
PROPOSED CREDIT LINE |
|
|
26-40 |
B |
Capability to overcome financial difficulties seems comparatively
below average. |
Small |
|
Status : |
Moderate |
|
|
|
|
Payment Behaviour : |
Slow but correct |
|
|
|
|
Litigation : |
Clear |
|
|
|
|
Comments : |
Subject is an established company having moderate track record. The company has incurred continuous accumulated losses. However, trade relations are fair. Business is active. Payment terms
are reported as slow but correct. The company can be considered for business dealings with some caution.
|
NOTES :
Any query related to this report can be made
on e-mail : infodept@mirainform.com
while quoting report number, name and date.
ECGC Country Risk Classification List – June 1, 2014
|
Country Name |
Previous Rating (31.03.2014) |
Current Rating (01.06.2014) |
|
India |
A1 |
A1 |
|
Risk Category |
ECGC
Classification |
|
Insignificant |
A1 |
|
Low |
A2 |
|
Moderate |
B1 |
|
High |
B2 |
|
Very High |
C1 |
|
Restricted |
C2 |
|
Off-credit |
D |
INDIAN ECONOMIC OVERVIEW
N E W S
As per the latest IMF study, the total weigh of emerging markets in the
GDP of the world on a purchasing power parity basis has seen a sizeable shift.
It highlights how as against 51 % in 2005, the emerging economies now account
for close to 56 % of the global purchasing power GDP as per the latest survey.
And with the emerging economies growing at a faster rate than their developed
counterparts, there are every possibility that the their share goes up further
in the coming years. China may surpass the US over the next few years.
Politics and economics are very intricately connected. They tend to
influence each other in ways that could be very complex and far-reaching. The
prospects of the India’s economy have been seriously compromised due to
political corruption. High inflation, poor standard of living are to a great
extent a result of rampant corruption in the country. China on the other hand,
seems to be facing diametrically opposite challenge. American hedge fund manager
Jim Chanos has been keenly following the political and economic development in
the dragon economy and has figured out something that is quite worrying. He is
of the view that the Chinese economy could be heading toward trouble on account
of new Chinese President Xi Jingping’s very aggressive anti-corruption drive.
Chanos believes that many things such as apartment sales, luxury products, etc.
were largely bought with dirty money. And it is now beginning to impact
consumption. This may indeed be bad news for an economy that is struggling to
transition from an investment-driven export-oriented economy to a domestic
consumption-driven economy.
A study published by Firstpost has revealed that asset classes like real
estate and equities were the biggest beneficiaries of the liberalization
policies. A firm called Ciane Analytics studied returns from assets
including equities, gold, fixed deposits, G-Secs and real estate since 1991.
Real estate outperformed every other asset classes during the 23-year period
with an annualized return of 20 % ! Equities came in second with annualized
return of 15.5 % ! However, while these returns may seem mouthwatering, the
fact is that the return from equities adjusted for inflation came down to just
7.1 %.
Some brief news are as under
. R-Power to buy Jaypee’s hydro assets
. Investors await justice in NSEL case
. India seeks MFN status from Pakistan ahead of meeting
. Ukrain’s clashes with rebels hinder MH17 crash investigation
. India exploring merger of state-owned hydro PSUs
..Higher costs weigh down profit growth to slowest in 9 quarters
..Wal-Mart to expand wholesale business in India
. GMR group moves to strengthen balance sheet
. Central Bank to sell 4 % stake to Life Insurance Corporation
. Tata Chemicals plans to raise up to Rs 10000 mn.
RBI DEFAULTERS’ LIST STATUS
Subject’s name is not enlisted as a defaulter
in the publicly available RBI Defaulters’ list.
EPF (Employee Provident Fund) DEFAULTERS’ LIST STATUS
Subject’s name is not enlisted as a defaulter
in the publicly available EPF (Employee Provident Fund) Defaulters’ list as of
31-03-2014.
INFORMATION PARTED BY
|
Name : |
Mr. Nilesh Shah |
|
Contact No.: |
91-9825787833 |
|
Date : |
25.08.2014 |
LOCATIONS
|
Registered Office : |
Survey No. 622/1, Krishna Kanan Estate, Dhwani Weigh Bridge, Modasa Road, Dehgam, District Gandhinagar – 382305, Gujarat, India |
|
Tel. No.: |
Not Available |
|
Mobile No.: |
91-9825787833 [Mr. Nilesh Shah] |
|
Fax No.: |
Not Available |
|
E-Mail : |
|
|
Location : |
Owned |
DIRECTORS
AS ON 30.09.2013
|
Name : |
Mr. Dineshkumar Pyarelal Shah |
||||||||||||||||||||||||||||||||||||
|
Designation : |
Director |
||||||||||||||||||||||||||||||||||||
|
Address : |
5, Umiya Society, College Road, Dehgam - 382305, Gujarat, India |
||||||||||||||||||||||||||||||||||||
|
Date of Birth/Age : |
01.02.1960 |
||||||||||||||||||||||||||||||||||||
|
Date of Appointment : |
22.05.2009 |
||||||||||||||||||||||||||||||||||||
|
DIN No.: |
00460807 |
||||||||||||||||||||||||||||||||||||
|
Other Directorship :
|
|||||||||||||||||||||||||||||||||||||
|
|
|
||||||||||||||||||||||||||||||||||||
|
Name : |
Mr. Phoolchand Ruplal Maheshwari |
||||||||||||||||||||||||||||||||||||
|
Designation : |
Director |
||||||||||||||||||||||||||||||||||||
|
Address : |
B.2, Middle Class Society, Dafnala, Shahibaug, Ahmedabad - 380004,
Gujarat, India |
||||||||||||||||||||||||||||||||||||
|
Date of Birth/Age : |
11.10.1949 |
||||||||||||||||||||||||||||||||||||
|
Date of Appointment : |
22.05.2009 |
||||||||||||||||||||||||||||||||||||
|
DIN No.: |
01899338 |
||||||||||||||||||||||||||||||||||||
|
Other Directorship :
|
|||||||||||||||||||||||||||||||||||||
|
|
|
||||||||||||||||||||||||||||||||||||
|
Name : |
Mr. Manishkumar Ashokkumar Shah |
||||||||||||||||||||||||||||||||||||
|
Designation : |
Director |
||||||||||||||||||||||||||||||||||||
|
Address : |
Jai Ambe Society, Near G.E.B., At-Dahegam, Gandhinagar - 382305,
Gujarat, India |
||||||||||||||||||||||||||||||||||||
|
Date of Birth/Age : |
01.03.1972 |
||||||||||||||||||||||||||||||||||||
|
Date of Appointment : |
01.06.2009 |
||||||||||||||||||||||||||||||||||||
|
DIN No.: |
02665877 |
||||||||||||||||||||||||||||||||||||
|
|
|
||||||||||||||||||||||||||||||||||||
|
Name : |
Mr. Dhansukhbhai Dayabhai Patel |
||||||||||||||||||||||||||||||||||||
|
Designation : |
Director |
||||||||||||||||||||||||||||||||||||
|
Address : |
3, Geeta Society, Dahegam-18, Dahegam Gandhinagar - 382305, Gujarat,
India |
||||||||||||||||||||||||||||||||||||
|
Date of Birth/Age : |
07.08.1955 |
||||||||||||||||||||||||||||||||||||
|
Date of Appointment : |
01.06.2009 |
||||||||||||||||||||||||||||||||||||
|
DIN No.: |
02665880 |
||||||||||||||||||||||||||||||||||||
|
|
|
||||||||||||||||||||||||||||||||||||
|
Name : |
Mr. Arvindbhai Patel |
||||||||||||||||||||||||||||||||||||
|
Designation : |
Director |
||||||||||||||||||||||||||||||||||||
|
Address : |
949.1, Umiya Farm, Nandol, Ta. Dahegam, Dist. Ahmedabad, Dahegam -
382305, Gujarat, India |
||||||||||||||||||||||||||||||||||||
|
Date of Birth/Age : |
23.11.1958 |
||||||||||||||||||||||||||||||||||||
|
Date of Appointment : |
01.06.2009 |
||||||||||||||||||||||||||||||||||||
|
DIN No.: |
02665882 |
||||||||||||||||||||||||||||||||||||
|
|
|
||||||||||||||||||||||||||||||||||||
|
Name : |
Mr. Govindbhai Valjibhai Patel |
||||||||||||||||||||||||||||||||||||
|
Designation : |
Director |
||||||||||||||||||||||||||||||||||||
|
Address : |
4.9.1.D, Sarvoday Farm Nandol Road, Ta., Dahegam, District Ahmedabad
Dahegam, Gujarat, India |
||||||||||||||||||||||||||||||||||||
|
Date of Birth/Age : |
09.06.1956 |
||||||||||||||||||||||||||||||||||||
|
Date of Appointment : |
01.06.2009 |
||||||||||||||||||||||||||||||||||||
|
DIN No.: |
02674192 |
||||||||||||||||||||||||||||||||||||
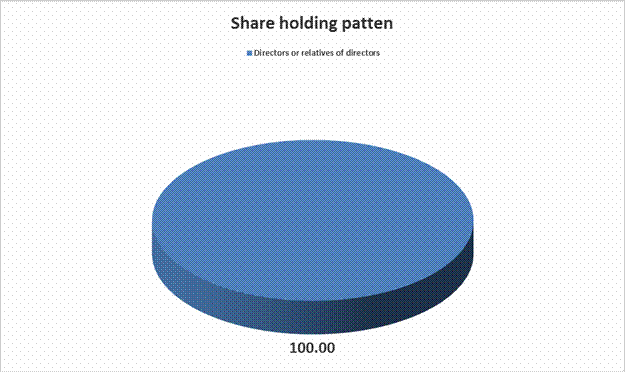
MAJOR SHAREHOLDERS / SHAREHOLDING PATTERN
AS ON 30.09.2013
NOTE: SHAREHOLDING DETAILS FILE ATTACHED
AS ON 30.09.2013
|
Equity Share Breakup |
Percentage of Holding |
|
Category |
|
|
Directors
or relatives of directors |
100.00 |
|
|
|
|
Total |
100.00 |
BUSINESS DETAILS
|
Line of Business : |
Providing Cold
Storage Services. |
|
|
|
|
Terms : |
|
|
Selling : |
Cash |
GENERAL INFORMATION
|
Customers : |
End Users |
||||||||||||||
|
|
|
||||||||||||||
|
No. of Employees : |
7 (Approximately) |
||||||||||||||
|
|
|
||||||||||||||
|
Bankers : |
· State Bank of India Station Road, Taluka Dehgam, District Gandhinagar -
382305, Gujarat, India |
||||||||||||||
|
|
|
||||||||||||||
|
Facilities : |
|
|
|
|
|
Banking
Relations : |
-- |
|
|
|
|
Auditors : |
|
|
Name : |
S. K. Chechani and Associates Chartered Accountants |
|
Address : |
305, Abhishek Plaza, B/H Navgujarat College, Ashram Road,
Ahmedabad – 380014, Gujarat, India |
|
Tel. No.: |
91-79-27541561 |
|
E-Mail : |
|
|
Income-tax
PAN of auditor or auditor's firm : |
ACEFS8828C |
CAPITAL STRUCTURE
AS ON 31.03.2014
Authorised Capital :
|
No. of Shares |
Type |
Value |
Amount |
|
|
|
|
|
|
600,000 |
Equity Shares |
Rs. 10/- each |
Rs. 6.000 Millions |
|
|
|
|
|
Issued, Subscribed & Paid-up Capital :
|
No. of Shares |
Type |
Value |
Amount |
|
|
|
|
|
|
600,000 |
Equity Shares |
Rs. 10/- each |
Rs. 6.000 Millions |
|
|
|
|
|
FINANCIAL DATA
[all figures are
in Rupees Millions]
ABRIDGED BALANCE
SHEET
|
SOURCES OF FUNDS |
31.03.2014 |
31.03.2013 |
31.03.2012 |
|
I.
EQUITY AND LIABILITIES |
|
|
|
|
(1)Shareholders' Funds |
|
|
|
|
(a) Share Capital |
6.000 |
6.000 |
6.000 |
|
(b) Reserves & Surplus |
(2.066) |
(4.092) |
(4.850) |
|
(c) Money received against share warrants |
0.000 |
0.000 |
0.000 |
|
|
|
|
|
|
(2) Share Application money pending
allotment |
0.000 |
0.000 |
0.000 |
|
Total Shareholders’
Funds (1) + (2) |
3.934 |
1.908 |
1.150 |
|
|
|
|
|
|
(3) Non-Current Liabilities |
|
|
|
|
(a) long-term borrowings |
25.980 |
28.652 |
31.355 |
|
(b) Deferred tax
liabilities (Net) |
0.000 |
0.000 |
0.146 |
|
(c)
Other long term liabilities |
0.000 |
0.000 |
0.000 |
|
(d)
long-term provisions |
0.000 |
0.000 |
0.000 |
|
Total
Non-current Liabilities (3) |
25.980 |
28.652 |
31.501 |
|
|
|
|
|
|
(4) Current Liabilities |
|
|
|
|
(a) Short term borrowings |
0.400 |
0.556 |
0.935 |
|
(b) Trade payables |
0.065 |
0.042 |
0.028 |
|
(c) Other current liabilities |
1.061 |
0.864 |
1.196 |
|
(d)
Short-term provisions |
0.000 |
0.000 |
0.000 |
|
Total
Current Liabilities (4) |
1.526 |
1.462 |
2.159 |
|
|
|
|
|
|
TOTAL |
31.440 |
32.022 |
34.810 |
|
|
|
|
|
|
II.
ASSETS |
|
|
|
|
(1) Non-current assets |
|
|
|
|
(a) Fixed Assets |
|
|
|
|
(i) Tangible assets |
19.499 |
22.226 |
28.132 |
|
(ii) Intangible Assets |
0.000 |
0.000 |
0.000 |
|
(iii) Capital work-in-progress |
0.000 |
0.000 |
0.000 |
|
(iv) Intangible assets under development |
0.000 |
0.000 |
0.000 |
|
(b) Non-current
Investments |
0.000 |
0.000 |
0.000 |
|
(c) Deferred tax assets (net) |
0.742 |
0.313 |
0.000 |
|
(d) Long-term Loan and Advances |
0.876 |
0.876 |
0.876 |
|
(e)
Other Non-current assets |
0.000 |
0.201 |
0.402 |
|
Total
Non-Current Assets |
21.117 |
23.616 |
29.410 |
|
|
|
|
|
|
(2) Current assets |
|
|
|
|
(a) Current investments |
0.000 |
0.000 |
0.000 |
|
(b) Inventories |
0.000 |
0.000 |
0.000 |
|
(c) Trade receivables |
4.623 |
3.203 |
1.440 |
|
(d) Cash and cash equivalents |
5.580 |
5.031 |
2.548 |
|
(e) Short-term loans and advances |
0.120 |
0.172 |
1.412 |
|
(f) Other current assets |
0.000 |
0.000 |
0.000 |
|
Total Current Assets |
10.323 |
8.406 |
5.400 |
|
|
|
|
|
|
TOTAL |
31.440 |
32.022 |
34.810 |
PROFIT & LOSS
ACCOUNT
|
|
PARTICULARS |
31.03.2014 |
31.03.2013 |
31.03.2012 |
|
|
|
SALES |
|
|
|
|
|
|
|
Revenue from Operations |
10.758 |
9.556 |
8.799 |
|
|
|
Other Income |
0.931 |
0.500 |
1.545 |
|
|
|
TOTAL (A) |
11.689 |
10.056 |
10.344 |
|
|
|
|
|
|
|
|
Less |
EXPENSES |
|
|
|
|
|
|
|
Employees benefits expense |
1.095 |
0.482 |
0.588 |
|
|
|
Administrative expense |
3.371 |
2.782 |
3.172 |
|
|
|
TOTAL (B) |
4.466 |
3.264 |
3.760 |
|
|
|
|
|
|
|
|
Less |
PROFIT
BEFORE INTEREST, TAX, DEPRECIATION AND AMORTISATION (A-B) (C) |
7.223 |
6.792 |
6.584 |
|
|
|
|
|
|
|
|
|
Less |
FINANCIAL
EXPENSES (D) |
2.328 |
2.867 |
3.346 |
|
|
|
|
|
|
|
|
|
|
PROFIT
BEFORE TAX, DEPRECIATION AND AMORTISATION (C-D) (E) |
4.895 |
3.925 |
3.238 |
|
|
|
|
|
|
|
|
|
Less/ Add |
DEPRECIATION/
AMORTISATION (F) |
2.928 |
3.607 |
2.892 |
|
|
|
|
|
|
|
|
|
|
PROFIT BEFORE
TAX (E-F) (G) |
1.967 |
0.318 |
0.346 |
|
|
|
|
|
|
|
|
|
Less |
TAX (H) |
(0.060) |
(0.440) |
0.075 |
|
|
|
|
|
|
|
|
|
|
PROFIT AFTER TAX
(G-H) (I) |
2.027 |
0.758 |
0.271 |
|
|
|
|
|
|
|
|
|
|
Earnings Per
Share (Rs.) |
3.38 |
1.26 |
0.45 |
|
KEY RATIOS
|
PARTICULARS |
|
31.03.2014 |
31.03.2013 |
31.03.2012 |
|
(%) |
17.34 |
7.54 |
2.62 |
|
|
|
|
|
|
|
|
Net Profit Margin (PBT/Sales) |
(%) |
18.28 |
3.33 |
3.93 |
|
|
|
|
|
|
|
Return on Total Assets (PBT/Total Assets} |
(%) |
6.41 |
1.00 |
0.99 |
|
|
|
|
|
|
|
Return on Investment (ROI) (PBT/Networth) |
|
0.50 |
0.17 |
0.30 |
|
|
|
|
|
|
|
Debt Equity Ratio (Total Debt/Networth) |
|
6.71 |
15.31 |
28.08 |
|
|
|
|
|
|
|
Current Ratio (Current Asset/Current Liability) |
|
6.76 |
5.75 |
2.50 |
FINANCIAL ANALYSIS
[all figures are
in Rupees Millions]
DEBT EQUITY RATIO
|
Particular |
31.03.2012 |
31.03.2013 |
31.03.2014 |
|
|
(Rs.
In Millions) |
(Rs.
In Millions) |
(Rs.
In Millions) |
|
Share Capital |
6.000 |
6.000 |
6.000 |
|
Reserves & Surplus |
(4.850) |
(4.092) |
(2.066) |
|
Net
worth |
1.150 |
1.908 |
3.934 |
|
|
|
|
|
|
long-term borrowings |
31.355 |
28.652 |
25.980 |
|
Short term borrowings |
0.935 |
0.556 |
0.400 |
|
Total
borrowings |
32.290 |
29.208 |
26.380 |
|
Debt/Equity ratio |
28.078 |
15.308 |
6.706 |
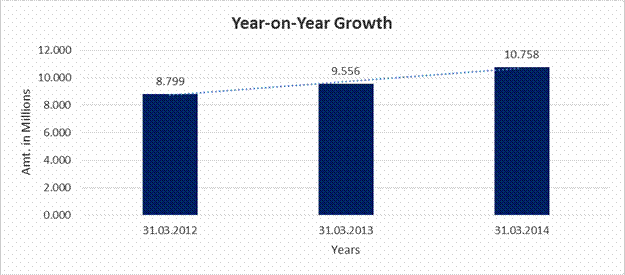
YEAR-ON-YEAR GROWTH
|
Year on Year Growth |
31.03.2012 |
31.03.2013 |
31.03.2014 |
|
|
(Rs.
In Millions) |
(Rs.
In Millions) |
(Rs.
In Millions) |
|
Sales |
8.799 |
9.556 |
10.758 |
|
|
|
8.603 |
12.578 |
NET PROFIT MARGIN
|
Net Profit Margin |
31.03.2012 |
31.03.2013 |
31.03.2014 |
|
|
(Rs.
In Millions) |
(Rs.
In Millions) |
(Rs.
In Millions) |
|
Sales |
8.799 |
9.556 |
10.758 |
|
Profit |
0.271 |
0.758 |
2.027 |
|
|
3.08% |
7.93% |
18.84% |
LOCAL AGENCY FURTHER INFORMATION
|
Sr. No. |
Check List by Info Agents |
Available in
Report (Yes / No) |
|
1] |
Year of Establishment |
Yes |
|
2] |
Locality of the firm |
Yes |
|
3] |
Constitutions of the firm |
Yes |
|
4] |
Premises details |
No |
|
5] |
Type of Business |
Yes |
|
6] |
Line of Business |
Yes |
|
7] |
Promoter's background |
Yes |
|
8] |
No. of employees |
Yes |
|
9] |
Name of person contacted |
Yes |
|
10] |
Designation of contact
person |
No |
|
11] |
Turnover of firm for last
three years |
Yes |
|
12] |
Profitability for last
three years |
Yes |
|
13] |
Reasons for variation
<> 20% |
-- |
|
14] |
Estimation for coming
financial year |
Yes |
|
15] |
Capital in the business |
Yes |
|
16] |
Details of sister
concerns |
No |
|
17] |
Major suppliers |
No |
|
18] |
Major customers |
No |
|
19] |
Payments terms |
Yes |
|
20] |
Export / Import details
(if applicable) |
No |
|
21] |
Market information |
-- |
|
22] |
Litigations that the firm
/ promoter involved in |
-- |
|
23] |
Banking Details |
Yes |
|
24] |
Banking facility details |
Yes |
|
25] |
Conduct of the banking
account |
-- |
|
26] |
Buyer visit details |
-- |
|
27] |
Financials, if provided |
Yes |
|
28] |
Incorporation details, if
applicable |
Yes |
|
29] |
Last accounts filed at
ROC |
Yes |
|
30] |
Major Shareholders, if
available |
Yes |
|
31] |
Date of Birth of
Proprietor/Partner/Director, if available |
Yes |
|
32] |
PAN of
Proprietor/Partner/Director, if available |
No |
|
33] |
Voter ID No of
Proprietor/Partner/Director, if available |
No |
|
34] |
External Agency Rating,
if available |
No |
------------------------------------------------------------------------------------------------------------------------------
UNSECURED LOANS
|
UNSECURED LOANS |
31.03.2013 (Rs.
In Millions) |
|
LONG-TERM
BORROWINGS |
|
|
Loans and advance from related parties |
10.655 |
|
|
|
|
Total |
10.655 |
------------------------------------------------------------------------------------------------------------------------------
BALANCE SHEET
(RS. IN MILLIONS)
|
PARTICULARS |
2015 |
2016 |
2017 |
2018 |
2019 |
2020 |
2021 |
|
LIABILITIES |
|
|
|
|
|
|
|
|
Equity Share Capital |
10.000 |
10.000 |
10.000 |
10.000 |
10.000 |
10.000 |
10.000 |
|
Share Premium |
0.000 |
0.000 |
0.000 |
0.000 |
0.000 |
0.000 |
0.000 |
|
Reserves and Surplus |
1.016 |
4.046 |
11.597 |
22.550 |
36.604 |
53.787 |
74.952 |
|
|
11.016 |
14.046 |
21.597 |
32.550 |
46.604 |
63.787 |
84.952 |
|
|
|
|
|
|
|
|
|
|
Unsecured Loan - Promoters |
21.905 |
21.905 |
21.905 |
21.905 |
21.905 |
21.905 |
21.905 |
|
|
|
|
|
|
|
|
|
|
Working Capital |
5.000 |
5.000 |
5.000 |
5.000 |
5.000 |
5.000 |
5.000 |
|
|
|
|
|
|
|
|
|
|
Term Loan-Old |
10.225 |
5.125 |
0.000 |
0.000 |
0.000 |
0.000 |
0.000 |
|
Term Loan-New |
29.610 |
24.935 |
20.260 |
15.584 |
10.909 |
6.234 |
1.558 |
|
|
|
|
|
|
|
|
|
|
Deferred Tax Liability |
0.000 |
0.000 |
0.000 |
0.000 |
0.000 |
0.000 |
0.000 |
|
|
|
|
|
|
|
|
|
|
TOTAL |
77.757 |
71.011 |
68.762 |
75.040 |
84.419 |
96.925 |
113.415 |
|
|
|
|
|
|
|
|
|
|
ASSETS |
|
|
|
|
|
|
|
|
Gross Block |
76.746 |
76.746 |
76.746 |
76.746 |
76.746 |
76.746 |
76.746 |
|
Normal Capital Expenditure |
0.000 |
0.000 |
0.000 |
0.000 |
0.000 |
0.000 |
0.000 |
|
|
76.746 |
76.746 |
76.746 |
76.746 |
76.746 |
76.746 |
76.746 |
|
|
|
|
|
|
|
|
|
|
Depreciation |
21.623 |
29.533 |
35.881 |
41.038 |
45.278 |
48.804 |
51.768 |
|
Net
Block |
55.123 |
47.213 |
40.865 |
35.708 |
31.468 |
27.942 |
24.978 |
|
|
|
|
|
|
|
|
|
|
Investments |
0.000 |
0.000 |
0.000 |
0.000 |
0.000 |
0.000 |
0.000 |
|
|
|
|
|
|
|
|
|
|
CURRENT ASSETS |
|
|
|
|
|
|
|
|
Inventories |
|
|
|
|
|
|
|
|
Raw material |
0.000 |
0.000 |
0.000 |
0.000 |
0.000 |
0.000 |
0.000 |
|
|
|
|
|
|
|
|
|
|
Stock in process |
0.000 |
0.000 |
0.000 |
0.000 |
0.000 |
0.000 |
0.000 |
|
|
|
|
|
|
|
|
|
|
Finished goods |
0.000 |
0.000 |
0.000 |
0.000 |
0.000 |
0.000 |
0.000 |
|
|
|
|
|
|
|
|
|
|
Stores, Spares consumables |
0.000 |
0.000 |
0.000 |
0.000 |
0.000 |
0.000 |
0.000 |
|
|
|
|
|
|
|
|
|
|
Receivables |
13.500 |
17.820 |
20.691 |
22.760 |
25.036 |
27.540 |
30.294 |
|
|
|
|
|
|
|
|
|
|
Other current assets |
2.025 |
2.673 |
3.104 |
3.414 |
3.755 |
4.131 |
4.544 |
|
|
|
|
|
|
|
|
|
|
Less
: Sundry Creditors |
|
|
|
|
|
|
|
|
Trade Creditors |
1.013 |
1.276 |
1.420 |
1.502 |
1.589 |
1.683 |
1.704 |
|
|
|
|
|
|
|
|
|
|
Others taxes, expenses etc. |
0.134 |
0.167 |
0.185 |
0.195 |
0.205 |
0.216 |
0.217 |
|
|
1.147 |
1.444 |
1.605 |
1.696 |
1.794 |
1.899 |
1.921 |
|
|
|
|
|
|
|
|
|
|
Net
current assets |
14.378 |
19.049 |
22.190 |
24.477 |
26.997 |
29.771 |
32.917 |
|
|
|
|
|
|
|
|
|
|
Cash and Bank balances |
8.256 |
4.749 |
5.707 |
14.854 |
25.953 |
39.212 |
55.520 |
|
|
|
|
|
|
|
|
|
|
Deferred Tax Assets |
0.000 |
0.000 |
0.000 |
0.000 |
0.000 |
0.000 |
0.000 |
|
|
|
|
|
|
|
|
|
|
Preliminary Expenses (to the ext. not
W/off |
0.000 |
0.000 |
0.000 |
0.000 |
0.000 |
0.000 |
0.000 |
|
|
|
|
|
|
|
|
|
|
TOTAL |
77.757 |
71.011 |
68.762 |
75.040 |
84.419 |
96.925 |
113.415 |
------------------------------------------------------------------------------------------------------------------------------
PROJECTIONS OF PERFORMANCE,
PROFITABILITY AND REPAYMENT
(RS. IN MILLIONS)
|
Sr. No. |
PARTICULARS |
2015 |
2016 |
2017 |
2018 |
2019 |
2020 |
2021 |
|
1 |
Installed Capacity |
0.500 |
0.500 |
0.500 |
0.500 |
0.500 |
0.500 |
0.500 |
|
|
|
|
|
|
|
|
|
|
|
2 |
No of Days |
365 |
365 |
365 |
365 |
365 |
365 |
365 |
|
|
|
|
|
|
|
|
|
|
|
3 |
No. of shifts |
1 |
1 |
1 |
1 |
1 |
1 |
1 |
|
|
|
|
|
|
|
|
|
|
|
4 |
% utilisation of installed capacity |
75% |
90% |
95% |
95% |
95% |
95% |
95% |
|
|
|
|
|
|
|
|
|
|
|
5 |
Production |
137 |
164 |
173 |
173 |
173 |
173 |
173 |
|
|
|
|
|
|
|
|
|
|
|
9) |
SALES |
137 |
164 |
173 |
173 |
173 |
173 |
173 |
|
|
|
|
|
|
|
|
|
|
|
10) |
SALES &
OTHER INCOME |
20.531 |
27.101 |
31.468 |
34.614 |
38.076 |
41.883 |
46.072 |
|
|
|
|
|
|
|
|
|
|
|
11) |
Stock
adjustments |
0.000 |
0.000 |
0.000 |
0.000 |
0.000 |
0.000 |
0.000 |
|
|
|
|
|
|
|
|
|
|
|
12) |
NET SALES |
20.531 |
27.101 |
31.468 |
34.614 |
38.076 |
41.883 |
46.072 |
|
|
|
|
|
|
|
|
|
|
|
13) |
COST OF
PRODUCTION |
|
|
|
|
|
|
|
|
a) |
Raw materials consumed |
0.000 |
0.000 |
0.000 |
0.000 |
0.000 |
0.000 |
0.000 |
|
|
|
|
|
|
|
|
|
|
|
b) |
Stores & Spares |
0.000 |
0.000 |
0.000 |
0.000 |
0.000 |
0.000 |
0.000 |
|
|
|
|
|
|
|
|
|
|
|
c) |
Power |
4.314 |
5.177 |
5.465 |
5.465 |
5.465 |
5.465 |
5.465 |
|
|
|
|
|
|
|
|
|
|
|
d) |
Salaries & wages |
2.053 |
2.710 |
3.147 |
3.461 |
3.808 |
4.188 |
4.607 |
|
|
|
|
|
|
|
|
|
|
|
|
Transportation Exp. |
0.000 |
0.000 |
0.000 |
0.000 |
0.000 |
0.000 |
0.000 |
|
|
|
|
|
|
|
|
|
|
|
e) |
Repairs
& Maintenance |
|
|
|
|
|
|
|
|
|
Of Building |
0.108 |
0.216 |
0.324 |
0.432 |
0.540 |
0.648 |
0.756 |
|
|
Of Plant & Machinery |
0.204 |
0.266 |
0.329 |
0.391 |
0.454 |
0.517 |
0.000 |
|
|
Of others |
0.000 |
0.000 |
0.000 |
0.000 |
0.000 |
0.000 |
0.000 |
|
|
|
|
|
|
|
|
|
|
|
f) |
Mfg. Expenses |
0.000 |
0.000 |
0.000 |
0.000 |
0.000 |
0.000 |
0.000 |
|
|
|
|
|
|
|
|
|
|
|
14) |
COST OF
PRODUCTION |
6.679 |
8.369 |
9.264 |
9.750 |
10.266 |
10.818 |
10.828 |
|
|
|
|
|
|
|
|
|
|
|
g) |
Administrative Expenses |
0.719 |
0.949 |
1.101 |
1.211 |
1.333 |
1.466 |
1.613 |
|
|
|
|
|
|
|
|
|
|
|
h) |
Selling Expenses |
0.000 |
0.000 |
0.000 |
0.000 |
0.000 |
0.000 |
0.000 |
|
|
|
|
|
|
|
|
|
|
|
|
|
7.397 |
9.318 |
10.366 |
10.961 |
11.599 |
12.284 |
12.441 |
|
|
|
|
|
|
|
|
|
|
|
15) |
Gross profit |
13.134 |
17.783 |
21.102 |
23.653 |
26.477 |
29.599 |
33.631 |
|
|
|
|
|
|
|
|
|
|
|
j) |
Depreciation |
5.626 |
7.910 |
6.348 |
5.157 |
4.240 |
3.526 |
2.964 |
|
|
|
|
|
|
|
|
|
|
|
k) |
Misc. Exps. Written off |
0.000 |
0.000 |
0.000 |
0.000 |
0.000 |
0.000 |
0.000 |
|
|
|
|
|
|
|
|
|
|
|
16 |
INTEREST |
|
|
|
|
|
|
|
|
a) |
On Term Loan |
3.735 |
4.172 |
2.946 |
2.061 |
1.523 |
0.986 |
0.000 |
|
b) |
On working Capital |
0.442 |
0.575 |
0.575 |
0.575 |
0.575 |
0.575 |
0.575 |
|
|
|
|
|
|
|
|
|
|
|
17) |
SUB TOTAL |
4.177 |
4.747 |
3.521 |
2.636 |
2.098 |
1.561 |
0.575 |
|
|
|
|
|
|
|
|
|
|
|
18) |
Profit before
Tax |
3.331 |
5.126 |
11.233 |
15.860 |
20.139 |
24.513 |
30.092 |
|
|
|
|
|
|
|
|
|
|
|
19) |
Provision for taxes |
0.617 |
2.096 |
3.682 |
4.907 |
6.084 |
7.330 |
8.927 |
|
|
|
|
|
|
|
|
|
|
|
20) |
Net Profit |
2.713 |
3.030 |
7.551 |
10.953 |
14.054 |
17.182 |
21.165 |
|
|
|
|
|
|
|
|
|
|
|
21) |
Depreciation added back |
5.626 |
7.910 |
6.348 |
5.157 |
4.240 |
3.526 |
2.964 |
|
|
|
|
|
|
|
|
|
|
|
22) |
Misc. Exps. Written off |
0.000 |
0.000 |
0.000 |
0.000 |
0.000 |
0.000 |
0.000 |
|
|
|
|
|
|
|
|
|
|
|
23) |
Net Cash
Accruals |
8.339 |
10.940 |
13.899 |
16.110 |
18.294 |
20.708 |
24.129 |
|
|
|
|
|
|
|
|
|
|
|
24) |
Interest on term loan |
3.735 |
4.172 |
2.946 |
2.061 |
1.523 |
0.986 |
0.000 |
|
|
|
|
|
|
|
|
|
|
|
25) |
Cash available
for debt service |
12.074 |
15.112 |
16.845 |
18.171 |
19.817 |
21.694 |
24.129 |
|
|
|
|
|
|
|
|
|
|
|
26) |
Repayment
obligation |
|
|
|
|
|
|
|
|
|
Principal |
|
|
|
|
|
|
|
|
|
Term Loan |
5.490 |
9.775 |
9.800 |
4.675 |
4.675 |
4.675 |
4.675 |
|
|
Interest on term loan |
3.735 |
4.172 |
2.946 |
2.061 |
1.523 |
0.986 |
0.000 |
|
|
Total Repayment |
9.225 |
13.948 |
12.747 |
6.736 |
6.199 |
5.661 |
4.675 |
|
|
|
|
|
|
|
|
|
|
|
27) |
Debt service ratio |
1.31 |
1.08 |
1.32 |
2.70 |
3.20 |
3.83 |
0.00 |
|
|
|
|
|
|
|
|
|
|
|
28) |
Average D.S.C.R |
1.90 times |
||||||
|
|
Gross profit to
sales |
63.97% |
65.62% |
67.06% |
68.33% |
69.54% |
70.67% |
73.00% |
|
|
Operating profit
to sales |
16.22% |
18.91% |
35.70% |
45.82% |
52.89% |
58.53% |
65.32% |
|
|
Net profit to
sales |
13.22% |
11.18% |
24.00% |
31.64% |
36.91% |
41.02% |
45.94% |
|
|
Raw Material to
sales |
0.00% |
0.00% |
0.00% |
0.00% |
0.00% |
0.00% |
0.00% |
|
|
Interest to
sales |
20.35% |
17.52% |
11.19% |
7.62% |
5.51% |
3.73% |
1.25% |
------------------------------------------------------------------------------------------------------------------------------
ASSESMENT OF WORKING
CAPITAL REQUIREMENTS
OPERATING STATEMENT
(RS. IN MILLIONS)
|
Sr. No. |
PARTICULARS |
2015 |
2016 |
2017 |
2018 |
2019 |
2020 |
2021 |
|
|
|
Estimates |
Projection |
Projection |
Projection |
Projection |
Projection |
Projection |
|
1 |
Gross Sales |
|
|
|
|
|
|
|
|
(I) |
Domestic Sales |
20.531 |
27.101 |
31.468 |
34.614 |
38.076 |
41.883 |
46.072 |
|
(II) |
Export Sales |
0.000 |
0.000 |
0.000 |
0.000 |
0.000 |
0.000 |
0.000 |
|
(III) |
Other Income |
0.000 |
0.000 |
0.000 |
0.000 |
0.000 |
0.000 |
0.000 |
|
|
Total |
20.531 |
27.101 |
31.468 |
34.614 |
38.076 |
41.883 |
46.072 |
|
|
|
|
|
|
|
|
|
|
|
2 |
Less : Excise Duty |
0.000 |
0.000 |
0.000 |
0.000 |
0.000 |
0.000 |
0.000 |
|
|
|
|
|
|
|
|
|
|
|
3 |
NET SALES |
20.531 |
27.101 |
31.468 |
34.614 |
38.076 |
41.883 |
46.072 |
|
|
|
|
|
|
|
|
|
|
|
4 |
% age rise(+) or Fall(-)in net sales as compared to previous year. |
-- |
-- |
-- |
-- |
-- |
-- |
-- |
|
|
|
|
|
|
|
|
|
|
|
5 |
COST OF SALES |
|
|
|
|
|
|
|
|
I) |
Purchases |
0.000 |
0.000 |
0.000 |
0.000 |
0.000 |
0.000 |
0.000 |
|
|
|
|
|
|
|
|
|
|
|
II) |
Other Spares |
0.000 |
0.000 |
0.000 |
0.000 |
0.000 |
0.000 |
0.000 |
|
|
|
|
|
|
|
|
|
|
|
III) |
Electricity |
4.314 |
5.177 |
5.465 |
5.465 |
5.465 |
5.465 |
5.465 |
|
|
|
|
|
|
|
|
|
|
|
IV) |
Salaries |
2.053 |
2.710 |
3.147 |
3.461 |
3.808 |
4.188 |
4.607 |
|
|
|
|
|
|
|
|
|
|
|
V) |
Manufacturing Expenses |
0.000 |
0.000 |
0.000 |
0.000 |
0.000 |
0.000 |
0.000 |
|
|
|
|
|
|
|
|
|
|
|
VI) |
Repairs & Maintenance |
0.312 |
0.482 |
0.653 |
0.824 |
0.994 |
1.165 |
0.756 |
|
|
|
|
|
|
|
|
|
|
|
VII) |
Depreciation |
5.626 |
7.910 |
6.348 |
5.157 |
4.240 |
3.526 |
2.964 |
|
|
|
|
|
|
|
|
|
|
|
|
Sub-Total |
12.304 |
16.279 |
15.613 |
14.907 |
14.506 |
14.344 |
13.792 |
|
|
|
|
|
|
|
|
|
|
|
VIII) |
Add: Opening Stock In Process |
0.000 |
0.000 |
0.000 |
0.000 |
0.000 |
0.000 |
0.000 |
|
|
|
|
|
|
|
|
|
|
|
|
Sub-Total |
12.304 |
16.279 |
15.613 |
14.907 |
14.506 |
14.344 |
13.792 |
|
|
|
|
|
|
|
|
|
|
|
IX) |
Less: Closing Stock In Process |
0.000 |
0.000 |
0.000 |
0.000 |
0.000 |
0.000 |
0.000 |
|
|
|
|
|
|
|
|
|
|
|
X) |
Cost Of
Production |
12.304 |
16.279 |
15.613 |
14.907 |
14.506 |
14.344 |
13.792 |
|
|
|
|
|
|
|
|
|
|
|
XI) |
Add: Opening Stock in Finished Goods/Import License/Packing Mat. |
0.000 |
0.000 |
0.000 |
0.000 |
0.000 |
0.000 |
0.000 |
|
|
|
|
|
|
|
|
|
|
|
|
Sub-Total |
12.304 |
16.279 |
15.613 |
14.907 |
14.506 |
14.344 |
13.792 |
|
|
|
|
|
|
|
|
|
|
|
XII) |
Deduct: Closing Stock of Fin Goods/Import Packing/Packing Mat |
0.000 |
0.000 |
0.000 |
0.000 |
0.000 |
0.000 |
0.000 |
|
|
|
|
|
|
|
|
|
|
|
XIII) |
(Total Cost of Sales) |
12.304 |
16.279 |
15.613 |
14.907 |
14.506 |
14.344 |
13.792 |
|
|
|
|
|
|
|
|
|
|
|
6 |
Selling, General &
Administrative Exp. |
0.719 |
0.949 |
1.101 |
1.211 |
1.333 |
1.466 |
1.613 |
|
|
|
|
|
|
|
|
|
|
|
|
Sub-Totals (5+6) |
13.023 |
17.228 |
16.714 |
16.118 |
15.839 |
15.810 |
15.405 |
|
|
|
|
|
|
|
|
|
|
|
7 |
Operating Profit Before Interest (3-7) |
7.508 |
9.873 |
14.754 |
18.496 |
22.237 |
26.073 |
30.667 |
|
|
|
|
|
|
|
|
|
|
|
8 |
Interest - Term loan |
3.735 |
4.172 |
2.946 |
2.061 |
1.523 |
0.986 |
0.000 |
|
|
|
|
|
|
|
|
|
|
|
|
Interest - Working capital |
0.442 |
0.575 |
0.575 |
0.575 |
0.575 |
0.575 |
0.575 |
|
|
|
|
|
|
|
|
|
|
|
10 |
Operating Profit After Interest (8-9) |
3.331 |
5.126 |
11.233 |
15.860 |
20.139 |
24.513 |
30.092 |
|
|
|
|
|
|
|
|
|
|
|
11 |
I) Add: Other Non-operating Income |
|
|
|
|
|
|
|
|
|
(a) Interest on Loans & Adv. |
0.000 |
0.000 |
0.000 |
0.000 |
0.000 |
0.000 |
0.000 |
|
|
(b) Miscellaneous Income. |
0.000 |
0.000 |
0.000 |
0.000 |
0.000 |
0.000 |
0.000 |
|
|
(c) Profit on sale of fixed assets |
0.000 |
0.000 |
0.000 |
0.000 |
0.000 |
0.000 |
0.000 |
|
|
|
|
|
|
|
|
|
|
|
|
Sub Total (Income) |
0.000 |
0.000 |
0.000 |
0.000 |
0.000 |
0.000 |
0.000 |
|
|
|
|
|
|
|
|
|
|
|
|
II) Deduct: Other Non-operating expenses |
|
|
|
|
|
|
|
|
|
(a) Loss on sale of fixed assets. |
0.000 |
0.000 |
0.000 |
0.000 |
0.000 |
0.000 |
0.000 |
|
|
(b) Preliminary Exp. Written Off |
0.000 |
0.000 |
0.000 |
0.000 |
0.000 |
0.000 |
0.000 |
|
|
(c) Others -- Bad Debts |
0.000 |
0.000 |
0.000 |
0.000 |
0.000 |
0.000 |
0.000 |
|
|
|
|
|
|
|
|
|
|
|
|
Sub Total (Expenses) |
0.000 |
0.000 |
0.000 |
0.000 |
0.000 |
0.000 |
0.000 |
|
|
|
|
|
|
|
|
|
|
|
|
III) Net Of Other Non-operating Income /Expenses Net of 11(I) & 11(ii) |
0.000 |
0.000 |
0.000 |
0.000 |
0.000 |
0.000 |
0.000 |
|
|
|
|
|
|
|
|
|
|
|
12 |
Profit Before Tax/ Loss (10+11) |
3.331 |
5.126 |
11.233 |
15.860 |
20.139 |
24.513 |
30.092 |
|
|
|
|
|
|
|
|
|
|
|
13 |
Provision for Taxes @ 30% |
0.617 |
2.096 |
3.682 |
4.907 |
6.084 |
7.330 |
8.927 |
|
|
|
|
|
|
|
|
|
|
|
14 |
Net Profit / Loss (12-13) |
2.713 |
3.030 |
7.551 |
10.953 |
14.054 |
17.182 |
21.165 |
|
|
|
|
|
|
|
|
|
|
|
15 |
(a) I.T of previous year |
0.000 |
0.000 |
0.000 |
0.000 |
0.000 |
0.000 |
0.000 |
|
|
(b) Dividend Paid |
0.000 |
0.000 |
0.000 |
0.000 |
0.000 |
0.000 |
0.000 |
|
|
|
|
|
|
|
|
|
|
|
16 |
Retained Profit (14-15) |
2.713 |
3.030 |
7.551 |
10.953 |
14.054 |
17.182 |
21.165 |
|
|
|
|
|
|
|
|
|
|
|
17 |
CASH ACCRUALS |
8.339 |
10.940 |
13.899 |
16.110 |
18.294 |
20.708 |
24.129 |
|
|
|
|
|
|
|
|
|
|
|
18 |
Retained Profit/Net Profit (%age) |
|
|
|
|
|
|
|
|
|
Gross Profit To Sales |
36.57% |
36.43% |
46.89% |
53.43% |
58.40% |
62.25% |
66.56% |
|
|
Operating Profit to Sales |
16.22% |
0.00% |
35.70% |
45.82% |
52.89% |
58.53% |
65.32% |
|
|
Net Profit to Sales |
0.00% |
0.00% |
24.00% |
31.64% |
36.91% |
41.02% |
45.94% |
------------------------------------------------------------------------------------------------------------------------------
ANALYSIS
OF BALANCE SHEET
(RS. IN MILLIONS)
|
Sr. No. |
PARTICULARS |
2015 |
2016 |
2017 |
2018 |
2019 |
2020 |
2021 |
|
|
|
Estimates |
Projection |
Projection |
Projection |
Projection |
Projection |
Projection |
|
|
CURRENT
LIABILITIES |
|
|
|
|
|
|
|
|
1 |
Short-term Borrowings from Banks
(Including Bills Purchased/Discounted and excess Borrowings Places on
Repayment Basis) |
|
|
|
|
|
|
|
|
|
(I) From Application Bank |
5.000 |
5.000 |
5.000 |
5.000 |
5.000 |
5.000 |
5.000 |
|
|
(ii) From Other Banks |
0.000 |
0.000 |
0.000 |
0.000 |
0.000 |
0.000 |
0.000 |
|
|
(iii) (Of Which BP and BD) |
0.000 |
0.000 |
0.000 |
0.000 |
0.000 |
0.000 |
0.000 |
|
|
Sub-Total (A) |
5.000 |
5.000 |
5.000 |
5.000 |
5.000 |
5.000 |
5.000 |
|
|
|
|
|
|
|
|
|
|
|
2 |
Short term Borrowings From Others |
0.000 |
0.000 |
0.000 |
0.000 |
0.000 |
0.000 |
0.000 |
|
|
|
|
|
|
|
|
|
|
|
3 |
Sundry Creditors (trade) |
1.013 |
1.276 |
1.420 |
1.502 |
1.589 |
1.683 |
1.704 |
|
|
|
|
|
|
|
|
|
|
|
4 |
Advance Payments From Customers |
0.000 |
0.000 |
0.000 |
0.000 |
0.000 |
0.000 |
0.000 |
|
|
|
|
|
|
|
|
|
|
|
5 |
Provision For Taxation |
0.000 |
0.000 |
0.000 |
0.000 |
0.000 |
0.000 |
0.000 |
|
|
|
|
|
|
|
|
|
|
|
6 |
Dividend Payable |
0.000 |
0.000 |
0.000 |
0.000 |
0.000 |
0.000 |
0.000 |
|
|
|
|
|
|
|
|
|
|
|
7 |
Other Statutory Liabilities (Due Within 1
Year) |
0.000 |
0.000 |
0.000 |
0.000 |
0.000 |
0.000 |
0.000 |
|
|
|
|
|
|
|
|
|
|
|
8 |
Deposits/Installments of Term Loans/
DPGs/Debentures etc. (Due Within 1 year) |
9.775 |
9.800 |
4.675 |
4.675 |
4.675 |
4.675 |
0.000 |
|
|
|
|
|
|
|
|
|
|
|
9 |
Other Current Liabilities and Provisions
(Due Within One Year) |
0.134 |
0.167 |
0.185 |
0.195 |
0.205 |
0.216 |
0.217 |
|
|
|
|
|
|
|
|
|
|
|
|
Deferred tax Liabilities |
0.000 |
0.000 |
0.000 |
0.000 |
0.000 |
0.000 |
0.000 |
|
|
|
|
|
|
|
|
|
|
|
|
Sub-Total (B) |
10.922 |
11.244 |
6.281 |
6.372 |
6.470 |
6.574 |
1.921 |
|
|
|
|
|
|
|
|
|
|
|
10 |
TOTAL CURRENT
LIABILITIES (Total of 1 to 9) |
15.922 |
16.244 |
11.281 |
11.372 |
11.470 |
11.574 |
6.921 |
|
|
|
|
|
|
|
|
|
|
|
|
TERM LIABILITIES |
|
|
|
|
|
|
|
|
11 |
Debenture (Not Maturing Within 1 year) |
0.000 |
0.000 |
0.000 |
0.000 |
0.000 |
0.000 |
0.000 |
|
|
|
|
|
|
|
|
|
|
|
12 |
Preference Shares (Redeemable After 1
year) |
0.000 |
0.000 |
0.000 |
0.000 |
0.000 |
0.000 |
0.000 |
|
|
|
|
|
|
|
|
|
|
|
13 |
Term Loans (Excluding Installments Payable
Within One Year) |
30.060 |
20.260 |
15.584 |
10.909 |
6.234 |
1.558 |
1.169 |
|
|
|
|
|
|
|
|
|
|
|
14 |
Outstanding Payment for capital goods |
0.000 |
0.000 |
0.000 |
0.000 |
0.000 |
0.000 |
0.000 |
|
|
|
|
|
|
|
|
|
|
|
15 |
Term Deposits (Repayable After 1 year) |
0.000 |
0.000 |
0.000 |
0.000 |
0.000 |
0.000 |
0.000 |
|
|
|
|
|
|
|
|
|
|
|
16 |
Other Term Liabilities (Unsecured loan) |
0.000 |
0.000 |
0.000 |
0.000 |
0.000 |
0.000 |
0.000 |
|
|
|
|
|
|
|
|
|
|
|
17 |
TOTAL TERM
LIABILITIES (Total of 11 to
16) |
30.060 |
20.260 |
15.584 |
10.909 |
6.234 |
1.558 |
1.169 |
|
|
|
|
|
|
|
|
|
|
|
18 |
TOTAL OUTSIDE
LIABILITIES (10+17) |
45.982 |
36.504 |
26.865 |
22.281 |
17.703 |
13.133 |
8.090 |
|
|
|
|
|
|
|
|
|
|
|
|
NET WORTH |
|
|
|
|
|
|
|
|
19 |
Share Capital |
10.000 |
10.000 |
10.000 |
10.000 |
10.000 |
10.000 |
10.000 |
|
|
|
|
|
|
|
|
|
|
|
20 |
Reserves and Surplus |
1.016 |
4.046 |
11.597 |
22.550 |
36.604 |
53.787 |
74.952 |
|
|
|
|
|
|
|
|
|
|
|
21 |
Revaluation reserves |
0.000 |
0.000 |
0.000 |
0.000 |
0.000 |
0.000 |
0.000 |
|
|
|
|
|
|
|
|
|
|
|
22 |
Other reserves-Share Premium/Investment
Reserve |
0.000 |
0.000 |
0.000 |
0.000 |
0.000 |
0.000 |
0.000 |
|
|
|
|
|
|
|
|
|
|
|
23 |
Surplus (+) or deficits (-) in P and L
account |
0.000 |
0.000 |
0.000 |
0.000 |
0.000 |
0.000 |
0.000 |
|
|
Unsecured Loans ( Quashi Capital) |
21.905 |
21.905 |
21.905 |
21.905 |
21.905 |
21.905 |
21.905 |
|
|
|
|
|
|
|
|
|
|
|
24 |
NET WORTH |
32.921 |
35.951 |
43.502 |
54.455 |
68.509 |
85.692 |
106.857 |
|
|
|
|
|
|
|
|
|
|
|
25 |
TOTAL
LIABILITIES (18+24) |
78.904 |
72.455 |
70.367 |
76.736 |
86.213 |
98.824 |
114.946 |
|
|
|
|
|
|
|
|
|
|
|
|
CURRENT ASSETS |
|
|
|
|
|
|
|
|
26 |
Cash and Bank Balance |
8.256 |
4.749 |
5.707 |
14.854 |
25.953 |
39.212 |
55.520 |
|
|
|
|
|
|
|
|
|
|
|
27 |
Investments (Other Than Trustee
securities) |
|
|
|
|
|
|
|
|
I) |
Government and Other Trustee Securities/
Other Deposits |
0.000 |
0.000 |
0.000 |
0.000 |
0.000 |
0.000 |
0.000 |
|
II) |
Cash margin against L/C |
0.000 |
0.000 |
0.000 |
0.000 |
0.000 |
0.000 |
0.000 |
|
|
|
|
|
|
|
|
|
|
|
28 |
Receivable Other Than Deferred and Exports |
|
|
|
|
|
|
|
|
I) |
(Include Bills Purchased and Discounted By
Banks) |
13.500 |
17.820 |
20.691 |
22.760 |
25.036 |
27.540 |
30.294 |
|
II) |
Exports Receivable (Including Bills Purchased/
Discounted by Banks) |
0.000 |
0.000 |
0.000 |
0.000 |
0.000 |
0.000 |
0.000 |
|
|
|
|
|
|
|
|
|
|
|
29 |
Excise/ Export/ Modvat receivables (Due
Within One Year) |
0.000 |
0.000 |
0.000 |
0.000 |
0.000 |
0.000 |
0.000 |
|
|
|
|
|
|
|
|
|
|
|
30 |
Inventory |
|
|
|
|
|
|
|
|
|
I) Stock in Trade |
|
|
|
|
|
|
|
|
|
a) Stock Of Raw Materials |
|
|
|
|
|
|
|
|
|
-- Imported |
0.000 |
0.000 |
0.000 |
0.000 |
0.000 |
0.000 |
0.000 |
|
|
-- Indigenous |
0.000 |
0.000 |
0.000 |
0.000 |
0.000 |
0.000 |
0.000 |
|
|
b)
Stock In Process |
0.000 |
0.000 |
0.000 |
0.000 |
0.000 |
0.000 |
0.000 |
|
|
c)
Stock Of Finished Goods |
0.000 |
0.000 |
0.000 |
0.000 |
0.000 |
0.000 |
0.000 |
|
|
|
|
|
|
|
|
|
|
|
31 |
Advances To Suppliers of Goods |
0.000 |
0.000 |
0.000 |
0.000 |
0.000 |
0.000 |
0.000 |
|
|
|
|
|
|
|
|
|
|
|
32 |
Advances Payment of Taxes |
0.000 |
0.000 |
0.000 |
0.000 |
0.000 |
0.000 |
0.000 |
|
|
|
|
|
|
|
|
|
|
|
33 |
Other Current Assets |
2.025 |
2.673 |
3.104 |
3.414 |
3.755 |
4.131 |
4.544 |
|
|
|
|
|
|
|
|
|
|
|
34 |
TOTAL CURRENT
ASSETS (Total of 26 to
33) |
23.780 |
25.242 |
29.502 |
41.028 |
54.745 |
70.882 |
90.358 |
|
|
|
|
|
|
|
|
|
|
|
|
FIXED ASSETS |
|
|
|
|
|
|
|
|
35 |
Gross Block (Land, Build, Mach, and W.I.P) |
76.746 |
76.746 |
76.746 |
76.746 |
76.746 |
76.746 |
76.746 |
|
|
|
|
|
|
|
|
|
|
|
36 |
Depreciation To Date |
21.623 |
29.533 |
35.881 |
41.038 |
45.278 |
48.804 |
51.768 |
|
|
|
|
|
|
|
|
|
|
|
37 |
Net Blocks
(35-36) |
55.123 |
47.213 |
40.865 |
35.708 |
31.468 |
27.942 |
24.978 |
|
|
|
|
|
|
|
|
|
|
|
|
OTHER NON
CURRENT ASSETS |
|
|
|
|
|
|
|
|
|
|
|
|
|
|
|
|
|
|
38 |
Investments/Book Debts/Advances/ Deposits
Which Are Non-Current Assets |
|
|
|
|
|
|
|
|
|
|
|
|
|
|
|
|
|
|
I) |
(a)
Investments in Subsidiary Comp./Affiliates |
0.000 |
0.000 |
0.000 |
0.000 |
0.000 |
0.000 |
0.000 |
|
|
(b)
Others |
0.000 |
0.000 |
0.000 |
0.000 |
0.000 |
0.000 |
0.000 |
|
|
|
|
|
|
|
|
|
|
|
II) |
Adv.
to Suppliers Of Capital Goods and Contractors |
0.000 |
0.000 |
0.000 |
0.000 |
0.000 |
0.000 |
0.000 |
|
|
|
|
|
|
|
|
|
|
|
III) |
Deferred Assets (Maturity Exceeding six
month) |
0.000 |
0.000 |
0.000 |
0.000 |
0.000 |
0.000 |
0.000 |
|
|
|
|
|
|
|
|
|
|
|
39 |
Non Consumables Stores and Spares |
0.000 |
0.000 |
0.000 |
0.000 |
0.000 |
0.000 |
0.000 |
|
|
|
|
|
|
|
|
|
|
|
40 |
Other Non-Current Assets Including |
0.000 |
0.000 |
0.000 |
0.000 |
0.000 |
0.000 |
0.000 |
|
|
|
|
|
|
|
|
|
|
|
41 |
TOTAL OTHER NON
CURRENT ASSETS |
0.000 |
0.000 |
0.000 |
0.000 |
0.000 |
0.000 |
0.000 |
|
|
Dr. Balance of P&L account |
0.000 |
0.000 |
0.000 |
0.000 |
0.000 |
0.000 |
0.000 |
|
|
|
|
|
|
|
|
|
|
|
42 |
Intangible Assets (Patents, Goodwill Pre.
Exps. Bad/Doubtful debts not provided for, etc. |
0.000 |
0.000 |
0.000 |
0.000 |
0.000 |
0.000 |
0.000 |
|
|
|
|
|
|
|
|
|
|
|
43 |
TOTAL ASSETS (Total of
34,37,41 and 42) |
78.904 |
72.455 |
70.367 |
76.736 |
86.213 |
98.824 |
115.336 |
|
|
|
|
|
|
|
|
|
|
|
44 |
TANGIBLE NET WORTH (24-42) |
32.921 |
35.951 |
43.502 |
54.455 |
68.509 |
85.692 |
106.857 |
|
|
|
|
|
|
|
|
|
|
|
45 |
NET WORKING CAPITAL (17+24) |
0.000 |
0.000 |
0.000 |
0.000 |
0.000 |
0.000 |
0.389 |
|
|
(37+41+42) To tally with (34-10) |
7.858 |
8.997 |
18.221 |
29.656 |
43.275 |
59.308 |
83.437 |
|
|
|
|
|
|
|
|
|
|
|
46 |
Current
Ratio (Item 34/10) |
1.49 |
1.55 |
2.62 |
3.61 |
4.77 |
6.12 |
13.06 |
|
|
|
|
|
|
|
|
|
|
|
47 |
Total
Outside Liabilities /Tangible (Net Worth 18/44) |
1.40 |
1.02 |
0.62 |
0.41 |
0.26 |
0.15 |
0.08 |
------------------------------------------------------------------------------------------------------------------------------
FUND
FLOW STATEMENT
(RS. IN MILLIONS)
|
Sr. No. |
PARTICULARS |
2015 |
2016 |
2017 |
2018 |
2019 |
2020 |
2021 |
|
|
|
Estimates |
Projection |
Projection |
Projection |
Projection |
Projection |
Projection |
|
1 |
SOURCES |
|
|
|
|
|
|
|
|
a) |
Net Profit After Tax |
2.713 |
3.030 |
7.551 |
10.953 |
14.054 |
17.182 |
21.165 |
|
|
|
|
|
|
|
|
|
|
|
b) |
Depreciation |
5.626 |
7.910 |
6.348 |
5.157 |
4.240 |
3.526 |
2.964 |
|
|
|
|
|
|
|
|
|
|
|
c) |
Increase in capital |
4.000 |
0.000 |
0.000 |
0.000 |
0.000 |
0.000 |
0.000 |
|
|
|
|
|
|
|
|
|
|
|
d) |
Increase in Term Liabilities (Incl. Public
Deposit) |
30.060 |
0.000 |
0.000 |
0.000 |
0.000 |
0.000 |
0.000 |
|
|
|
|
|
|
|
|
|
|
|
e) |
I) Decrease in Fixed assets |
0.000 |
0.000 |
0.000 |
0.000 |
0.000 |
0.000 |
0.000 |
|
|
II) Other Non-Current assets |
0.000 |
0.000 |
0.000 |
0.000 |
0.000 |
0.000 |
0.000 |
|
|
|
|
|
|
|
|
|
|
|
f) |
P & P write off |
0.000 |
0.000 |
0.000 |
0.000 |
0.000 |
0.000 |
0.000 |
|
|
|
|
|
|
|
|
|
|
|
g) |
TOTAL |
42.399 |
10.940 |
13.899 |
16.110 |
18.294 |
20.708 |
24.129 |
|
|
|
|
|
|
|
|
|
|
|
2 |
USES |
|
|
|
|
|
|
|
|
a) |
Net Loss |
0.000 |
0.000 |
0.000 |
0.000 |
0.000 |
0.000 |
0.000 |
|
|
|
|
|
|
|
|
|
|
|
b) |
Decrease in Term Liabilities (Incl. Public
Deposits) |
0.000 |
9.800 |
4.675 |
4.675 |
4.675 |
4.675 |
0.389 |
|
|
|
|
|
|
|
|
|
|
|
c) |
I) Increase in : Fixed assets |
41.250 |
0.000 |
0.000 |
0.000 |
0.000 |
0.000 |
0.000 |
|
|
ii) Other non-Current Assets |
0.000 |
0.000 |
0.000 |
0.000 |
0.000 |
0.000 |
0.000 |
|
|
|
|
|
|
|
|
|
|
|
d) |
Misc. Expense |
0.000 |
0.000 |
0.000 |
0.000 |
0.000 |
0.000 |
0.000 |
|
|
|
|
|
|
|
|
|
|
|
f) |
TOTAL |
41.250 |
9.800 |
4.675 |
4.675 |
4.675 |
4.675 |
0.389 |
|
|
|
|
|
|
|
|
|
|
|
3 |
Long Term Surplus(=)Deficit(-)1-2 |
1.149 |
1.139 |
9.224 |
11.435 |
13.619 |
16.033 |
23.740 |
|
|
|
|
|
|
|
|
|
|
|
4 |
Increase/Decrease in Current Assets |
11.838 |
1.461 |
4.260 |
11.526 |
13.717 |
16.138 |
19.476 |
|
|
(As per details given Below) |
|
|
|
|
|
|
|
|
|
|
|
|
|
|
|
|
|
|
5 |
Increase/Decrease in Current Liabilities
other than Bank Borrowing |
0.000 |
9.800 |
4.675 |
4.675 |
4.675 |
4.675 |
0.389 |
|
|
|
|
|
|
|
|
|
|
|
6 |
Increase/Decrease in working Capital Gap |
1.674 |
1.139 |
9.224 |
11.435 |
13.619 |
16.033 |
24.129 |
|
|
|
|
|
|
|
|
|
|
|
7 |
Net Surplus(=) Deficit(-) (Difference of 3
& 6) |
(0.525) |
0.000 |
0.000 |
0.000 |
0.000 |
0.000 |
(0.389) |
|
|
|
|
|
|
|
|
|
|
|
8 |
Increase/Decrease in Bank Borrowing |
4.600 |
0.000 |
0.000 |
0.000 |
0.000 |
0.000 |
0.000 |
|
|
|
|
|
|
|
|
|
|
|
|
INCREASE/DECREASE IN NET SALES |
20.531 |
6.570 |
4.367 |
3.146 |
3.462 |
3.807 |
4.189 |
|
|
Break up of (4) |
|
|
|
|
|
|
|
|
|
|
|
|
|
|
|
|
|
|
I) |
Increase/Decrease in Finished Goods |
0.000 |
0.000 |
0.000 |
0.000 |
0.000 |
0.000 |
0.000 |
|
|
|
|
|
|
|
|
|
|
|
ii) |
Increase/Decrease in Receivable |
|
|
|
|
|
|
|
|
a) |
Domestic |
8.877 |
4.320 |
2.871 |
2.069 |
2.276 |
2.503 |
2.754 |
|
b) |
Export |
0.000 |
0.000 |
0.000 |
0.000 |
0.000 |
0.000 |
0.000 |
|
|
|
|
|
|
|
|
|
|
|
iii) |
Increase/Decrease in Stores & spares |
0.000 |
0.000 |
0.000 |
0.000 |
0.000 |
0.000 |
0.000 |
|
|
|
|
|
|
|
|
|
|
|
iv) |
Increase/Decrease in other Current Assets |
2.962 |
(2.859) |
1.389 |
9.458 |
11.440 |
13.634 |
16.721 |
|
|
|
|
|
|
|
|
|
|
|
|
TOTAL |
11.838 |
1.461 |
4.260 |
11.526 |
13.717 |
16.138 |
19.476 |
------------------------------------------------------------------------------------------------------------------------------
COMPARATIVE
STATEMENT OF CURRENT ASSETS & CURRENT LIABILITIES
(RS. IN MILLIONS)
|
Sr. No. |
PARTICULARS |
2015 |
2016 |
2017 |
2018 |
2019 |
2020 |
2021 |
|
|
|
Estimates |
Projection |
Projection |
Projection |
Projection |
Projection |
Projection |
|
|
A: CURRENT ASSETS |
|
|
|
|
|
|
|
|
1 |
Stock Of Raw Materials - indigenous |
0.000 |
0.000 |
0.000 |
0.000 |
0.000 |
0.000 |
0.000 |
|
|
(Months' cost of Purchases) |
-- |
-- |
-- |
-- |
-- |
-- |
-- |
|
|
|
|
|
|
|
|
|
|
|
|
Stock Of Raw Materials -
Imported |
0.000 |
0.000 |
0.000 |
0.000 |
0.000 |
0.000 |
0.000 |
|
|
(Months' cost of Purchases) |
-- |
-- |
-- |
-- |
-- |
-- |
-- |
|
|
|
|
|
|
|
|
|
|
|
|
Stock in Process |
0.000 |
0.000 |
0.000 |
0.000 |
0.000 |
0.000 |
0.000 |
|
|
(Months' cost of production) |
-- |
-- |
-- |
-- |
-- |
-- |
-- |
|
|
|
|
|
|
|
|
|
|
|
|
Stock Of Finished Goods |
0.000 |
0.000 |
0.000 |
0.000 |
0.000 |
0.000 |
0.000 |
|
|
(Months' cost of sales) |
-- |
-- |
-- |
-- |
-- |
-- |
-- |
|
|
|
|
|
|
|
|
|
|
|
2 |
Receivables other Than Export Deferred Receivables Including Bills
Purchase & Discounted By Banks |
13.500 |
17.820 |
20.691 |
22.760 |
25.036 |
27.540 |
30.294 |
|
|
(Days' Domestic Sales: Excluding Deferred Payment) |
-- |
-- |
-- |
-- |
-- |
-- |
-- |
|
|
|
|
|
|
|
|
|
|
|
3 |
Export Receivables (Including Bills Purchase & Dis.) |
0.000 |
0.000 |
0.000 |
0.000 |
0.000 |
0.000 |
0.000 |
|
|
(Month Export Sales) |
-- |
-- |
-- |
-- |
-- |
-- |
-- |
|
|
|
|
|
|
|
|
|
|
|
4 |
Advance to the Suppliers of R. Mat. & Stores, Con. |
0.000 |
0.000 |
0.000 |
0.000 |
0.000 |
0.000 |
0.000 |
|
|
|
|
|
|
|
|
|
|
|
5 |
Other C. Assets Included Cash & Bank Bl., Def. Rec. Due Within one
Year (Specify Major items) |
10.281 |
7.422 |
8.811 |
18.268 |
29.708 |
43.343 |
60.064 |
|
|
Margin money for W.C |
0.000 |
0.000 |
0.000 |
0.000 |
0.000 |
0.000 |
0.000 |
|
|
|
|
|
|
|
|
|
|
|
6 |
TOTAL CURRENT
ASSETS |
23.780 |
25.242 |
29.502 |
41.028 |
54.745 |
70.882 |
90.358 |
|
|
(to Agree with
item 34 in Form-III) |
|
|
|
|
|
|
|
|
|
|
|
|
|
|
|
|
|
|
B |
CURRENT LIABILITIES |
|
|
|
|
|
|
|
|
|
(Other Than Bank Borrowings For W.C) |
|
|
|
|
|
|
|
|
|
|
|
|
|
|
|
|
|
|
7 |
Sundry creditors(Trade) |
1.013 |
1.276 |
1.420 |
1.502 |
1.589 |
1.683 |
1.704 |
|
|
(Months Purchases) |
-- |
-- |
-- |
-- |
-- |
-- |
-- |
|
|
|
|
|
|
|
|
|
|
|
8 |
Advances From Customers |
0.000 |
0.000 |
0.000 |
0.000 |
0.000 |
0.000 |
0.000 |
|
|
|
|
|
|
|
|
|
|
|
9 |
Statutory Liabilities |
0.000 |
0.000 |
0.000 |
0.000 |
0.000 |
0.000 |
0.000 |
|
|
|
|
|
|
|
|
|
|
|
10 |
Other Current Liabilities |
-- |
-- |
-- |
-- |
-- |
-- |
-- |
|
|
(Specify Major Items) |
|
|
|
|
|
|
|
|
I) |
Short Term Borrowings |
0.000 |
0.000 |
0.000 |
0.000 |
0.000 |
0.000 |
0.000 |
|
|
|
|
|
|
|
|
|
|
|
II) |
Unsecured Loans |
0.000 |
0.000 |
0.000 |
0.000 |
0.000 |
0.000 |
0.000 |
|
|
|
|
|
|
|
|
|
|
|
III) |
Dividend Payables |
0.000 |
0.000 |
0.000 |
0.000 |
0.000 |
0.000 |
0.000 |
|
|
|
|
|
|
|
|
|
|
|
IV) |
Installments of Term Loans, DPG Public Deposits, debentures etc. |
9.775 |
9.800 |
4.675 |
4.675 |
4.675 |
4.675 |
0.000 |
|
|
|
|
|
|
|
|
|
|
|
V) |
Others |
0.134 |
0.167 |
0.185 |
0.195 |
0.205 |
0.216 |
0.217 |
|
|
|
|
|
|
|
|
|
|
|
11 |
TOTAL CURRENT
LIABILITIES |
10.922 |
11.244 |
6.281 |
6.372 |
6.470 |
6.574 |
1.921 |
|
|
(to Agree with
Sub Total B-Form-III) |
|
|
|
|
|
|
|
------------------------------------------------------------------------------------------------------------------------------
COMPUTATION
OF MAXIMUM PERMISSIBLE BANK FINANCE FOR WORKING CAPITAL
(RS. IN MILLIONS)
|
Sr. No. |
PARTICULARS |
2015 |
2016 |
2017 |
2018 |
2019 |
2020 |
2021 |
|
|
|
Estimates |
Projection |
Projection |
Projection |
Projection |
Projection |
Projection |
|
1 |
Total Current Assets (9 in Form - IV) |
23.780 |
25.242 |
29.502 |
41.028 |
54.745 |
70.882 |
90.358 |
|
|
|
|
|
|
|
|
|
|
|
2 |
Other Current Liabilities (Other than Bank
Borrowings) |
10.922 |
11.244 |
6.281 |
6.372 |
6.470 |
6.574 |
1.921 |
|
|
(14 of Form-IV) |
|
|
|
|
|
|
|
|
|
|
|
|
|
|
|
|
|
|
3 |
Working Capital Gap (WCG) (1-2) |
12.858 |
13.997 |
23.221 |
34.656 |
48.275 |
64.308 |
88.437 |
|
|
|
|
|
|
|
|
|
|
|
4 |
Minimum Stipulated Net WORKING |
3.215 |
6.310 |
7.375 |
10.257 |
13.686 |
17.721 |
22.589 |
|
|
|
|
|
|
|
|
|
|
|
|
Capital i.e. 25% of W.C.G OR 25% OF Total
Current Assets AS The Method of Lending Being Applied (Export Rec. to be
excluded under Both Methods) |
5.945 |
6.310 |
7.375 |
10.257 |
13.686 |
17.721 |
22.589 |
|
|
|
|
|
|
|
|
|
|
|
5 |
Actual Project Net Working capital (45 in
Form III) |
7.858 |
8.997 |
18.221 |
29.656 |
43.275 |
59.308 |
83.437 |
|
|
|
|
|
|
|
|
|
|
|
6 |
Item 3 Minus Items4 |
6.913 |
7.687 |
15.846 |
24.399 |
34.589 |
46.587 |
65.848 |
|
|
|
|
|
|
|
|
|
|
|
7 |
Item 3 Minus Items5 |
5.000 |
5.000 |
5.000 |
5.000 |
5.000 |
5.000 |
5.000 |
|
|
|
|
|
|
|
|
|
|
|
8 |
Maximum Permissible Bank Finance (Item 6
or 7 Whichever is Lower) |
5.000 |
5.000 |
5.000 |
5.000 |
5.000 |
5.000 |
5.000 |
|
|
|
|
|
|
|
|
|
|
|
9 |
Excess Borrowings Rep. Short fall in net
W.C. (4-5) |
-- |
-- |
-- |
-- |
-- |
-- |
-- |
------------------------------------------------------------------------------------------------------------------------------
STATEMENT
OF MEANS
MR.
DHANSUKHBHAI DAHYABHAI PATEL
(RS. IN MILLIONS)
DETAILS OF ASSETS
OWNED
|
SR. NO. |
FULL DESCRIPTION
OF PROPERTY GIVING LOCATION AND FULL ADDRESS |
PURCHASE PRICE |
PRESENT MARKET
PRICE |
|
1. |
3, Geeta Society, Ahmedabad Road, Dehgam –
382305, Gujarat, India |
0.150 |
6.500 |
|
|
|
|
|
|
2. |
Shop: Station Road, Dehgam, Gujarat, India |
0.300 |
1.500 |
|
|
|
|
|
|
|
TOTAL |
|
8.000 |
DETAILS
OF INVESTMENTS, IF ANY: NIL
INVESTMENT
BY WAY OF CAPITAL IN ASSOCIATES FIRM/ COMPANY
|
SR. NO. |
NAME OF THE FIRM/ COMPANY |
AMOUNT OF NET CAPITAL INVESTED AS ON DATE [AFTER
SETTING OF LOSSES, IF ANY] |
|
|
|
|
|
1. |
Ambica
Fertilizers [Proprietor] |
Rs. 2.500
Millions As on 31.03.2013 |
LOANS/DEPOSITS
WITH THIRD PARTIES/ FIRMS: NIL
DEPOSIT
WITH BANKS: NIL
DETAILS
OF BORROWINGS: NIL
DETAILS
OF PERSONAL GUARANTEES GIVEN, IF ANY: NIL
------------------------------------------------------------------------------------------------------------------------------
STATEMENT
OF MEANS
MR.
GOVINDBHAI VALJIBHAI PATEL
(RS. IN MILLIONS)
DETAILS OF ASSETS
OWNED
|
SR. NO. |
FULL DESCRIPTION
OF PROPERTY GIVING LOCATION AND FULL ADDRESS |
PURCHASE PRICE |
PRESENT MARKET
PRICE |
|
1. |
Flat: 15, Abhishek Appartment, B/H Atithi
Hotel, Ahmedabad Road, Dehgam – 382305, Gujarat, India |
0.500 |
1.500 |
|
|
|
|
|
|
2. |
Shop: At Sudama Complex, Modasa Road, Dehgam |
0.300 |
1.100 |
|
|
|
|
|
|
3. |
Land at Kapadvanj |
2.000 |
6.500 |
|
|
|
|
|
|
|
TOTAL |
|
9.100 |
DETAILS
OF INVESTMENTS, IF ANY: NIL
DETAILS
OF PERSONAL GUARANTEES GIVEN, IF ANY: NIL
------------------------------------------------------------------------------------------------------------------------------
STATEMENT
OF MEANS
MR.
MANISHBHAI ASHOKBHAI SHAH
(RS. IN MILLIONS)
DETAILS OF ASSETS
OWNED
|
SR. NO. |
FULL DESCRIPTION
OF PROPERTY GIVING LOCATION AND FULL ADDRESS |
PURCHASE PRICE |
PRESENT MARKET
PRICE |
|
1. |
13, Jai Ambe Society, Near GEB, Ahmedabad
Road, Dehgam – 382305, Gujarat, India |
0.500 |
5.000 |
|
|
|
|
|
|
2. |
Shop at Ahmedabad |
0.500 |
4.000 |
|
|
|
|
|
|
3. |
Land at Dharisna |
0.500 |
4.500 |
|
|
|
|
|
|
|
TOTAL |
|
13.500 |
DETAILS
OF INVESTMENTS, IF ANY: NIL
INVESTMENT
BY WAY OF CAPITAL IN ASSOCIATES FIRM/ COMPANY: NIL
LOANS/DEPOSITS
WITH THIRD PARTIES/ FIRMS: NIL
DEPOSIT
WITH BANKS: NIL
DETAILS
OF BORROWINGS: NIL
DETAILS
OF PERSONAL GUARANTEES GIVEN, IF ANY: NIL
------------------------------------------------------------------------------------------------------------------------------
STATEMENT
OF MEANS
MR.
DINESHKUMAR P. SHAH
(RS. IN MILLIONS)
DETAILS OF ASSETS
OWNED
|
SR. NO. |
FULL DESCRIPTION
OF PROPERTY GIVING LOCATION AND FULL ADDRESS |
PURCHASE PRICE |
PRESENT MARKET
PRICE |
|
1. |
House: 5 Umiya Society, Ahmedabad Road,
Dehgam, Gujarat, India |
0.090 |
6.500 |
|
|
|
|
|
|
2. |
Shop: 10, Umiya Shopping Centre, Ahmedabad
Road, Dehgam, Gujarat, India |
0.100 |
4.000 |
|
|
|
|
|
|
3. |
Land: 521/1, Bubblepura, Sampa, Dehgam,
Gujarat, India |
0.200 |
4.500 |
|
|
|
|
|
|
4. |
Land of Paliya Block 46 |
1.000 |
4.000 |
|
|
|
|
|
|
5. |
Car Nissan Sunny |
0.928 |
0.900 |
|
|
|
|
|
|
|
TOTAL |
|
19.900 |
DETAILS
OF INVESTMENTS, IF ANY: NIL
INVESTMENT
BY WAY OF CAPITAL IN ASSOCIATES FIRM/ COMPANY
|
SR. NO. |
NAME OF THE FIRM/ COMPANY |
AMOUNT OF NET CAPITAL INVESTED AS ON DATE [AFTER
SETTING OF LOSSES, IF ANY] |
|
|
|
|
|
1. |
Dhwani Metal
Corp. [Proprietor] |
Rs. 1.791
Millions As on 31.03.2012 |
LOANS/DEPOSITS
WITH THIRD PARTIES/ FIRMS: NIL
DEPOSIT
WITH BANKS: NIL
DETAILS
OF BORROWINGS
|
SR. NO. |
AMOUNT OF BORROWING |
FROM WHOM BORROWED |
SECURITY OFFERED |
WHEN PAYABLE |
|
|
|
|
|
|
|
1. |
Rs. 3.500
Millions CC/OD in the
name of Dhwani Metal Corp. |
SBI, Dehgam |
House: 5, Umiya Society,
Ahmedabad Road, Dehgam |
Cash Credit A/c.
|
DETAILS
OF PERSONAL GUARANTEES GIVEN, IF ANY: NIL
------------------------------------------------------------------------------------------------------------------------------
STATEMENT
OF MEANS
MR.
PHOOLCHAND RUPLAL MAHESWARI
(RS. IN MILLIONS)
DETAILS OF ASSETS
OWNED
|
SR. NO. |
FULL DESCRIPTION
OF PROPERTY GIVING LOCATION AND FULL ADDRESS |
PURCHASE PRICE |
PRESENT MARKET
PRICE |
|
1. |
Flat at middle class society, Shahibaug,
Ahmedabad |
1.000 |
7.500 |
|
|
|
|
|
|
2. |
Land: 521/1, Bubblepura, Sampa, Dehgam,
Gujarat, India |
0.500 |
4.500 |
|
|
|
|
|
|
3. |
Plot in Vatva GIDC, Ahmedabad, Gujarat,
India |
0.200 |
4.000 |
|
|
|
|
|
|
4. |
Car Tata Manza |
0.750 |
0.600 |
|
|
|
|
|
|
|
TOTAL |
|
16.600 |
DETAILS
OF INVESTMENTS, IF ANY: NIL
LOANS/DEPOSITS
WITH THIRD PARTIES/ FIRMS: NIL
DEPOSIT
WITH BANKS: NIL
DETAILS
OF BORROWINGS: NIL
DETAILS
OF PERSONAL GUARANTEES GIVEN, IF ANY: NIL
------------------------------------------------------------------------------------------------------------------------------
INDEX OF CHARGES
|
S.NO. |
CHARGE ID |
DATE OF CHARGE
CREATION/MODIFICATION |
CHARGE AMOUNT
SECURED |
CHARGE HOLDER |
ADDRESS |
SERVICE REQUEST
NUMBER (SRN) |
|
1 |
10181068 |
05/10/2009 |
27,500,000.00 |
STATE BANK OF
INDIA |
STATION ROAD,
DEHGAM, GUJARAT - 382305, INDIA |
A71882070 |
|
2 |
10181069 |
05/10/2009 |
27,500,000.00 |
STATE BANK OF
INDIA |
STATION ROAD, DEHGAM,
GUJARAT - 382305, INDIA |
A71882179 |
------------------------------------------------------------------------------------------------------------------------------
CHANGE OF ADDRESS:
The Registered Office of the company has been shifted from Dhwani Weigh
Bridge, Modasa Road, Dehgam - 383305, Gujarat, India to the present address
w.e.f.29.05.2009.
------------------------------------------------------------------------------------------------------------------------------
FIXED ASSETS:
· Plant and Machinery
Land
and Land Development
Cold
Storage Building
CMT REPORT (Corruption, Money Laundering & Terrorism]
The Public Notice information has been collected from various sources including
but not limited to: The Courts,
1] INFORMATION ON
DESIGNATED PARTY
No exist
designating subject or any of its beneficial owners, controlling shareholders
or senior officers as terrorist or terrorist organization or whom notice had
been received that all financial transactions involving their assets have been
blocked or convicted, found guilty or against whom a judgement or order had
been entered in a proceedings for violating money-laundering, anti-corruption
or bribery or international economic or anti-terrorism sanction laws or whose
assets were seized, blocked, frozen or ordered forfeited for violation of money
laundering or international anti-terrorism laws.
2] Court Declaration :
No exist to suggest that subject is or was
the subject of any formal or informal allegations, prosecutions or other
official proceeding for making any prohibited payments or other improper
payments to government officials for engaging in prohibited transactions or
with designated parties.
3] Asset Declaration :
No records
exist to suggest that the property or assets of the subject are derived from
criminal conduct or a prohibited transaction.
4] Record on Financial
Crime :
Charges or conviction
registered against subject: None
5] Records on Violation of
Anti-Corruption Laws :
Charges or
investigation registered against subject: None
6] Records on Int’l
Anti-Money Laundering Laws/Standards :
Charges or
investigation registered against subject: None
7] Criminal Records
No available
information exist that suggest that subject or any of its principals have been
formally charged or convicted by a competent governmental authority for any
financial crime or under any formal investigation by a competent government
authority for any violation of anti-corruption laws or international anti-money
laundering laws or standard.
8] Affiliation with
Government :
No record
exists to suggest that any director or indirect owners, controlling
shareholders, director, officer or employee of the company is a government
official or a family member or close business associate of a Government
official.
9] Compensation Package :
Our market
survey revealed that the amount of compensation sought by the subject is fair
and reasonable and comparable to compensation paid to others for similar
services.
10] Press Report :
No press reports / filings exists on
the subject.
CORPORATE GOVERNANCE
MIRA INFORM as part of its Due Diligence do provide comments on
Corporate Governance to identify management and governance. These factors often
have been predictive and in some cases have created vulnerabilities to credit
deterioration.
Our Governance Assessment focuses principally on the interactions
between a company’s management, its Board of Directors, Shareholders and other
financial stakeholders.
CONTRAVENTION
Subject is not known to have contravened any existing local laws,
regulations or policies that prohibit, restrict or otherwise affect the terms and
conditions that could be included in the agreement with the subject.
FOREIGN EXCHANGE RATES
|
Currency |
Unit
|
Indian Rupees |
|
US Dollar |
1 |
Rs. 60.43 |
|
|
1 |
Rs. 100.12 |
|
Euro |
1 |
Rs. 79.74 |
INFORMATION DETAILS
|
Information
Gathered by : |
SVA |
|
|
|
|
Analysis Done by
: |
RAS |
|
|
|
|
Report Prepared
by : |
BVA |
SCORE & RATING EXPLANATIONS
|
SCORE FACTORS |
RANGE |
POINTS |
|
HISTORY |
1~10 |
4 |
|
PAID-UP CAPITAL |
1~10 |
3 |
|
OPERATING SCALE |
1~10 |
3 |
|
FINANCIAL CONDITION |
|
|
|
--BUSINESS SCALE |
1~10 |
3 |
|
--PROFITABILIRY |
1~10 |
3 |
|
--LIQUIDITY |
1~10 |
3 |
|
--LEVERAGE |
1~10 |
3 |
|
--RESERVES |
1~10 |
2 |
|
--CREDIT LINES |
1~10 |
3 |
|
--MARGINS |
-5~5 |
-- |
|
DEMERIT POINTS |
|
|
|
--BANK CHARGES |
YES/NO |
YES |
|
--LITIGATION |
YES/NO |
NO |
|
--OTHER ADVERSE INFORMATION |
YES/NO |
NO |
|
MERIT POINTS |
|
|
|
--SOLE DISTRIBUTORSHIP |
YES/NO |
NO |
|
--EXPORT ACTIVITIES |
YES/NO |
NO |
|
--AFFILIATION |
YES/NO |
NO |
|
--LISTED |
YES/NO |
NO |
|
--OTHER MERIT FACTORS |
YES/NO |
YES |
|
DEFAULTERS |
|
|
|
--RBI |
YES/NO |
NO |
|
--EPF |
YES/NO |
NO |
|
TOTAL |
|
27 |
This score
serves as a reference to assess SC’s credit risk and to set the amount of credit
to be extended. It is calculated from a composite of weighted scores obtained
from each of the major sections of this report. The assessed factors and their
relative weights (as indicated through %) are as follows:
Financial
condition (40%) Ownership
background (20%) Payment
record (10%)
Credit history
(10%) Market trend
(10%) Operational
size (10%)
RATING EXPLANATIONS
|
RATING |
STATUS |
PROPOSED CREDIT LINE |
|
|
>86 |
Aaa |
Possesses an extremely sound financial base with the strongest
capability for timely payment of interest and principal sums |
Unlimited |
|
71-85 |
Aa |
Possesses adequate working capital. No caution needed for credit
transaction. It has above average (strong) capability for payment of interest
and principal sums |
Large |
|
56-70 |
A |
Financial & operational base are regarded healthy. General
unfavourable factors will not cause fatal effect. Satisfactory capability for
payment of interest and principal sums |
Fairly Large |
|
41-55 |
Ba |
Overall operation is considered normal. Capable to meet normal
commitments. |
Satisfactory |
|
26-40 |
B |
Capability to overcome financial difficulties seems comparatively
below average. |
Small |
|
11-25 |
Ca |
Adverse factors are apparent. Repayment of interest and principal sums
in default or expected to be in default upon maturity |
Limited with
full security |
|
<10 |
C |
Absolute credit risk exists. Caution needed to be exercised |
Credit not
recommended |
|
-- |
NB |
New Business |
-- |
This report is issued at your request without any
risk and responsibility on the part of MIRA INFORM PRIVATE LIMITED (MIPL)
or its officials.