MIRA
INFORM REPORT
|
Report Date : |
29.08.2014 |
IDENTIFICATION DETAILS
|
Name : |
PUNTO FA SL |
|
|
|
|
Registered Office : |
C/Mercader, 9-11 - Polig.Ind.Riera De Caldes - Palau-Solita I
Plegamans - 08184 - |
|
|
|
|
Country : |
|
|
|
|
|
Financials (as on) : |
2012 |
|
|
|
|
Date of Incorporation : |
13.12.1989 |
|
|
|
|
Legal Form : |
Private Company |
|
|
|
|
Line of Business : |
·
Manufacture, marketing, distribution and sale of
all types of garments especially for women. ·
Retail sale of textiles in specialised stores |
|
|
|
|
No. of Employees |
3450 |
RATING & COMMENTS
|
MIRA’s Rating : |
Ba |
|
RATING |
STATUS |
PROPOSED CREDIT LINE |
|
|
41-55 |
Ba |
Overall operation is considered normal. Capable to meet normal
commitments. |
Satisfactory |
|
Status : |
Satisfactory |
|
|
|
|
Payment Behaviour : |
No Complaints |
|
|
|
|
Litigation : |
Clear |
NOTES :
Any query related to this report can be made on
e-mail : infodept@mirainform.com
while quoting report number, name and date.
ECGC Country Risk Classification List – June 1, 2014
|
Country Name |
Previous Rating (31.03.2014) |
Current Rating (01.06.2014) |
|
Spain |
A2 |
A2 |
|
Risk Category |
ECGC
Classification |
|
Insignificant |
A1 |
|
Low |
A2 |
|
Moderate |
B1 |
|
High |
B2 |
|
Very High |
C1 |
|
Restricted |
C2 |
|
Off-credit |
D |
SPAIN - ECONOMIC OVERVIEW
Spain experienced a prolonged recession in the wake of the
global financial crisis. GDP contracted by 3.7% in 2009, ending a 16-year
growth trend, and continued contracting through most of 2013. Economic growth
resumed in late 2013, albeit only modestly, as credit contraction in the
private sector, fiscal austerity, and high unemployment continued to weigh on
domestic consumption and investment. Exports, however, have been resilient
throughout the economic downturn, partially offsetting declines in domestic
consumption and helped to bring Spain's current account into surplus in 2013
for the first time since 1986. The unemployment rate rose from a low of about
8% in 2007 to more than 26% in 2013, straining Spain's public finances as
spending on social benefits increased while tax revenues fell. Spain’s budget
deficit peaked at 11.4% of GDP in 2009. Spain gradually reduced the deficit to
just under 7% of GDP in 2013, slightly above the 6.5% target negotiated between
Spain and the EU. Public debt has increased substantially – from 60.1% of GDP
in 2010 to 93.4% in 2013. Rising labor productivity, moderating labor costs,
and lower inflation have helped to improve foreign investor interest in the
economy and to reduce government borrowing costs. The government's ongoing
efforts to implement reforms - labor, pension, health, tax, and education - are
aimed at supporting investor sentiment. The government also has shored up
struggling banks exposed to Spain's depressed domestic construction and real
estate sectors by successfully completing an EU-funded restructuring and
recapitalization program in December 2013.
|
Source
: CIA |
EXECUTIVE SUMMARY
|
Name: |
PUNTO FA SL |
|
NIF / Fiscal code: |
B59088948 |
|
Trade Name |
MANGO |
|
Status: |
ACTIVE |
|
Incorporation Date: |
13/12/1989 |
|
Register Data |
Register Section 8 Sheet 167948 |
|
Last Publication in BORME: |
01/08/2014 [Appointments] |
|
Last Published Account Deposit: |
2012 |
|
Share Capital: |
12.565 |
|
|
|
|
Localization: |
C/MERCADER, 9-11 - POLIG.IND.RIERA DE CALDES - PALAU-SOLITA I
PLEGAMANS - 08184 - BARCELONA |
|
Telephone - Fax - Email - Website: |
Ph.:. 938602222 Email.
customer.service@mango.com Website. www.mango.es |
|
|
|
|
Activity: |
|
|
NACE: |
4751 - Retail sale of textiles in specialised stores |
|
Registered Trademarks: |
|
|
Audited / Opinion: |
Si / |
|
Tenders and Awards: |
0 for a total cost of 0 |
|
Subsidies: |
2 for a total cost of 8000 |
|
Quality Certificate: |
No |
|
|
|
|
Defaults, Legal Claims and Insolvency Proceedings
: |
|
|
|
|
|
|
|
Number |
Amount (€) |
Most Recent
Entry |
|
Insolvency Proceedings, Bankruptcy and Suspension of Payments |
|
Unpublished |
--- |
--- |
|
Defaults on debt with Financial Institutions and Large Companies |
|
1 |
177,19 |
--- |
|
Judicial Claims (Notices, Executive Proceedings, Attachments,
Auctions, Bad Debt) |
|
1 |
0 |
--- |
|
Proceedings heard by the Civil Court |
|
Unpublished |
0 |
--- |
|
Proceedings heard by the Labour Court |
|
Unpublished |
0 |
--- |
|
Partners: |
|
AFYON INVESTMENTS SICAV SA |
100 % |
|
|
Shares: |
57 |
|
|
Other Links: |
29 |
|
|
No. of Active Corporate Bodies: |
CHIEF EXECUTIVE OFFICER 2 |
|
|
Ratios |
2012 |
2011 |
Change |
|
|
|
|
|
Guarantees: |
|
|
Properties Registered: |
Company NO, Administrator NO |
|
Financing / Guarantee Sources : |
Sources YES, Guarantees YES |
|
|
|
|
INVESTIGATION SUMMARY |
|
|
Company constituted in late 1989. It is a multinational company dedicated
to the design, manufacture and marketing of clothing and accessories for
women and men. There are 3,450 employees located in charge together with the
holder. In the light of the foregoing, we consider the company apt to keep
being related to usual lending operations. |
|
|
Interviewed Person: |
|
Enquiry Details
|
Identification |
|
|
Social Denomination: |
PUNTO FA SL |
|
Trade Name: |
MANGO |
|
NIF / Fiscal code: |
B59088948 |
|
Corporate Status: |
ACTIVE |
|
Start of activity: |
1989 |
|
Registered Office: |
C/MERCADER, 9-11 - POLIG.IND.RIERA DE CALDES |
|
Locality: |
PALAU-SOLITA I PLEGAMANS |
|
Province: |
BARCELONA |
|
Postal Code: |
08184 |
|
Telephone: |
938602222 |
|
Fax: |
938602207 |
|
Website: |
|
|
Email: |
customer.service@mango.com |
|
Interviewed Person: |
Administración, escasos datos. |
Activity
|
NACE: |
4751 |
|
CNAE Obtaining Source: |
4751 |
|
Additional Information: |
Manufacture, marketing, distribution and sale of all types of garments
especially for women. |
|
Additional Address: |
Registered office, office and other units. |
|
Franchise: |
No |
|
Import / export: |
IMPORTS / EXPORTS |
|
Future Perspective: |
Consolidation |
|
Industry situation: |
Maturity |
Number of Employees
|
|
Year |
No. of employees |
Established |
Incidentals |
|
|
|
2014 |
3450 |
|
|
|
Chronological Summary
|
|
Year |
Act |
|
|
|
1991 |
Accounts deposit (ejer. 1990) Appointments/ Re-elections (2) |
|
|
|
1992 |
Accounts deposit (ejer. 1991) Appointments/ Re-elections (3) Capital Reduction
(1) Increase of Capital (1) |
|
|
|
1993 |
Appointments/ Re-elections (1) Change of Social Purpose (1) |
|
|
|
1994 |
Accounts deposit (ejer. 1992, 1993) Appointments/ Re-elections (1) |
|
|
|
1995 |
Accounts deposit (ejer. 1994) Change of Social address (1) |
|
|
|
1996 |
Accounts deposit (ejer. 1995) |
|
|
|
1997 |
Accounts deposit (ejer. 1996 consolidated, 1996) Adaptation to Law (1)
Appointments/ Re-elections (3) Change of Social Purpose (1) |
|
|
|
1998 |
Accounts deposit (ejer. 1997 consolidated, 1997) Appointments/
Re-elections (4) |
|
|
|
1999 |
Accounts deposit (ejer. 1998 consolidated, 1998) Appointments/ Re-elections
(4) Statutory Modifications (1) Take-over Merger (4) |
|
|
|
2000 |
Accounts deposit (ejer. 1999 consolidated, 1999) Appointments/
Re-elections (2) Other Concepts/ Events (1) Statutory Modifications (2)
Take-over Merger (1) |
|
|
|
2001 |
Accounts deposit (ejer. 2000) Appointments/ Re-elections (1) |
|
|
|
2002 |
Accounts deposit (ejer. 2001) Appointments/ Re-elections (1) Change of
Social Purpose (1) |
|
|
|
2003 |
Accounts deposit (ejer. 2002) Appointments/ Re-elections (1)
Cessations/ Resignations/ Reversals (2) |
|
|
|
2004 |
Accounts deposit (ejer. 2003) Appointments/ Re-elections (3) |
|
|
|
2005 |
Accounts deposit (ejer. 2004) Appointments/ Re-elections (1) |
|
|
|
2006 |
Appointments/ Re-elections (4) Cessations/ Resignations/ Reversals (1) |
|
|
|
2007 |
Accounts deposit (ejer. 2005, 2006) Appointments/ Re-elections (7) Cessations/
Resignations/ Reversals (4) Increase of Capital (2) Loss of the sole
propietorship condition (1) Other Concepts/ Events (1) Statutory
Modifications (2) |
|
|
|
2008 |
Appointments/ Re-elections (1) |
|
|
|
2009 |
Accounts deposit (ejer. 2007, 2008) Appointments/ Re-elections (2)
Cessations/ Resignations/ Reversals (2) |
|
|
|
2010 |
Appointments/ Re-elections (3) Cessations/ Resignations/ Reversals (1) |
|
|
|
2011 |
Accounts deposit (ejer. 2009, 2010) Appointments/ Re-elections (5)
Take-over Merger (1) |
|
|
|
2012 |
Accounts deposit (ejer. 2011) Appointments/ Re-elections (2) |
|
|
|
2013 |
Accounts deposit (ejer. 2012) Appointments/ Re-elections (3) Cessations/
Resignations/ Reversals (2) |
|
|
|
2014 |
Appointments/ Re-elections (1) |
|
Main
Historic Changes\
|
|
|
|
|
|
Concept |
Publication |
Act |
Date |
|
Corporate Purpose Changes: |
LAS OPERACIONES Y NEGOCIOS DE TODAS CLASES SOBRE BIENES INMUEBLES DE
CUALQUIER NATURALEZA. SU TRANSFORMACION POR URBANIZACION Y CONSTRUCCION Y
EXPLOTACION JURIDICA Y ECONOMICA. |
|
05/12/1997 |
Breakdown of Owners' Equity
|
Registered Capital: |
12.565 |
|
Paid up capital: |
12.565 |
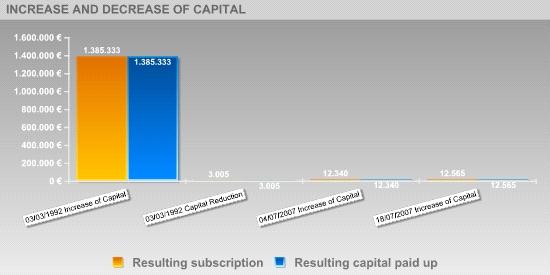
Updated Evolution of the
Subscribed and Paid-in Capital
|
|
|||||
|
|
|
|
|
|
|
|
Publishing Date |
Registration
Type |
Capital
Subscribed |
Paid up capital |
Underwritten
result |
Disbursed Result |
|
03/03/1992 |
Increase of Capital |
1.382.328 |
1.382.328 |
1.385.333 |
1.385.333 |
|
03/03/1992 |
Capital Reduction |
-1.382.328 |
-1.382.328 |
3.005 |
3.005 |
|
04/07/2007 |
Increase of Capital |
9.334 |
9.334 |
12.340 |
12.340 |
|
18/07/2007 |
Increase of Capital |
225 |
225 |
12.565 |
12.565 |
Active Social Bodies
|
Post published |
Social Body's
Name |
Appointment Date |
Other Positions
in this Company |
|
PRESIDENT |
MANGO MNG HOLDING SL |
29/01/2010 |
3 |
|
MEMBER OF THE BOARD |
MANGO MNG HOLDING SL |
29/01/2010 |
3 |
|
|
MANGO MNG SL |
29/01/2010 |
3 |
|
|
KAPIT ADMINT SL |
18/07/2007 |
1 |
|
PROXY |
ORTEGA GARCIA ISABEL |
26/03/2013 |
3 |
|
|
GARCIA LECUMBERRI MARIA JESUS |
26/03/2013 |
12 |
|
|
VILALTA BIESCAS ELISENDA |
26/03/2013 |
5 |
|
|
ESCUTIA GARCIA ALEJANDRO |
26/03/2013 |
4 |
|
|
LOPEZ GARCIA DANIEL |
11/10/2011 |
3 |
|
|
DELFA ARISTA ANA |
26/05/2011 |
2 |
|
|
CASI BRUNSO ENRIC |
23/12/2009 |
2 |
|
|
GIL BERTOMEU MIRIAM |
26/01/2007 |
2 |
|
|
MARTINEZ VICENTE ESTER |
10/04/2006 |
2 |
|
|
ANDRES GARCIA DEBORA |
24/02/2004 |
1 |
|
|
BELLO BODAS SILVIA |
06/08/1998 |
1 |
|
|
ERMAY ANDIC SOL |
22/02/1994 |
1 |
|
|
NAHMAN ANDIC |
30/10/1992 |
1 |
|
|
ISAK HALFON |
09/04/1992 |
1 |
|
CHIEF EXECUTIVE OFFICER |
MANGO MNG SL |
29/01/2010 |
3 |
|
|
MANGO MNG HOLDING SL |
29/01/2010 |
3 |
|
SECRETARY |
MANGO MNG SL |
29/01/2010 |
3 |
|
REPRESENTATIVE |
ANDIC RAIG JONATHAN |
15/07/2013 |
1 |
|
|
ISAK ANDIC ERMAY |
29/01/2010 |
5 |
|
|
CASI BRUNSO ENRIC |
18/07/2007 |
2 |
|
ACCOUNTS' AUDITOR / HOLDER |
AUREN AUDITORS BCN SA |
24/07/2014 |
2 |
|
|
PRICEWATERHOUSECOOPERS AUDITORES SL |
24/07/2014 |
1 |
Historical
Social Bodies
|
Social Body's
Name |
Post published |
End Date |
Other Positions
in this Company |
|
AUREN AUDITORS BARCELONA SA |
ACCOUNTS' AUDITOR / HOLDER |
11/11/2010 |
4 |
|
|
ACCOUNTS' AUDITOR / HOLDER |
06/04/2011 |
|
|
|
ACCOUNTS' AUDITOR / HOLDER |
10/04/2012 |
|
|
|
ACCOUNTS' AUDITOR / HOLDER |
25/01/2013 |
|
|
AUREN AUDITORS BCN SA |
ACCOUNTS' AUDITOR / HOLDER |
24/07/2014 |
2 |
|
AUREN AUDITORS CONSULTORS BARCELONA SA |
ACCOUNTS' AUDITOR / HOLDER |
22/03/2004 |
6 |
|
|
ACCOUNTS' AUDITOR / HOLDER |
15/03/2005 |
|
|
|
ACCOUNTS' AUDITOR / HOLDER |
28/11/2008 |
|
|
|
ACCOUNTS' AUDITOR / HOLDER |
23/04/2009 |
|
|
|
ACCOUNTS' AUDITOR / HOLDER |
30/03/2006 |
|
|
|
ACCOUNTS' AUDITOR / HOLDER |
20/04/2007 |
|
|
AUREN FIDEM CONSULTORS AUDITORS SA |
ACCOUNTS' AUDITOR / HOLDER |
08/03/2002 |
5 |
|
|
ACCOUNTS' AUDITOR / HOLDER |
28/02/2003 |
|
|
|
ACCOUNTS' AUDITOR / HOLDER |
28/06/1999 |
|
|
|
CONSOLIDATED ACCOUNTS' AUDITOR |
22/04/2000 |
|
|
|
ACCOUNTS' AUDITOR / HOLDER |
12/02/2001 |
|
|
COOPERS AND LYBRAND AUDITORIA Y CONSULTORIA SRL |
CONSOLIDATED ACCOUNTS' AUDITOR |
22/04/2000 |
2 |
|
|
ACCOUNTS' AUDITOR / HOLDER |
28/06/1999 |
|
|
DELFA ARISTA ANA |
PROXY |
26/05/2011 |
2 |
|
ESCUTIA GARCIA ALEJANDRO |
PROXY |
26/03/2013 |
4 |
|
|
PROXY |
26/05/2011 |
|
|
|
PROXY |
13/12/2010 |
|
|
FIDEM AUDITORS SA |
ACCOUNTS' AUDITOR / HOLDER |
28/06/1999 |
1 |
|
FOLIA AND CIA AUDITORS CENSORS JURATS DE COMPTES S |
ACCOUNTS' AUDITOR / HOLDER |
07/07/1997 |
1 |
|
GARCIA LECUMBERRI MARIA JESUS |
PROXY |
07/03/2012 |
12 |
|
|
PROXY |
26/03/2013 |
|
|
|
PROXY |
20/02/1997 |
|
|
|
PROXY |
06/04/1998 |
|
|
|
PROXY |
06/08/1999 |
|
|
|
PROXY |
25/05/2004 |
|
|
|
PROXY |
07/09/2006 |
|
|
|
PROXY |
09/02/2007 |
|
|
|
PROXY |
16/05/2007 |
|
|
|
PROXY |
23/11/2007 |
|
|
|
PROXY |
17/11/2009 |
|
|
GIL BERTOMEU MIRIAM |
PROXY |
26/01/2007 |
2 |
|
HALFON ISAK |
PROXY |
17/11/2009 |
1 |
|
ISAK ANDIC ERMAY |
ADMINISTRATOR |
18/07/2007 |
5 |
|
|
MEMBER OF THE BOARD |
29/01/2010 |
|
|
|
CHIEF EXECUTIVE OFFICER |
29/01/2010 |
|
|
|
PRESIDENT |
29/01/2010 |
|
|
ISAK ERMAY |
ADMINISTRATOR |
18/07/2007 |
1 |
|
LOPEZ GARCIA DANIEL |
PROXY |
24/08/2011 |
3 |
|
|
PROXY |
11/10/2011 |
|
|
MACARRO FERNANDEZ MONTSERRAT |
PROXY |
22/10/2003 |
1 |
|
MANGO-MNG SL |
SINGLE PARTNER |
18/07/2007 |
1 |
|
MARGARIT BONET JORDI |
PROXY |
22/10/2003 |
1 |
|
MARTINEZ VICENTE ESTER |
PROXY |
10/04/2006 |
2 |
|
NAHMAN ANDIC ERMAY |
ADMINISTRATOR |
18/07/2007 |
5 |
|
|
MEMBER OF THE BOARD |
29/01/2010 |
|
|
|
CHIEF EXECUTIVE OFFICER |
29/01/2010 |
|
|
|
SECRETARY |
29/01/2010 |
|
|
|
REPRESENTATIVE |
15/07/2013 |
|
|
ORTEGA GARCIA ISABEL |
PROXY |
26/05/2011 |
3 |
|
|
PROXY |
26/03/2013 |
|
|
PRICE WATERHOUSE COOPERS AUDITORES S L |
ACCOUNTS' AUDITOR / HOLDER |
20/04/2007 |
1 |
|
PRICE WATERHOUSE COOPERS AUDITORES SL |
ACCOUNTS' AUDITOR / HOLDER |
22/03/2004 |
12 |
|
|
ACCOUNTS' AUDITOR / HOLDER |
08/03/2002 |
|
|
|
ACCOUNTS' AUDITOR / HOLDER |
28/02/2003 |
|
|
|
ACCOUNTS' AUDITOR / HOLDER |
15/03/2005 |
|
|
|
ACCOUNTS' AUDITOR / HOLDER |
30/03/2006 |
|
|
|
ACCOUNTS' AUDITOR / HOLDER |
28/11/2008 |
|
|
|
ACCOUNTS' AUDITOR / HOLDER |
06/04/2011 |
|
|
|
ACCOUNTS' AUDITOR / HOLDER |
23/04/2009 |
|
|
|
ACCOUNTS' AUDITOR / HOLDER |
11/11/2010 |
|
|
|
ACCOUNTS' AUDITOR / HOLDER |
10/04/2012 |
|
|
|
ACCOUNTS' AUDITOR / HOLDER |
24/07/2014 |
|
|
|
ACCOUNTS' AUDITOR / HOLDER |
25/01/2013 |
|
|
PRICE WATERHOUSE COOPERS SL |
ACCOUNTS' AUDITOR / HOLDER |
12/02/2001 |
1 |
|
SORIANO PEREZ EVARISTO |
PROXY |
23/11/2007 |
1 |
|
SORIANO PEREZ MARIA PILAR |
PROXY |
16/05/2007 |
3 |
|
|
PROXY |
17/11/2009 |
|
|
|
PROXY |
06/08/1999 |
|
|
VILALTA BIESCAS ELISENDA |
PROXY |
17/11/2009 |
5 |
|
|
PROXY |
16/05/2007 |
|
|
|
PROXY |
06/08/1999 |
|
|
|
PROXY |
26/03/2013 |
|
Executive
board
|
Post |
NIF |
Name |
|
CHAIRMAN |
|
MANGO MNG HOLDING SL |
|
DIRECTOR/GENERAL MANAGER |
|
ANDIC RAIG JONATHAN |
Defaults,
Legal Claims and Insolvency Proceedings
Section enabling assessment of the degree of compliance of the company queried
with its payment obligations. It provides information on the existence and
nature of all stages of Insolvency and Legal Proceedings published with
reference to the Company in the country's various Official Bulletins and
national newspapers, as well Defaults Registered in the main national credit
bureaus (ASNEF Industrial and RAI ).
> Summary
Chronological
summary
|
|
|
Number of
Publications |
Amount (_) |
Start date |
End date |
|
Insolvency Proceedings, Bankruptcy and Suspension of Payments |
|
Unpublished |
--- |
--- |
--- |
|
Request/Declaration |
|
0 |
--- |
date |
|
|
Proceedings |
|
--- |
--- |
|
--- |
|
Resolution |
|
--- |
--- |
|
--- |
|
Defaults on debt with Financial Institutions and Large Companies |
Bank and Commercial Delinquency |
1 |
0 |
10/12/2013 |
21/08/2014 |
|
Status: Friendly |
|
1 |
177.19 |
10/12/2013 |
10/03/2014 |
|
Status: Pre-Litigation |
|
--- |
|
|
|
|
Status: Litigation |
|
--- |
|
|
|
|
Status: Non-performing |
|
--- |
|
|
|
|
Status: insolvency proceedings, bankruptcy and suspension of payments |
|
--- |
|
|
|
|
Other status |
|
--- |
|
|
|
|
Legal and Administrative Proceedings |
|
1 |
--- |
23/02/2010 |
23/02/2010 |
|
Notices of defaults and enforcement |
|
1 |
--- |
|
--- |
|
Seizures |
|
--- |
--- |
|
--- |
|
Auctions |
|
--- |
--- |
|
--- |
|
Declarations of insolvency and bad debt |
|
--- |
--- |
|
--- |
|
Proceedings heard by the Civil Court |
|
Unpublished |
--- |
|
|
|
Proceedings heard by the Labour Court |
|
Unpublished |
--- |
|
|
> Details
IMPAGOS EN ENTIDADES FINANCIERAS Y GRANDES EMPRESAS
Section comprising a list of the instances of default recorded in the
ASNEF Industrial file under the name of .
List of current instances of default for each of the transactions in
progress
|
Type of creditor |
Product |
Value of
transactions (_) |
Status |
No. of defaults |
Default balance
(_) |
Date of first
default |
Date of last
default |
|
OTRAS |
Otros |
--- |
Amistoso |
4 |
177.19 |
10/12/13 |
10/03/14 |
|
|
|
177,19 |
|
|
|
||
> Basis
for rating
|
Positive Factors |
Adverse Factors |
|
It is one of the major domestic companies in terms of sales volume. PUNTO FA SL 's borrowing cost is appropriate according to its volume
of external financing sources. The development of the structure of the debt during the last two years
indicates a decrease of the debt with credit institutions and trade creditors
in respect to all liabilities. The lower the level of debt, the lower the
dependence on suppliers capital and the more guarantee will have its
financial situation. Significant operating income. The Company has the necessary return on
the investments for its main activity in comparison with its assets. This
return is higher than that of the financial year 2011 which means that the
company's financial situation has improved. It presents a efficient productivity. EBITDA shows adequate company
costs management as income exceed operating expenses. |
It has been found to have irregular payment performance at the credit
bureaus, although it is not relevant enough to change the rating. PUNTO FA SL it presents an excessive indebtedness that may compromise
their balance sheet. Solvency decrease. Its capacity to bear the cost derived form debts
incurred with third parties has decreased significantly in its last fiscal
year. PUNTO FA SL presents a low turnover of the current assets , which
could indicate an inefficient use of non-current assets due to the lacking of
enough operating income capacity based on the dedicated assets available for
sale. |
Result
of query submitted to the R.A.I. (Spanish Bad Debt Register) on
LEGAL CLAIMS
|
Summary of Judicial Claims |
|
|
|
|
|
|
|
|
||
|
|
|
No se han publicado |
|
|
|
|
No se han publicado |
|
|
|
|
||
|
|
|
No se han publicado |
|
|
|
|
No se han publicado |
|
|
|
|
No se han publicado |
|
|
|
|
|
|
|
|
|
||
|
|
|
No se han publicado |
|
|
|
|
No se han publicado |
|
|
|
|
||
|
|
|
No se han publicado |
|
Incidences Detailed
Incidences with the Local Administration
![]() PROCESSED BY
THE LOCAL GOVERNMENT DE SEVILLA - Date 23/02/2010
PROCESSED BY
THE LOCAL GOVERNMENT DE SEVILLA - Date 23/02/2010
|
Last Published Stage: |
SEIZURE |
|
Record Number: |
200900045023 |
|
Amount of the incidence: |
0,00 E |
|
Requested by: |
ADMINISTRACION LOCAL |
|
Published domicile: |
(DESCONOCIDA) |
|
Source: |
B.O.P. SEVILLA Nº20, 2010 SUPLEMENTO 1 PAGINA 280 |
References
Link List
|
PARTICIPATES IN: |
57 Entities |
|
SHAREHOLDERS: |
1 Entities |
|
ABSORBS TO: |
3 Entities |
|
BELONGS TO THE ADMINISTRATION BOARD OF: |
1 Entities |
|
HAS IN ITS ADMINISTRATION BOARD TO: |
3 Entities |
|
IS RELATED WITH: |
22 Entities |
> Shareholders
|
Relationship |
Entity |
Province |
Shareholding stake |
|
SHAREHOLDERS |
AFYON INVESTMENTS SICAV SA |
BARCELONA |
100 |
|
|
AFYON INVESTMENTS SICAV SA |
BARCELONA |
100 |
|
PARTICIPATES IN |
PUNTO MI SL |
BARCELONA |
100 |
|
|
DIKNAH SL |
BARCELONA |
100 |
|
|
KAYSERI INVERSIONES SIMCAV SA |
BARCELONA |
100 |
|
|
MANGO SUISSE, S.A. |
|
100 |
|
|
DARDANELOS INVERSIONES SICAV SA |
BARCELONA |
100 |
|
|
FOURSOME SICAV S.A. |
BARCELONA |
100 |
|
|
INVESTMENTS AKNAM SICAV SA |
BARCELONA |
100 |
|
|
INVESTMENTS ANSAVE SICAV SOCIEDAD ANONIMA |
BARCELONA |
100 |
|
|
TOPKAPI INVERSIONES SICAV SA |
BARCELONA |
100 |
|
|
INVERSIONES GIRALDA SA |
MADRID |
100 |
|
|
MANGO HONG KONG, SOCIEDAD ANONIMA, (CHINA) |
|
99 |
|
|
PUNTA NA FRANCE (FRANCIA) |
|
49.99 |
|
|
MANGO BELGIQUE SPRL (BELGICA) |
|
99.99 |
|
|
MANGO FRANCE SARL (FRANCIA) |
|
100 |
|
|
MANGO HUNGARY KFT (HUNGRIA) |
|
100 |
|
|
MANGO NEDERLAND BV (HOLANDA) |
|
100 |
|
|
MANGO NORGE AS (NORUEGA) |
|
100 |
|
|
MANGO TR. TEKSTILTIC, SOCIEDAD ANONIMA, STI (TURQUIA) |
|
99.91 |
|
|
MANGO UK, SOCIEDAD ANONIMA, (REINO UNIDO) |
|
100 |
|
|
MANGO CZ SRO (REPUBLICA CHECA) |
|
99.91 |
|
|
MANGO BRASIL COMERCIAL, SOCIEDAD ANONIMA, (BRASIL) |
|
99.99 |
|
|
MANGO DEUTSCHLAND, SOCIEDAD ANONIMA, (ALEMANIA) |
|
51 |
|
|
MANGO OSTERREICH HANDELS, S.A. |
|
100 |
|
|
DEREK INVESTMENT SA |
BARCELONA |
100 |
|
|
PUNTA NA DEUTSCHLAND, S.A. |
|
6 |
|
|
MANGO JAPAN, S.A. |
|
100 |
|
|
MANGO SUOMI OY |
|
100 |
|
|
MANGO GARMENTS AND ACCESSORY TRADING, S.A. |
|
100 |
|
|
MANGO GARMENTS HELLAS, S.A. |
|
100 |
|
|
MANGO ITALIA, S.L. |
|
100 |
|
|
MANGO MNG USA INC |
|
100 |
|
|
MANGO RUSSIA |
|
100 |
|
|
MANGO SVERIGE AB |
|
100 |
|
|
MANGONOR COMER. DE VESTUAR, S.A. |
|
100 |
|
|
MANGO DANMARK APS |
|
100 |
|
|
MANGO MERITXELL, S.L. |
|
32 |
|
|
MANGO POLSKA SP ZOO |
|
100 |
|
|
CONSOLIDATED ARTISTS BV |
|
|
|
|
DISTEX INC |
|
|
|
|
MANGO NY INC |
|
|
|
|
TEXDIS USA INC |
|
|
|
|
MANGO GARMENTS RUMANIA, SOCIEDAD LIMITADA, (RUMANIA) |
|
100 |
|
|
MANGO MACAU LIMITADA (FRANCIA) |
|
99.98 |
|
|
MANGO SINGAPUR (SINGAPUR) |
|
100 |
|
|
MANGO SLOVENSKO SRO (ESLOVAQUIA) |
|
99.91 |
|
|
PUNTA NA TAKSIM GAYRIMENKUL TI (TURQUIA) |
|
99.99 |
|
|
IL CERRERO, SOCIEDAD LIMITADA, (ITALIA) |
|
|
|
|
MANGO GARMENTS & ACCES COLT (CHINA) |
|
|
|
|
GRAND QUARTIER SAS |
|
|
|
|
MANGO EGYPT LLC |
|
|
|
|
MANGO HAUSSMANN |
|
100 |
|
|
MANGO KOREA, S.A. |
|
100 |
|
|
MANGO MNG CANADA CORPORATION |
|
100 |
|
|
MANGO MNG IRELAND, S.A. |
|
100 |
|
|
MANGO TOULON SAS |
|
|
|
|
TEXTIL EGYPT TRADING JSC |
|
99.98 |
> Other relationships
|
Relationship |
Entity |
Province |
Shareholding stake |
|
IS RELATED WITH |
| | |
|
|
|
|
MANGO MNG HOLDING SL |
BARCELONA |
|
|
|
NAVIERA ES NORAI AIE |
BARCELONA |
|
|
|
FINECOL, SOCIEDAD ANONIMA, (FRANCIA) |
|
|
|
|
PUNTA NA TAKSIM |
|
|
|
|
SHARPE KNIGHT, S.A. |
|
|
|
|
SHARPE KNIGHT MANCHESTER, S.A. |
|
|
|
|
GALERIE DE GRANDE ARCADES SARL (FRANCIA) |
|
|
|
|
GRANDE MAISON DE BLANC |
|
|
|
|
SCI GALERIES GRANDES ARCADES |
|
|
|
|
SCI PUNTA NA MARSEILLE SARL |
|
|
|
|
VOLIMOB, SOCIEDAD ANONIMA, (PARIS) |
|
|
|
|
ISNA SA |
BARCELONA |
|
|
|
PUNTO RE SL |
BARCELONA |
|
|
|
MANGO MNG BIRD SA |
BARCELONA |
|
|
|
KAPIT ADMINT S.L |
BARCELONA |
|
|
|
DRALUX IMPORT SOCIEDAD LIMITADA |
GUADALAJARA |
|
|
|
MANGO ON LINE SA |
BARCELONA |
|
|
|
LONGSHORE SL |
MADRID |
|
|
|
KAPIT ADMINT S.L |
BARCELONA |
|
|
|
SERRALLO PLAZA RETAIL SOCIEDAD LIMITADA |
GRANADA |
|
|
IS RELATED WITH |
ISNA SA |
BARCELONA |
|
|
|
BABANKI TREM SL |
BARCELONA |
|
|
ABSORBS TO |
NEW CLOS, S.A. |
BARCELONA |
|
|
|
PUNTO MI SL |
BARCELONA |
|
|
|
PUNTO RE SL |
BARCELONA |
|
|
HAS IN ITS ADMINISTRATION BOARD TO |
KAPIT ADMINT S.L |
BARCELONA |
|
|
|
MANGO MNG HOLDING SL |
BARCELONA |
|
|
|
MANGO MNG SL |
BARCELONA |
|
|
BELONGS TO THE ADMINISTRATION BOARD OF |
MANGO MNG HOLDING SL |
BARCELONA |
|
Turnover
|
Total Sales 2013 |
1.200.000 |
Estimated Balance
|
Prev. 2013 NON CURRENT ASSETS 1.500.000.000 CURRENT ASSETS
1.100.000.000 EQUITY 400.000.000 NON CURRENT LIABILITIES 1.650.000.000
CURRENT LIABILITIES 550.000.000 TOTAL ASSETS AND LIABILITIES 2.600.000.000
SALES2013 1.200.000.000 |
Financial
Accounts and Balance Sheets
Financial Years Presented
|
Ejercicio |
Tipo de Cuentas Anuales |
Fecha Presentacion |
|
2012 |
Normales |
August 2013 |
|
2011 |
Normales |
August 2012 |
|
2010 |
Normales |
August 2011 |
|
2009 |
Normales |
December 2010 |
|
2008 |
Normales |
September 2009 |
|
2007 |
Normales |
December 2008 |
|
2006 |
Normales |
August 2007 |
|
2005 |
Normales |
December 2006 |
|
2004 |
Normales |
September 2005 |
|
2003 |
Normales |
August 2004 |
|
2002 |
Normales |
September 2003 |
|
2001 |
Normales |
August 2002 |
|
2000 |
Normales |
August 2001 |
|
1999 |
Consolidadas |
October 2000 |
|
1999 |
Normales |
August 2000 |
|
1999 |
Normales |
August 2000 |
|
1998 |
Consolidadas |
August 1999 |
|
1998 |
Normales |
August 1999 |
|
1997 |
Consolidadas |
September 1998 |
|
1997 |
Normales |
November 1998 |
|
1996 |
Consolidadas |
September 1997 |
|
1996 |
Normales |
September 1997 |
|
1995 |
Normales |
July 1996 |
|
1994 |
Normales |
August 1995 |
|
1993 |
Normales |
September 1994 |
|
1992 |
Normales |
December 1993 |
|
1991 |
Normales |
July 1992 |
|
1990 |
Normales |
September 1991 |
The data in the report regarding the last Company Accounts submitted by
the company is taken from the TRADE REGISTER serving the region in which the
company's address is located 30/12/2012
> Balance en formato Normal de acuerdo al Nuevo Plan General
Contable 2007
Information corresponding to the fiscal year
2012 2011 2010 2009 is taken from information submitted to
the TRADE REGISTER. Data corresponding to fiscal years before
2012 2011 2010 2009 has been compiled based on the
equivalence criteria stipulated in Act JUS/206/2009. Where the provisions of
the Act did not establish relevant equivalence criteria using its own
methodology. To view details on the methodology.
|
|
ORIGINAL |
ORIGINAL |
ORIGINAL |
ORIGINAL |
EQUIVALENCIA |
|
|
Assets |
2012 |
2011 |
2010 |
2009 |
2008 |
|
|
A) NON-CURRENT ASSETS: 11000 |
1.463.739.000,00 |
1.299.854.000,00 |
1.280.447.000,00 |
1.238.091.000,00 |
1.104.017.696,00 |
|
|
I. Intangible fixed assets : 11100 |
16.010.000,00 |
15.162.000,00 |
14.426.000,00 |
15.290.000,00 |
21.255.103,00 |
|
|
1. Development: 11110 |
0,00 |
0,00 |
0,00 |
0,00 |
0,00 |
|
|
2. Concessions: 11120 |
0,00 |
0,00 |
0,00 |
0,00 |
4.492,00 |
|
|
3. Patents, licencing, trade
marks and similar: 11130 |
0,00 |
0,00 |
0,00 |
0,00 |
0,00 |
|
|
4. Goodwill: 11140 |
0,00 |
0,00 |
0,00 |
0,00 |
0,00 |
|
|
5. IT applications:
11150 |
2.641.000,00 |
2.718.000,00 |
2.143.000,00 |
1.399.000,00 |
3.226.301,00 |
|
|
6. Investigation:
11160 |
0,00 |
0,00 |
0,00 |
0,00 |
0,00 |
|
|
7. Other intangible fixed
assets: 11170 |
13.369.000,00 |
12.444.000,00 |
12.283.000,00 |
13.891.000,00 |
18.024.309,00 |
|
|
II. Tangible fixed assets : 11200 |
104.577.000,00 |
111.965.000,00 |
124.773.000,00 |
141.543.000,00 |
160.451.897,00 |
|
|
1. Land and buildings:
11210 |
0,00 |
0,00 |
0,00 |
0,00 |
2.842.743,00 |
|
|
2. Technical installations
and other tangible fixed assets: 11220 |
99.150.000,00 |
110.345.000,00 |
122.647.000,00 |
139.054.000,00 |
149.478.154,00 |
|
|
3. Tangible asset in
progress and advances: 11230 |
5.427.000,00 |
1.620.000,00 |
2.126.000,00 |
2.489.000,00 |
8.131.000,00 |
|
|
III. Real estate investment: 11300 |
0,00 |
0,00 |
0,00 |
0,00 |
0,00 |
|
|
1. Land: 11310 |
0,00 |
0,00 |
0,00 |
0,00 |
0,00 |
|
|
2. Buildings: 11320 |
0,00 |
0,00 |
0,00 |
0,00 |
0,00 |
|
|
IV. Long-term investments in Group companies and
associates : 11400 |
1.135.082.000,00 |
983.802.000,00 |
965.991.000,00 |
922.274.000,00 |
887.839.063,00 |
|
|
1. Equity instruments:
11410 |
1.098.746.000,00 |
930.961.000,00 |
923.717.000,00 |
878.576.000,00 |
887.839.063,00 |
|
|
2. Credits to businesses:
11420 |
36.336.000,00 |
52.841.000,00 |
42.274.000,00 |
43.698.000,00 |
0,00 |
|
|
3. Debt securities:
11430 |
0,00 |
0,00 |
0,00 |
0,00 |
0,00 |
|
|
4. Derivatives : 11440 |
0,00 |
0,00 |
0,00 |
0,00 |
0,00 |
|
|
5. Other financial assets :
11450 |
0,00 |
0,00 |
0,00 |
0,00 |
0,00 |
|
|
6. Other investments:
11460 |
0,00 |
0,00 |
0,00 |
0,00 |
0,00 |
|
|
V. Long-term financial investments: 11500 |
6.618.000,00 |
5.970.000,00 |
4.363.000,00 |
4.800.000,00 |
29.371.937,00 |
|
|
1. Equity instruments:
11510 |
0,00 |
0,00 |
0,00 |
0,00 |
0,00 |
|
|
2. Credits to third parties
: 11520 |
0,00 |
25.000,00 |
100.000,00 |
476.000,00 |
25.505.937,00 |
|
|
3. Debt securities:
11530 |
1.750.000,00 |
1.400.000,00 |
0,00 |
0,00 |
0,00 |
|
|
4. Derivatives : 11540 |
0,00 |
0,00 |
0,00 |
83.000,00 |
0,00 |
|
|
5. Other financial assets :
11550 |
4.868.000,00 |
4.545.000,00 |
4.263.000,00 |
4.241.000,00 |
3.866.000,00 |
|
|
6. Other investments:
11560 |
0,00 |
0,00 |
0,00 |
0,00 |
0,00 |
|
|
VI. Assets for deferred tax : 11600 |
201.452.000,00 |
182.955.000,00 |
170.894.000,00 |
154.184.000,00 |
5.099.696,00 |
|
|
VII. Non-current trade debts : 11700 |
0,00 |
0,00 |
0,00 |
0,00 |
0,00 |
|
|
B) CURRENT ASSETS: 12000 |
1.138.476.000,00 |
1.334.100.000,00 |
873.889.000,00 |
766.750.000,00 |
713.145.304,00 |
|
|
I. Non-current assets held for sale : 12100 |
0,00 |
0,00 |
0,00 |
0,00 |
0,00 |
|
|
II. Stocks: 12200 |
343.592.000,00 |
348.742.000,00 |
302.685.000,00 |
236.465.000,00 |
271.874.000,00 |
|
|
1. Commercial: 12210 |
299.257.000,00 |
309.410.000,00 |
270.755.000,00 |
219.361.000,00 |
249.686.000,00 |
|
|
2. Primary material and
other supplies: 12220 |
19.652.000,00 |
26.639.000,00 |
16.516.000,00 |
10.449.000,00 |
12.093.000,00 |
|
|
3. Work in progress:
12230 |
24.679.000,00 |
12.693.000,00 |
15.403.000,00 |
6.644.000,00 |
10.036.000,00 |
|
|
a) Of
long-term production cycle : 12231 |
0,00 |
0,00 |
0,00 |
0,00 |
0,00 |
|
|
b) Of short-term
production cycle : 12232 |
24.679.000,00 |
12.693.000,00 |
15.403.000,00 |
6.644.000,00 |
10.036.000,00 |
|
|
4. Finished goods:
12240 |
4.000,00 |
0,00 |
11.000,00 |
11.000,00 |
59.000,00 |
|
|
a) Of long-term
production cycle : 12241 |
0,00 |
0,00 |
0,00 |
0,00 |
0,00 |
|
|
b) Of
short-term production cycle : 12242 |
4.000,00 |
0,00 |
11.000,00 |
11.000,00 |
59.000,00 |
|
|
5. By-products, residues and
recycled materials: 12250 |
0,00 |
0,00 |
0,00 |
0,00 |
0,00 |
|
|
6. Advances to suppliers:
12260 |
0,00 |
0,00 |
0,00 |
0,00 |
0,00 |
|
|
III. Trade debtors and others receivable
accounts: 12300 |
284.385.000,00 |
293.443.000,00 |
267.130.000,00 |
205.427.000,00 |
187.927.304,00 |
|
|
1. Trade debtors / accounts
receivable: 12310 |
177.150.000,00 |
173.349.000,00 |
182.752.000,00 |
134.605.000,00 |
129.975.000,00 |
|
|
a) Long-term
receivables from sales and services supplied : 12311 |
0,00 |
0,00 |
0,00 |
0,00 |
0,00 |
|
|
b)
Customers for sales and provisions of services : 12312 |
177.150.000,00 |
173.349.000,00 |
182.752.000,00 |
134.605.000,00 |
129.975.000,00 |
|
|
2. Customers, Group
companies and associates : 12320 |
76.477.000,00 |
102.792.000,00 |
68.298.000,00 |
65.859.000,00 |
55.199.000,00 |
|
|
3. Other accounts
receivable: 12330 |
10.865.000,00 |
7.505.000,00 |
5.258.000,00 |
3.098.000,00 |
2.633.000,00 |
|
|
4. Personnel: 12340 |
18.000,00 |
232.000,00 |
148.000,00 |
72.000,00 |
61.000,00 |
|
|
5. Assets for deferred tax:
12350 |
0,00 |
0,00 |
0,00 |
0,00 |
0,00 |
|
|
6. Other debtors, including
tax and social security: 12360 |
19.875.000,00 |
9.565.000,00 |
10.674.000,00 |
1.793.000,00 |
59.304,00 |
|
|
7. Called up share capital:
12370 |
0,00 |
0,00 |
0,00 |
0,00 |
0,00 |
|
|
IV. Short-term investments in Group companies and
associates: 12400 |
141.000,00 |
83.000,00 |
0,00 |
0,00 |
41.598.000,00 |
|
|
1. Equity instruments:
12410 |
0,00 |
0,00 |
0,00 |
0,00 |
0,00 |
|
|
2. Credits to businesses:
12420 |
0,00 |
0,00 |
0,00 |
0,00 |
41.598.000,00 |
|
|
3. Debt securities:
12430 |
0,00 |
0,00 |
0,00 |
0,00 |
0,00 |
|
|
4. Derivatives : 12440 |
0,00 |
0,00 |
0,00 |
0,00 |
0,00 |
|
|
5. Other financial assets :
12450 |
141.000,00 |
83.000,00 |
0,00 |
0,00 |
0,00 |
|
|
6. Other investments:
12460 |
0,00 |
0,00 |
0,00 |
0,00 |
0,00 |
|
|
V. Short-term financial investments : 12500 |
207.595.000,00 |
136.753.000,00 |
164.398.000,00 |
176.224.000,00 |
152.318.000,00 |
|
|
1. Equity instruments:
12510 |
0,00 |
0,00 |
0,00 |
0,00 |
0,00 |
|
|
2. Credits to businesses:
12520 |
144.126.000,00 |
130.703.000,00 |
152.404.000,00 |
165.409.000,00 |
126.429.000,00 |
|
|
3. Debt securities:
12530 |
62.500.000,00 |
2.319.000,00 |
10.225.000,00 |
10.723.000,00 |
25.889.000,00 |
|
|
4. Derivatives : 12540 |
616.000,00 |
3.147.000,00 |
812.000,00 |
92.000,00 |
0,00 |
|
|
5. Other financial assets :
12550 |
353.000,00 |
584.000,00 |
957.000,00 |
0,00 |
0,00 |
|
|
6. Other investments:
12560 |
0,00 |
0,00 |
0,00 |
0,00 |
0,00 |
|
|
VI. Short-term accruals: 12600 |
14.118.000,00 |
7.052.000,00 |
6.670.000,00 |
6.193.000,00 |
5.417.000,00 |
|
|
VII. Cash and other equivalent liquid assets :
12700 |
288.645.000,00 |
548.027.000,00 |
133.006.000,00 |
142.441.000,00 |
54.011.000,00 |
|
|
1. Treasury: 12710 |
96.923.000,00 |
227.084.000,00 |
57.810.000,00 |
107.233.000,00 |
54.011.000,00 |
|
|
2. Other equivalent liquid
assets: 12720 |
191.722.000,00 |
320.943.000,00 |
75.196.000,00 |
35.208.000,00 |
0,00 |
|
|
TOTAL ASSETS (A + B) : 10000 |
2.602.215.000,00 |
2.633.954.000,00 |
2.154.336.000,00 |
2.004.841.000,00 |
1.817.163.000,00 |
|
|
|
ORIGINAL |
ORIGINAL |
ORIGINAL |
ORIGINAL |
EQUIVALENCIA |
|
|
Liabilities and Net Worth |
2012 |
2011 |
2010 |
2009 |
2008 |
|
|
A) NET WORTH: 20000 |
405.329.000,00 |
428.229.000,00 |
498.045.000,00 |
462.377.000,00 |
374.716.000,00 |
|
|
A-1) Shareholders' equity: 21000 |
405.329.000,00 |
428.229.000,00 |
498.045.000,00 |
462.377.000,00 |
374.716.000,00 |
|
|
I. Capital: 21100 |
13.000,00 |
13.000,00 |
13.000,00 |
13.000,00 |
13.000,00 |
|
|
1. Registered capital :
21110 |
13.000,00 |
13.000,00 |
13.000,00 |
13.000,00 |
13.000,00 |
|
|
2. (Uncalled capital):
21120 |
0,00 |
0,00 |
0,00 |
0,00 |
0,00 |
|
|
II. Share premium: 21200 |
31.184.000,00 |
31.184.000,00 |
31.184.000,00 |
31.184.000,00 |
31.184.000,00 |
|
|
III. Reserves: 21300 |
303.605.000,00 |
372.951.000,00 |
338.559.000,00 |
288.266.000,00 |
302.700.000,00 |
|
|
1. Legal y estatutarias: 21310 |
3.000,00 |
3.000,00 |
3.000,00 |
3.000,00 |
3.000,00 |
|
|
2. Other reserves:
21320 |
303.602.000,00 |
372.948.000,00 |
338.556.000,00 |
288.263.000,00 |
302.697.000,00 |
|
|
IV. (Common stock equity): 21400 |
0,00 |
0,00 |
0,00 |
0,00 |
0,00 |
|
|
V. Results from previous periods: 21500 |
0,00 |
0,00 |
0,00 |
0,00 |
0,00 |
|
|
1. Brought forward:
21510 |
0,00 |
0,00 |
0,00 |
0,00 |
0,00 |
|
|
2. (Negative results from
previous periods): 21520 |
0,00 |
0,00 |
0,00 |
0,00 |
0,00 |
|
|
VI. Other shareholders' contributions:
21600 |
0,00 |
0,00 |
0,00 |
0,00 |
0,00 |
|
|
VII. Result of the period: 21700 |
70.527.000,00 |
24.081.000,00 |
128.289.000,00 |
142.914.000,00 |
40.819.000,00 |
|
|
VIII. (Interim dividend): 21800 |
0,00 |
0,00 |
0,00 |
0,00 |
0,00 |
|
|
IX. Other net worth instruments: 21900 |
0,00 |
0,00 |
0,00 |
0,00 |
0,00 |
|
|
A-2) Adjustments due to changes in value:
22000 |
0,00 |
0,00 |
0,00 |
0,00 |
0,00 |
|
|
I. Financial assets held for sale: 22100 |
0,00 |
0,00 |
0,00 |
0,00 |
0,00 |
|
|
II. Hedge operations: 22200 |
0,00 |
0,00 |
0,00 |
0,00 |
0,00 |
|
|
III. Linked non-current assets and liabilities
held for sale : 22300 |
0,00 |
0,00 |
0,00 |
0,00 |
0,00 |
|
|
IV. Exchange rate difference: 22400 |
0,00 |
0,00 |
0,00 |
0,00 |
0,00 |
|
|
V. Other: 22500 |
0,00 |
0,00 |
0,00 |
0,00 |
0,00 |
|
|
A-3) Received subsidies, donations and legacies:
23000 |
0,00 |
0,00 |
0,00 |
0,00 |
0,00 |
|
|
B) NON-CURRENT LIABILITIES: 31000 |
1.612.146.000,00 |
1.525.168.000,00 |
892.160.000,00 |
980.944.000,00 |
841.233.963,00 |
|
|
I. Long-term provisions: 31100 |
2.440.000,00 |
2.298.000,00 |
2.142.000,00 |
1.943.000,00 |
2.008.000,00 |
|
|
1. Long-term employee
benefits liability: 31110 |
0,00 |
0,00 |
0,00 |
0,00 |
0,00 |
|
|
2. Environmental actions:
31120 |
0,00 |
0,00 |
0,00 |
0,00 |
0,00 |
|
|
3. Restructuring provisions:
31130 |
0,00 |
0,00 |
0,00 |
0,00 |
0,00 |
|
|
4. Other provisions:
31140 |
2.440.000,00 |
2.298.000,00 |
0,00 |
1.943.000,00 |
2.008.000,00 |
|
|
II Long-term creditors: 31200 |
753.206.000,00 |
706.029.000,00 |
649.440.000,00 |
707.566.000,00 |
790.133.000,00 |
|
|
1. Liabilities and other
securities: 31210 |
0,00 |
0,00 |
0,00 |
0,00 |
0,00 |
|
|
2. Amounts owed to credit
institutions: 31220 |
731.430.000,00 |
678.681.000,00 |
609.181.000,00 |
662.593.000,00 |
789.038.000,00 |
|
|
3. Creditors from financial
leasing: 31230 |
14.200.000,00 |
22.797.000,00 |
31.637.000,00 |
41.577.000,00 |
0,00 |
|
|
4. Derivatives : 31240 |
0,00 |
804.000,00 |
737.000,00 |
1.011.000,00 |
0,00 |
|
|
5. Other financial
liabilities : 31250 |
7.576.000,00 |
3.747.000,00 |
7.885.000,00 |
2.385.000,00 |
1.095.000,00 |
|
|
III. Long-term debts with Group companies and
associates: 31300 |
834.315.000,00 |
795.452.000,00 |
224.955.000,00 |
259.005.000,00 |
37.402.000,00 |
|
|
IV. Liabilities for deferred tax: 31400 |
22.185.000,00 |
21.389.000,00 |
15.623.000,00 |
12.430.000,00 |
11.690.963,00 |
|
|
V. Long-term accruals: 31500 |
0,00 |
0,00 |
0,00 |
0,00 |
0,00 |
|
|
VI. Non-current trade creditors : 31600 |
0,00 |
0,00 |
0,00 |
0,00 |
0,00 |
|
|
VII. Special long-term debts : 31700 |
0,00 |
0,00 |
0,00 |
0,00 |
0,00 |
|
|
C) CURRENT LIABILITIES : 32000 |
584.740.000,00 |
680.557.000,00 |
764.131.000,00 |
561.520.000,00 |
601.213.037,00 |
|
|
I. Liabilities linked to non-current assets held
for sale: 32100 |
0,00 |
0,00 |
0,00 |
0,00 |
0,00 |
|
|
II. Short-term provisions: 32200 |
0,00 |
0,00 |
0,00 |
0,00 |
0,00 |
|
|
III. Short-term creditors : 32300 |
294.041.000,00 |
412.765.000,00 |
545.793.000,00 |
434.679.000,00 |
382.952.000,00 |
|
|
1. Liabilities and other
securities: 32310 |
0,00 |
0,00 |
0,00 |
0,00 |
0,00 |
|
|
2. Amounts owed to credit
institutions: 32320 |
284.927.000,00 |
394.699.000,00 |
526.989.000,00 |
413.150.000,00 |
315.050.000,00 |
|
|
3. Creditors from financial
leasing: 32330 |
9.112.000,00 |
14.272.000,00 |
16.175.000,00 |
18.611.000,00 |
0,00 |
|
|
4. Derivatives : 32340 |
0,00 |
3.794.000,00 |
2.629.000,00 |
1.010.000,00 |
0,00 |
|
|
5. Other financial
liabilities : 32350 |
2.000,00 |
0,00 |
0,00 |
1.908.000,00 |
67.902.000,00 |
|
|
IV. Short-term debts with Group companies and
associates: 32400 |
0,00 |
0,00 |
0,00 |
0,00 |
0,00 |
|
|
V. Trade creditors and other accounts payable:
32500 |
269.084.000,00 |
260.103.000,00 |
208.911.000,00 |
118.596.000,00 |
213.046.037,00 |
|
|
1. Suppliers: 32510 |
156.588.000,00 |
177.415.000,00 |
159.107.000,00 |
92.367.000,00 |
99.259.147,00 |
|
|
a)
Long-term debts : 32511 |
0,00 |
0,00 |
0,00 |
0,00 |
0,00 |
|
|
b)
Short-term debts : 32512 |
156.588.000,00 |
177.415.000,00 |
159.107.000,00 |
92.367.000,00 |
99.259.147,00 |
|
|
2. Suppliers, Group
companies and associates: 32520 |
65.416.000,00 |
58.644.000,00 |
26.600.000,00 |
10.142.000,00 |
102.502.000,00 |
|
|
3. Other creditors:
32530 |
19.565.000,00 |
4.832.000,00 |
3.346.000,00 |
2.799.000,00 |
3.007.853,00 |
|
|
4. Personnel (remuneration
due): 32540 |
5.849.000,00 |
5.106.000,00 |
5.056.000,00 |
4.539.000,00 |
4.201.000,00 |
|
|
5. Liabilities for current
tax: 32550 |
0,00 |
0,00 |
0,00 |
0,00 |
0,00 |
|
|
6. Otras deudas con las
Administraciones Públicas. : 32560 |
21.666.000,00 |
14.106.000,00 |
14.802.000,00 |
8.749.000,00 |
4.076.037,00 |
|
|
7. Advances from clients:
32570 |
0,00 |
0,00 |
0,00 |
0,00 |
0,00 |
|
|
VI. Short-term accruals: 32600 |
21.615.000,00 |
7.689.000,00 |
9.427.000,00 |
8.245.000,00 |
5.215.000,00 |
|
|
VII. Special short-term debts : 32700 |
0,00 |
0,00 |
0,00 |
0,00 |
0,00 |
|
|
TOTAL NET WORTH AND LIABILITIES (A + B + C) : 30000 |
2.602.215.000,00 |
2.633.954.000,00 |
2.154.336.000,00 |
2.004.841.000,00 |
1.817.163.000,00 |
|
|
|
ORIGINAL |
ORIGINAL |
ORIGINAL |
ORIGINAL |
EQUIVALENCIA |
|
|
Profit and Loss |
2012 |
2011 |
2010 |
2009 |
2008 |
|
|
1. Net turnover: 40100 |
1.118.748.000,00 |
1.006.299.000,00 |
895.269.000,00 |
806.732.000,00 |
822.764.000,00 |
|
|
a) Sales: 40110 |
1.107.093.000,00 |
995.497.000,00 |
886.020.000,00 |
803.736.000,00 |
822.764.000,00 |
|
|
b) Rendering of services: 40120 |
11.655.000,00 |
10.802.000,00 |
9.249.000,00 |
2.996.000,00 |
0,00 |
|
|
2. Changes in stocks of finished goods and work in progress:
40200 |
-8.000.000,00 |
-2.721.000,00 |
8.758.000,00 |
-3.440.000,00 |
-1.582.000,00 |
|
|
3. Works carried out by the company for its assets: 40300 |
0,00 |
0,00 |
0,00 |
0,00 |
0,00 |
|
|
4. Supplies : 40400 |
-640.909.000,00 |
-602.240.000,00 |
-520.216.000,00 |
-423.569.000,00 |
-426.661.000,00 |
|
|
a) Stock consumption: 40410 |
-458.545.000,00 |
-455.458.000,00 |
-360.191.000,00 |
-328.922.000,00 |
-323.828.000,00 |
|
|
b) Consumption of raw materials and miscellaneous
consumable ones: 40420 |
-121.951.000,00 |
-90.675.000,00 |
-107.576.000,00 |
-61.007.000,00 |
-67.773.000,00 |
|
|
c) Works carried out by other companies:
40430 |
-60.413.000,00 |
-56.107.000,00 |
-52.449.000,00 |
-33.640.000,00 |
-35.060.000,00 |
|
|
d) Impairment of stock, primary material and
other supplies: 40440 |
0,00 |
0,00 |
0,00 |
0,00 |
0,00 |
|
|
5. Other operating income: 40500 |
126.847.000,00 |
131.400.000,00 |
94.890.000,00 |
80.083.000,00 |
85.361.000,00 |
|
|
a) Auxiliary income and other from current
management: 40510 |
126.847.000,00 |
131.400.000,00 |
94.669.000,00 |
80.083.000,00 |
85.361.000,00 |
|
|
b) Operation subsidies included in the
Period's result: 40520 |
0,00 |
0,00 |
221.000,00 |
0,00 |
0,00 |
|
|
6. Personnel costs: 40600 |
-136.861.000,00 |
-131.970.000,00 |
-120.262.000,00 |
-112.270.000,00 |
-116.324.000,00 |
|
|
a) Wages, salaries et al.: 40610 |
-106.134.000,00 |
-102.677.000,00 |
-92.850.000,00 |
-86.701.000,00 |
-89.353.000,00 |
|
|
b) Social security costs: 40620 |
-30.727.000,00 |
-29.293.000,00 |
-27.412.000,00 |
-25.569.000,00 |
-26.971.000,00 |
|
|
c) Provisions : 40630 |
0,00 |
0,00 |
0,00 |
0,00 |
0,00 |
|
|
7. Other operating costs: 40700 |
-333.461.000,00 |
-288.312.000,00 |
-200.272.000,00 |
-182.283.000,00 |
-186.568.000,00 |
|
|
a) External services: 40710 |
-330.496.000,00 |
-285.817.000,00 |
-190.050.000,00 |
-179.142.000,00 |
-185.213.000,00 |
|
|
b) Taxes: 40720 |
-1.915.000,00 |
-1.934.000,00 |
-1.681.000,00 |
-1.400.000,00 |
-1.355.000,00 |
|
|
c) Losses, impairments and variation in
provisions from trade operations : 40730 |
0,00 |
0,00 |
0,00 |
0,00 |
0,00 |
|
|
d) Other current management expenditure :
40740 |
-1.050.000,00 |
-561.000,00 |
-8.541.000,00 |
-1.741.000,00 |
0,00 |
|
|
8. Amortisation of fixed assets: 40800 |
-31.119.000,00 |
-29.898.000,00 |
-29.809.000,00 |
-28.750.000,00 |
-21.478.000,00 |
|
|
9. Allocation of subsidies of non-financial fixed assets and other:
40900 |
0,00 |
0,00 |
0,00 |
0,00 |
0,00 |
|
|
10. Excess provisions : 41000 |
0,00 |
0,00 |
0,00 |
0,00 |
0,00 |
|
|
11. Impairment and result of transfers of fixed assets: 41100 |
-460.000,00 |
-876.000,00 |
-11.378.000,00 |
-5.527.000,00 |
-49.596.983,00 |
|
|
a) Impairment and losses : 41110 |
0,00 |
0,00 |
-10.513.000,00 |
-17.297.000,00 |
-51.182.000,00 |
|
|
b) Results for transfers and other : 41120 |
-460.000,00 |
-876.000,00 |
-865.000,00 |
11.770.000,00 |
1.585.017,00 |
|
|
12. Negative difference in combined businesses: 41200 |
0,00 |
0,00 |
0,00 |
0,00 |
0,00 |
|
|
13. Other results : 41300 |
0,00 |
0,00 |
0,00 |
0,00 |
-1.144.000,00 |
|
|
A.1) OPERATING INCOME (1 + 2 + 3 + 4 + 5 + 6 + 7 + 8 + 9 + 10 + 11 +
12 + 13) : 49100 |
94.785.000,00 |
81.682.000,00 |
116.980.000,00 |
130.976.000,00 |
104.771.017,00 |
|
|
14. Financial income : 41400 |
11.542.000,00 |
20.035.000,00 |
17.281.000,00 |
15.894.000,00 |
28.350.000,00 |
|
|
a) Of shares in equity instruments : 41410 |
110.000,00 |
162.000,00 |
11.121.000,00 |
1.682.000,00 |
3.108.000,00 |
|
|
a 1) In Group companies and
associates: 41411 |
110.000,00 |
162.000,00 |
11.121.000,00 |
1.682.000,00 |
3.108.000,00 |
|
|
a 2) In third parties:
41412 |
0,00 |
0,00 |
0,00 |
0,00 |
0,00 |
|
|
b) From negotiable securities and other financial
instruments : 41420 |
11.432.000,00 |
19.873.000,00 |
6.160.000,00 |
14.212.000,00 |
25.242.000,00 |
|
|
b 1) From Group companies
and associates : 41421 |
238.000,00 |
886.000,00 |
725.000,00 |
1.065.000,00 |
10.409.000,00 |
|
|
b 2) From third parties :
41422 |
11.194.000,00 |
18.987.000,00 |
5.435.000,00 |
13.147.000,00 |
14.833.000,00 |
|
|
c) Allocation of financial subsidies, donations
and legacies : 41430 |
0,00 |
0,00 |
0,00 |
0,00 |
0,00 |
|
|
15. Financial expenditure: 41500 |
-47.094.000,00 |
-40.819.000,00 |
-37.723.000,00 |
-33.958.000,00 |
-69.853.000,00 |
|
|
a) Amounts owed to Group companies and associates
: 41510 |
-12.813.000,00 |
-8.548.000,00 |
-5.414.000,00 |
-5.152.000,00 |
-6.300.000,00 |
|
|
b) For debts with third parties : 41520 |
-34.281.000,00 |
-32.271.000,00 |
-32.309.000,00 |
-28.806.000,00 |
-63.553.000,00 |
|
|
c) Stock renewal : 41530 |
0,00 |
0,00 |
0,00 |
0,00 |
0,00 |
|
|
16. Changes in fair value of financial instruments : 41600 |
2.549.000,00 |
1.131.000,00 |
-708.000,00 |
6.008.000,00 |
0,00 |
|
|
a) Trading book and other : 41610 |
2.549.000,00 |
1.131.000,00 |
-708.000,00 |
6.008.000,00 |
0,00 |
|
|
b) Allocation of financial assets held for sale
to the result for the period: 41620 |
0,00 |
0,00 |
0,00 |
0,00 |
0,00 |
|
|
17. Exchange rate differences : 41700 |
1.826.000,00 |
-1.461.000,00 |
24.667.000,00 |
-8.319.000,00 |
-9.900.000,00 |
|
|
18. Impairment and result for transfers of financial instruments:
41800 |
-7.207.000,00 |
-45.201.000,00 |
10.115.000,00 |
37.000,00 |
4.983,00 |
|
|
a) Impairment and losses : 41810 |
-7.206.000,00 |
-45.201.000,00 |
0,00 |
0,00 |
0,00 |
|
|
b) Results for transfers and other : 41820 |
-1.000,00 |
0,00 |
10.115.000,00 |
37.000,00 |
4.983,00 |
|
|
19. Other financial income and expenditure: 42100 |
0,00 |
0,00 |
0,00 |
0,00 |
0,00 |
|
|
a) Incorporation of financial expenditure to
assets: 42110 |
0,00 |
0,00 |
0,00 |
0,00 |
0,00 |
|
|
b) Financial income from arrangement with
creditors: 42120 |
0,00 |
0,00 |
0,00 |
0,00 |
0,00 |
|
|
c) Other income and expenditure: 42130 |
0,00 |
0,00 |
0,00 |
0,00 |
0,00 |
|
|
A.2) FINANCIAL REVENUE (14+15+16+17+18+19) : 49200 |
-38.384.000,00 |
-66.315.000,00 |
13.632.000,00 |
-20.338.000,00 |
-51.398.017,00 |
|
|
A.3) NET RESULT BEFORE TAXES (A.1+A.2) : 49300 |
56.401.000,00 |
15.367.000,00 |
130.612.000,00 |
110.638.000,00 |
53.373.000,00 |
|
|
20. Income taxes: 41900 |
14.126.000,00 |
8.714.000,00 |
-2.323.000,00 |
32.276.000,00 |
-12.554.000,00 |
|
|
A.4) PROFIT AFTER TAXES (A.3+20) : 49400 |
70.527.000,00 |
24.081.000,00 |
128.289.000,00 |
142.914.000,00 |
40.819.000,00 |
|
|
21. Result of the year coming from interrupted operations :
42000 |
0,00 |
0,00 |
0,00 |
0,00 |
0,00 |
|
|
A.5) RESULT OF THE PERIOD (A.4+21) : 49500 |
70.527.000,00 |
24.081.000,00 |
128.289.000,00 |
142.914.000,00 |
40.819.000,00 |
|
> Normal Balance Sheet under the rules of the 1990 General
Accounting Plan (repealed since 1st January of 2008)
Information corresponding to the fiscal year
2012 2011 2010 2009 has been compiled based on the
equivalence criteria stipulated in Act JUS/206/2009. Where the provisions of
the Act did not establish relevant equivalence criteria, Axesor created such
criteria using its own methodology. To view details on the methodology 2012 2011 2010 2009
is taken from information submitted to the TRADE REGISTER.
|
|
EQUIVALENCIA |
EQUIVALENCIA |
EQUIVALENCIA |
EQUIVALENCIA |
ORIGINAL |
|
|
ASSETS |
2012 |
2011 |
2010 |
2009 |
2008 |
|
|
A) SHAREHOLDERS (PARTNERS) BY UNCALLED SUSCRIBED CAPITAL: |
0,00 |
0,00 |
0,00 |
0,00 |
0,00 |
|
|
B) FIXED ASSETS: |
1.262.287.000,00 |
1.116.899.000,00 |
1.109.553.000,00 |
1.083.824.000,00 |
1.098.939.000,00 |
|
|
I. Formation expenses: |
0,00 |
0,00 |
0,00 |
0,00 |
0,00 |
|
|
II. Intangible fixed assets: |
16.010.000,00 |
15.162.000,00 |
14.426.000,00 |
15.290.000,00 |
105.100.000,00 |
|
|
1. Research and development
costs: |
0,00 |
0,00 |
0,00 |
0,00 |
0,00 |
|
|
2. Concessions, patents,
licences, trademarks et al.: |
0,00 |
0,00 |
0,00 |
0,00 |
6.000,00 |
|
|
3. Goodwill: |
0,00 |
0,00 |
0,00 |
0,00 |
0,00 |
|
|
4. Key money paid for
premises: |
13.369.000,00 |
12.444.000,00 |
12.283.000,00 |
13.891.000,00 |
24.073.000,00 |
|
|
5. Software: |
2.641.000,00 |
2.718.000,00 |
2.143.000,00 |
1.399.000,00 |
4.309.000,00 |
|
|
6. Assets under capital
leases: |
0,00 |
0,00 |
0,00 |
0,00 |
111.982.000,00 |
|
|
7. Payments on account:
|
0,00 |
0,00 |
0,00 |
0,00 |
0,00 |
|
|
8. Provisions: |
0,00 |
0,00 |
0,00 |
0,00 |
0,00 |
|
|
9. Accumulated depreciation:
|
0,00 |
0,00 |
0,00 |
0,00 |
-35.270.000,00 |
|
|
III. Tangible fixed assets: |
104.577.000,00 |
111.965.000,00 |
124.773.000,00 |
141.543.000,00 |
76.607.000,00 |
|
|
1. Land and construction:
|
0,00 |
0,00 |
0,00 |
0,00 |
6.284.000,00 |
|
|
2. Technical installations
and machinery: |
5.981.051,00 |
6.656.370,00 |
7.398.467,00 |
8.388.190,00 |
8.752.000,00 |
|
|
3. Other installations,
tools and furniture: |
55.212.646,00 |
61.446.692,00 |
68.297.180,00 |
77.433.579,00 |
80.792.000,00 |
|
|
4. Payments on account and
tangible fixed assets under construction: |
5.427.000,00 |
1.620.000,00 |
2.126.000,00 |
2.489.000,00 |
8.131.000,00 |
|
|
5. Other tangible assets:
|
37.956.303,00 |
42.241.938,00 |
46.951.353,00 |
53.232.231,00 |
55.541.000,00 |
|
|
6. Provisions: |
0,00 |
0,00 |
0,00 |
0,00 |
0,00 |
|
|
7. Accumulated depreciation:
|
0,00 |
0,00 |
0,00 |
0,00 |
-82.893.000,00 |
|
|
IV. Financial investments: |
1.141.700.000,00 |
989.772.000,00 |
970.354.000,00 |
926.991.000,00 |
917.232.000,00 |
|
|
1. Equity investments in
group companies: |
1.098.746.000,00 |
930.961.000,00 |
923.717.000,00 |
878.576.000,00 |
1.116.842.000,00 |
|
|
2. Receivables from group
companies: |
36.336.000,00 |
52.841.000,00 |
42.274.000,00 |
43.698.000,00 |
0,00 |
|
|
3. Equity investment in
associated companies: |
0,00 |
0,00 |
0,00 |
0,00 |
0,00 |
|
|
4. Credits to associated
companies: |
0,00 |
0,00 |
0,00 |
0,00 |
0,00 |
|
|
5. Long-term securities
portfolio: |
1.750.000,00 |
1.400.000,00 |
0,00 |
0,00 |
0,00 |
|
|
6. Other receivables: |
0,00 |
25.000,00 |
100.000,00 |
476.000,00 |
32.084.000,00 |
|
|
7. Long term guarantees and deposits:
|
4.868.000,00 |
4.545.000,00 |
4.263.000,00 |
4.241.000,00 |
3.866.000,00 |
|
|
8. Provisions: |
0,00 |
0,00 |
0,00 |
0,00 |
-235.560.000,00 |
|
|
9. Long-term receivables
from public bodies: |
0,00 |
0,00 |
0,00 |
0,00 |
0,00 |
|
|
V. Own shares: |
0,00 |
0,00 |
0,00 |
0,00 |
0,00 |
|
|
VI. Long-term trade receivables: |
0,00 |
0,00 |
0,00 |
0,00 |
0,00 |
|
|
C) Deferred expenses: |
0,00 |
0,00 |
0,00 |
0,00 |
6.464.000,00 |
|
|
D) CURRENT ASSETS: |
1.339.312.000,00 |
1.513.908.000,00 |
1.043.971.000,00 |
920.842.000,00 |
718.245.000,00 |
|
|
I. Called-up share capital (not paid): |
0,00 |
0,00 |
0,00 |
0,00 |
0,00 |
|
|
II. Stocks: |
343.592.000,00 |
348.742.000,00 |
302.685.000,00 |
236.465.000,00 |
271.874.000,00 |
|
|
1. Goods for resale: |
299.257.000,00 |
309.410.000,00 |
270.755.000,00 |
219.361.000,00 |
249.686.000,00 |
|
|
2. Raw materials and other
consumables: |
19.652.000,00 |
26.639.000,00 |
16.516.000,00 |
10.449.000,00 |
12.093.000,00 |
|
|
3. Goods in process and
semifinished ones: |
24.679.000,00 |
12.693.000,00 |
15.403.000,00 |
6.644.000,00 |
10.036.000,00 |
|
|
4. Finished products: |
4.000,00 |
0,00 |
11.000,00 |
11.000,00 |
59.000,00 |
|
|
5. Byproducts, scrap and
recovered materials: |
0,00 |
0,00 |
0,00 |
0,00 |
0,00 |
|
|
6. Payments on account:
|
0,00 |
0,00 |
0,00 |
0,00 |
0,00 |
|
|
7. Provisions: |
0,00 |
0,00 |
0,00 |
0,00 |
0,00 |
|
|
III. Debtors: |
485.837.000,00 |
476.398.000,00 |
438.024.000,00 |
359.611.000,00 |
193.027.000,00 |
|
|
1. Trade debtors / accounts
receivable: |
177.150.000,00 |
173.349.000,00 |
182.752.000,00 |
134.605.000,00 |
129.975.000,00 |
|
|
2. Accounts receivable,
Group companies: |
76.477.000,00 |
102.792.000,00 |
68.298.000,00 |
65.859.000,00 |
55.199.000,00 |
|
|
3. Accounts receivable,
associated companies: |
0,00 |
0,00 |
0,00 |
0,00 |
0,00 |
|
|
4. Other debtors: |
10.865.000,00 |
7.505.000,00 |
5.258.000,00 |
3.098.000,00 |
2.633.000,00 |
|
|
5. Staff: |
18.000,00 |
232.000,00 |
148.000,00 |
72.000,00 |
61.000,00 |
|
|
6. Public bodies: |
221.327.000,00 |
192.520.000,00 |
181.568.000,00 |
155.977.000,00 |
5.159.000,00 |
|
|
7. Provisions: |
0,00 |
0,00 |
0,00 |
0,00 |
0,00 |
|
|
IV. Short-term investments: |
398.842.000,00 |
454.632.000,00 |
238.782.000,00 |
211.340.000,00 |
193.916.000,00 |
|
|
1. Equity investments in group
companies: |
0,00 |
0,00 |
0,00 |
0,00 |
0,00 |
|
|
2. Receivables from group
companies: |
0,00 |
0,00 |
0,00 |
0,00 |
41.598.000,00 |
|
|
3. Equity investment in
associated companies: |
0,00 |
0,00 |
0,00 |
0,00 |
0,00 |
|
|
4. Credits to associated
companies: |
0,00 |
0,00 |
0,00 |
0,00 |
0,00 |
|
|
5. Short term securities
portfolio: |
254.222.000,00 |
323.262.000,00 |
85.421.000,00 |
45.931.000,00 |
25.889.000,00 |
|
|
6. Other receivables: |
144.267.000,00 |
130.786.000,00 |
152.404.000,00 |
165.409.000,00 |
126.429.000,00 |
|
|
7. Shor term guarantees and
deposits: |
353.000,00 |
584.000,00 |
957.000,00 |
0,00 |
0,00 |
|
|
8. Provisions: |
0,00 |
0,00 |
0,00 |
0,00 |
0,00 |
|
|
V. Short-term treasury shares: |
0,00 |
0,00 |
0,00 |
0,00 |
0,00 |
|
|
VI. Cash at bank and in hand: |
96.923.000,00 |
227.084.000,00 |
57.810.000,00 |
107.233.000,00 |
54.011.000,00 |
|
|
VII. Prepayments and accrued income: |
14.118.000,00 |
7.052.000,00 |
6.670.000,00 |
6.193.000,00 |
5.417.000,00 |
|
|
GENERAL TOTAL (A + B + C + D): |
2.601.599.000,00 |
2.630.807.000,00 |
2.153.524.000,00 |
2.004.666.000,00 |
1.823.648.000,00 |
|
MERCANTILE REGISTRY.
|
|
EQUIVALENCIA |
EQUIVALENCIA |
EQUIVALENCIA |
EQUIVALENCIA |
ORIGINAL |
|
|
LIABILITIES |
2012 |
2011 |
2010 |
2009 |
2008 |
|
|
A) EQUITY: |
404.713.000,00 |
429.680.000,00 |
500.599.000,00 |
464.223.000,00 |
366.374.000,00 |
|
|
I. Subscribed capital: |
13.000,00 |
13.000,00 |
13.000,00 |
13.000,00 |
13.000,00 |
|
|
II. Share premium: |
31.184.000,00 |
31.184.000,00 |
31.184.000,00 |
31.184.000,00 |
31.184.000,00 |
|
|
III. Revaluation reserves: |
344.500,00 |
424.834,00 |
388.567,00 |
332.963,00 |
340.000,00 |
|
|
IV. Reserves: |
302.644.500,00 |
373.977.166,00 |
340.724.433,00 |
289.779.037,00 |
294.018.000,00 |
|
|
1. Legal reserve: |
3.000,00 |
3.000,00 |
3.000,00 |
3.000,00 |
3.000,00 |
|
|
2. Reserves for own shares:
|
0,00 |
0,00 |
0,00 |
0,00 |
0,00 |
|
|
3. Reserves for shares of
the controlling company: |
0,00 |
0,00 |
0,00 |
0,00 |
0,00 |
|
|
4. Statutory reserves:
|
0,00 |
0,00 |
0,00 |
0,00 |
0,00 |
|
|
5. Miscellaneous reserves:
|
302.641.500,00 |
373.974.166,00 |
340.721.433,00 |
289.776.037,00 |
294.015.000,00 |
|
|
Differences due to capital
adjustement to euros: |
0,00 |
0,00 |
0,00 |
0,00 |
0,00 |
|
|
V. Profit or loss brought forward: |
0,00 |
0,00 |
0,00 |
0,00 |
0,00 |
|
|
1. Retained earnings: |
0,00 |
0,00 |
0,00 |
0,00 |
0,00 |
|
|
2. Prior year losses: |
0,00 |
0,00 |
0,00 |
0,00 |
0,00 |
|
|
3. Partners'
contributions so as to compensate losses: |
0,00 |
0,00 |
0,00 |
0,00 |
0,00 |
|
|
VI. Profit or loss for the financial year: |
70.527.000,00 |
24.081.000,00 |
128.289.000,00 |
142.914.000,00 |
40.819.000,00 |
|
|
VII. Interim dividend paid: |
0,00 |
0,00 |
0,00 |
0,00 |
0,00 |
|
|
VIII. Own shares for capital reduction: |
0,00 |
0,00 |
0,00 |
0,00 |
0,00 |
|
|
B) Deferred income: |
0,00 |
0,00 |
0,00 |
0,00 |
14.806.000,00 |
|
|
1. Capital grants: |
0,00 |
0,00 |
0,00 |
0,00 |
0,00 |
|
|
2. Unrealised exchange
gains: |
0,00 |
0,00 |
0,00 |
0,00 |
12.922.000,00 |
|
|
3. Other deferred income:
|
0,00 |
0,00 |
0,00 |
0,00 |
1.884.000,00 |
|
|
4. Public revenues to
distribute in several financial years: |
0,00 |
0,00 |
0,00 |
0,00 |
0,00 |
|
|
C) PROVISIONS FOR LIABILITIES AND CHARGES: |
2.440.000,00 |
2.298.000,00 |
2.142.000,00 |
1.943.000,00 |
2.008.000,00 |
|
|
1. Provisions for pension
fund and other similar obligations: |
0,00 |
0,00 |
0,00 |
0,00 |
0,00 |
|
|
2. Provisions for taxes:
|
0,00 |
0,00 |
0,00 |
0,00 |
0,00 |
|
|
3. Other provisions: |
2.440.000,00 |
2.298.000,00 |
2.142.000,00 |
1.943.000,00 |
2.008.000,00 |
|
|
4. Reversion fund: |
0,00 |
0,00 |
0,00 |
0,00 |
0,00 |
|
|
D) LONG TERM LIABILITIES: |
1.609.706.000,00 |
1.522.066.000,00 |
889.281.000,00 |
977.990.000,00 |
833.456.000,00 |
|
|
I. Issued debentures and other marketable
securities: |
0,00 |
0,00 |
0,00 |
0,00 |
0,00 |
|
|
1. Non-convertible
debentures: |
0,00 |
0,00 |
0,00 |
0,00 |
0,00 |
|
|
2. Convertible debentures:
|
0,00 |
0,00 |
0,00 |
0,00 |
0,00 |
|
|
3. Other debt securities:
|
0,00 |
0,00 |
0,00 |
0,00 |
0,00 |
|
|
II. Amounts owed to credit institutions: |
745.630.000,00 |
701.478.000,00 |
640.818.000,00 |
704.170.000,00 |
789.038.000,00 |
|
|
1. Loans and other
liabilities: |
731.430.000,00 |
678.681.000,00 |
609.181.000,00 |
662.593.000,00 |
789.038.000,00 |
|
|
2. Long-term liabilities
from capital leases: |
14.200.000,00 |
22.797.000,00 |
31.637.000,00 |
41.577.000,00 |
0,00 |
|
|
III. Debts with companies of the group and
affiliated ones: |
834.315.000,00 |
795.452.000,00 |
224.955.000,00 |
259.005.000,00 |
37.402.000,00 |
|
|
1. Amounts owed to group
companies: |
834.315.000,00 |
795.452.000,00 |
224.955.000,00 |
259.005.000,00 |
37.402.000,00 |
|
|
2. Amounts owed to
associated companies: |
0,00 |
0,00 |
0,00 |
0,00 |
0,00 |
|
|
IV. Other creditors: |
29.761.000,00 |
25.136.000,00 |
23.508.000,00 |
14.815.000,00 |
6.995.000,00 |
|
|
1. Long-term bills of
exchange payable: |
0,00 |
0,00 |
0,00 |
0,00 |
0,00 |
|
|
2. Other creditors: |
0,00 |
0,00 |
0,00 |
0,00 |
0,00 |
|
|
3. Long term guarantees and
deposits received: |
7.576.000,00 |
3.747.000,00 |
7.885.000,00 |
2.385.000,00 |
1.095.000,00 |
|
|
4. Long term payables to
public bodies: |
22.185.000,00 |
21.389.000,00 |
15.623.000,00 |
12.430.000,00 |
5.900.000,00 |
|
|
V. Unpaid portion of equity investment: |
0,00 |
0,00 |
0,00 |
0,00 |
21.000,00 |
|
|
1. Group companies: |
0,00 |
0,00 |
0,00 |
0,00 |
21.000,00 |
|
|
2. Associated companies:
|
0,00 |
0,00 |
0,00 |
0,00 |
0,00 |
|
|
3. Third parties: |
0,00 |
0,00 |
0,00 |
0,00 |
0,00 |
|
|
VI. Long term trade creditors: |
0,00 |
0,00 |
0,00 |
0,00 |
0,00 |
|
|
E) SHORT TERM CREDITORS: |
584.740.000,00 |
676.763.000,00 |
761.502.000,00 |
560.510.000,00 |
607.004.000,00 |
|
|
I. Issued debentures and other marketable securities:
|
0,00 |
0,00 |
0,00 |
0,00 |
0,00 |
|
|
1. Non-convertible
debentures: |
0,00 |
0,00 |
0,00 |
0,00 |
0,00 |
|
|
2. Convertible debentures:
|
0,00 |
0,00 |
0,00 |
0,00 |
0,00 |
|
|
3. Other debt securities:
|
0,00 |
0,00 |
0,00 |
0,00 |
0,00 |
|
|
4. Accrued interest on
debentures and other debt securities: |
0,00 |
0,00 |
0,00 |
0,00 |
0,00 |
|
|
II. Amounts owed to credit institutions: |
294.039.000,00 |
408.971.000,00 |
543.164.000,00 |
431.761.000,00 |
315.050.000,00 |
|
|
1. Loans and other
liabilities: |
284.927.000,00 |
394.699.000,00 |
526.989.000,00 |
413.150.000,00 |
315.050.000,00 |
|
|
2. Accrued interest on
liabilities with credit institutions: |
0,00 |
0,00 |
0,00 |
0,00 |
0,00 |
|
|
3. Short-term liabilities
from capital leases: |
9.112.000,00 |
14.272.000,00 |
16.175.000,00 |
18.611.000,00 |
0,00 |
|
|
III. Short-term amounts owed to group and
associated companies: |
65.416.000,00 |
58.644.000,00 |
26.600.000,00 |
10.142.000,00 |
102.502.000,00 |
|
|
1. Amounts owed to group
companies: |
65.416.000,00 |
58.644.000,00 |
26.600.000,00 |
10.142.000,00 |
102.502.000,00 |
|
|
2. Amounts owed to
associated companies: |
0,00 |
0,00 |
0,00 |
0,00 |
0,00 |
|
|
IV. Trade creditors: |
176.153.000,00 |
182.247.000,00 |
162.453.000,00 |
95.166.000,00 |
102.267.000,00 |
|
|
1. Advanced payments from
customers: |
0,00 |
0,00 |
0,00 |
0,00 |
0,00 |
|
|
2. Amounts owed for
purchases of goods or services: |
176.153.000,00 |
182.247.000,00 |
162.453.000,00 |
95.166.000,00 |
102.267.000,00 |
|
|
3. Debts represented by
notes payable: |
0,00 |
0,00 |
0,00 |
0,00 |
0,00 |
|
|
V. Other creditors: |
27.517.000,00 |
19.212.000,00 |
19.858.000,00 |
15.196.000,00 |
81.970.000,00 |
|
|
1. Public bodies: |
21.666.000,00 |
14.106.000,00 |
14.802.000,00 |
8.749.000,00 |
9.867.000,00 |
|
|
2. Bills of exchange
payable: |
0,00 |
0,00 |
0,00 |
0,00 |
0,00 |
|
|
3. Miscellaneous debts:
|
2.000,00 |
0,00 |
0,00 |
1.908.000,00 |
67.902.000,00 |
|
|
4. Wages and salaries
payable: |
5.849.000,00 |
5.106.000,00 |
5.056.000,00 |
4.539.000,00 |
4.201.000,00 |
|
|
5. Guarantees and deposits received
at short term: |
0,00 |
0,00 |
0,00 |
0,00 |
0,00 |
|
|
VI. Provisions: |
0,00 |
0,00 |
0,00 |
0,00 |
0,00 |
|
|
VII. Prepayments and accrued income: |
21.615.000,00 |
7.689.000,00 |
9.427.000,00 |
8.245.000,00 |
5.215.000,00 |
|
|
F) SHORT-TERM PROVISIONS FOR LIABILITIES AND CHARGES: |
0,00 |
0,00 |
0,00 |
0,00 |
0,00 |
|
|
GENERAL TOTAL (A + B + C + D + E + F): |
2.601.599.000,00 |
2.630.807.000,00 |
2.153.524.000,00 |
2.004.666.000,00 |
1.823.648.000,00 |
|
MERCANTILE REGISTRY.
|
|
EQUIVALENCIA |
EQUIVALENCIA |
EQUIVALENCIA |
EQUIVALENCIA |
ORIGINAL |
|
|
DEBIT |
2012 |
2011 |
2010 |
2009 |
2008 |
|
|
A) CHARGES (A.1 to A.15): |
1.190.985.000,00 |
1.134.784.000,00 |
922.691.000,00 |
777.610.000,00 |
920.479.000,00 |
|
|
A.1. Stock reduction of both
manufactured goods and the ones in process: |
8.000.000,00 |
2.721.000,00 |
0,00 |
3.440.000,00 |
1.582.000,00 |
|
|
A.2. Supplies: |
640.909.000,00 |
602.240.000,00 |
520.216.000,00 |
423.569.000,00 |
426.661.000,00 |
|
|
a)
Stock consumption: |
458.545.000,00 |
455.458.000,00 |
360.191.000,00 |
328.922.000,00 |
323.828.000,00 |
|
|
b)
Consumption of raw materials and miscellaneous consumable ones: |
121.951.000,00 |
90.675.000,00 |
107.576.000,00 |
61.007.000,00 |
67.773.000,00 |
|
|
c)
Miscellaneous external expenditure: |
60.413.000,00 |
56.107.000,00 |
52.449.000,00 |
33.640.000,00 |
35.060.000,00 |
|
|
A.3. Staff costs: |
136.861.000,00 |
131.970.000,00 |
120.262.000,00 |
112.270.000,00 |
116.324.000,00 |
|
|
a)
Wages, salaries et al.: |
106.134.000,00 |
102.677.000,00 |
92.850.000,00 |
86.701.000,00 |
89.353.000,00 |
|
|
b)
Social security costs: |
30.727.000,00 |
29.293.000,00 |
27.412.000,00 |
25.569.000,00 |
26.971.000,00 |
|
|
A.4. Depreciation expense:
|
31.119.000,00 |
29.898.000,00 |
29.809.000,00 |
28.750.000,00 |
21.478.000,00 |
|
|
A.5. Variation of trade provisions
and losses of unrecovered receivables: |
0,00 |
0,00 |
0,00 |
0,00 |
0,00 |
|
|
a)
Stock provision variation: |
0,00 |
0,00 |
0,00 |
0,00 |
0,00 |
|
|
b) Variation
in provision and bad debt losses: |
0,00 |
0,00 |
0,00 |
0,00 |
0,00 |
|
|
c)
Variation of other trade provisions: |
0,00 |
0,00 |
0,00 |
0,00 |
0,00 |
|
|
A.6. Other operating
charges: |
333.461.000,00 |
288.312.000,00 |
200.272.000,00 |
182.283.000,00 |
186.568.000,00 |
|
|
a)
External services: |
330.496.000,00 |
285.817.000,00 |
190.050.000,00 |
179.142.000,00 |
185.213.000,00 |
|
|
b) Taxes:
|
1.915.000,00 |
1.934.000,00 |
1.681.000,00 |
1.400.000,00 |
1.355.000,00 |
|
|
c)
Other operating expenses: |
1.050.000,00 |
561.000,00 |
8.541.000,00 |
1.741.000,00 |
0,00 |
|
|
d) Allocation
to revision fund: |
0,00 |
0,00 |
0,00 |
0,00 |
0,00 |
|
|
A.I. OPERATING BENEFITS
(B.1+B.2+B.3+B.4-A.1-A.2-A.3-A.4-A.5-A.6): |
95.245.000,00 |
82.558.000,00 |
128.358.000,00 |
136.503.000,00 |
155.512.000,00 |
|
|
A.7. Financial and similar
charges: |
47.095.000,00 |
40.819.000,00 |
37.723.000,00 |
33.958.000,00 |
69.853.000,00 |
|
|
a) Due
to liabilities with companies of the group: |
12.813.000,00 |
8.548.000,00 |
5.414.000,00 |
5.152.000,00 |
6.300.000,00 |
|
|
b) Due
to liabilities with associated companies: |
0,00 |
0,00 |
0,00 |
0,00 |
0,00 |
|
|
c) Due
to other debts.: |
34.281.000,00 |
32.271.000,00 |
32.309.000,00 |
28.806.000,00 |
63.553.000,00 |
|
|
d)
Losses from financial investments: |
1.000,00 |
0,00 |
0,00 |
0,00 |
0,00 |
|
|
A.8. Changes in financial
investment provisions: |
454.670,00 |
2.852.001,00 |
708.000,00 |
0,00 |
0,00 |
|
|
A.9. Exchange losses: |
0,00 |
1.461.000,00 |
0,00 |
8.319.000,00 |
26.824.000,00 |
|
|
A.II. NET FINANCIAL INCOME
(B.5+B.6+B.7+B.8-A.7-A.8-A.9): |
0,00 |
0,00 |
13.632.000,00 |
0,00 |
0,00 |
|
|
A.III. PROFIT FROM ORDINARY ACTIVITIES
(A.I+A.II-B.I-B.II): |
63.612.330,00 |
58.591.999,00 |
141.990.000,00 |
116.165.000,00 |
104.109.000,00 |
|
|
A.10. Changes in provisions
for intangible, tangible and securities portfolio: |
6.751.330,00 |
42.348.999,00 |
10.513.000,00 |
17.297.000,00 |
51.182.000,00 |
|
|
A.11. Losses from tangible
and intangible fixed assets and securities portfolio: |
460.000,00 |
876.000,00 |
865.000,00 |
0,00 |
926.000,00 |
|
|
A.12. Losses from
transactions with own shares and debentures: |
0,00 |
0,00 |
0,00 |
0,00 |
0,00 |
|
|
A.13. Extraordinary
expenses: |
0,00 |
0,00 |
0,00 |
0,00 |
6.527.000,00 |
|
|
A.14. Expenses and losses of
former financial years: |
0,00 |
0,00 |
0,00 |
0,00 |
0,00 |
|
|
A.IV. EXTRAORDINARY PROFIT
(B.9+B.10+B.11+B.12+B.13-A.10-A.11-A.12-A.13-A.14): |
0,00 |
0,00 |
0,00 |
0,00 |
0,00 |
|
|
A.V. PROFIT BEFORE TAXES (A.III+A.IV-B.III-B.IV):
|
56.401.000,00 |
15.367.000,00 |
130.612.000,00 |
110.638.000,00 |
53.373.000,00 |
|
|
A.15. Corporation tax:
|
-14.126.000,00 |
-8.714.000,00 |
2.323.000,00 |
-32.276.000,00 |
12.554.000,00 |
|
|
A.16. Miscellaneous taxes:
|
0,00 |
0,00 |
0,00 |
0,00 |
0,00 |
|
|
A.VI. FINANCIAL YEAR RESULTS (PROFIT)
(A.V-A.15-A.16): |
70.527.000,00 |
24.081.000,00 |
128.289.000,00 |
142.914.000,00 |
40.819.000,00 |
|
MERCANTILE REGISTRY.
|
|
EQUIVALENCIA |
EQUIVALENCIA |
EQUIVALENCIA |
EQUIVALENCIA |
ORIGINAL |
|
|
CREDIT |
2012 |
2011 |
2010 |
2009 |
2008 |
|
|
B) INCOME ( B.1 to B.13): |
1.261.512.000,00 |
1.158.865.000,00 |
1.050.980.000,00 |
920.524.000,00 |
961.298.000,00 |
|
|
B.1. Net total sales: |
1.118.748.000,00 |
1.006.299.000,00 |
895.269.000,00 |
806.732.000,00 |
822.764.000,00 |
|
|
a)
Sales: |
1.107.094.346,00 |
995.498.210,00 |
886.021.077,00 |
803.736.977,00 |
822.765.000,00 |
|
|
b)
Rendering of services: |
11.655.000,00 |
10.802.000,00 |
9.249.000,00 |
2.996.000,00 |
0,00 |
|
|
Returns
and Rappel on sales: |
-1.346,00 |
-1.210,00 |
-1.077,00 |
-977,00 |
-1.000,00 |
|
|
B.2. Stock increase of
manufactured goods and products in process: |
0,00 |
0,00 |
8.758.000,00 |
0,00 |
0,00 |
|
|
B.3. Works performed by the
company for fixed assets: |
0,00 |
0,00 |
0,00 |
0,00 |
0,00 |
|
|
B.4. Miscellaneous operating
income: |
126.847.000,00 |
131.400.000,00 |
94.890.000,00 |
80.083.000,00 |
85.361.000,00 |
|
|
a)
Auxiliary income and other from current management: |
126.847.000,00 |
131.400.000,00 |
94.669.000,00 |
80.083.000,00 |
85.361.000,00 |
|
|
b)
Grants: |
0,00 |
0,00 |
221.000,00 |
0,00 |
0,00 |
|
|
c)
Liabilities and charges provisions surplus: |
0,00 |
0,00 |
0,00 |
0,00 |
0,00 |
|
|
B.I. PÉRDIDAS DE EXPLOTACIÓN
(A.1+A.2+A.3+A.4+A.5-A.6-B.1-B.2-B.3-B.4): |
0,00 |
0,00 |
0,00 |
0,00 |
0,00 |
|
|
B.5. Income from equity
investment: |
110.000,00 |
162.000,00 |
11.121.000,00 |
1.682.000,00 |
3.108.000,00 |
|
|
a) In
companies of the group: |
110.000,00 |
162.000,00 |
11.121.000,00 |
1.682.000,00 |
3.108.000,00 |
|
|
b) In
associated companies: |
0,00 |
0,00 |
0,00 |
0,00 |
0,00 |
|
|
c)
Third parties: |
0,00 |
0,00 |
0,00 |
0,00 |
0,00 |
|
|
B.6. Income from other marketable
securities and long-term receivables: |
69.029,00 |
256.973,00 |
210.277,00 |
308.890,00 |
3.019.000,00 |
|
|
a) From
companies of the group: |
69.029,00 |
256.973,00 |
210.277,00 |
308.890,00 |
3.019.000,00 |
|
|
b) From
associated companies: |
0,00 |
0,00 |
0,00 |
0,00 |
0,00 |
|
|
c) From
companies out of the group: |
0,00 |
0,00 |
0,00 |
0,00 |
0,00 |
|
|
B.7. Miscellaneous interests
or similar income: |
13.911.971,00 |
20.747.027,00 |
16.064.723,00 |
19.948.110,00 |
22.223.000,00 |
|
|
a) From
companies of the group: |
168.971,00 |
629.027,00 |
514.723,00 |
756.110,00 |
7.390.000,00 |
|
|
b) From
associated companies: |
0,00 |
0,00 |
0,00 |
0,00 |
0,00 |
|
|
c)
Miscellaneous interests: |
11.194.000,00 |
18.987.000,00 |
5.435.000,00 |
13.147.000,00 |
14.833.000,00 |
|
|
d) Profit
on financial investment: |
2.549.000,00 |
1.131.000,00 |
10.115.000,00 |
6.045.000,00 |
0,00 |
|
|
B.8. Exchange positive
differences: |
1.826.000,00 |
0,00 |
24.667.000,00 |
0,00 |
16.924.000,00 |
|
|
B.II. NEGATIVE FINANCIAL RESULTS
(A.7+A.8+A.9-B.5-B.6-B.7-B.8): |
31.632.670,00 |
23.966.001,00 |
0,00 |
20.338.000,00 |
51.403.000,00 |
|
|
B.III. LOSSES ON ORDINARY ACTIVITIES ( B.I + B.II
- A.I - A.II ): |
0,00 |
0,00 |
0,00 |
0,00 |
0,00 |
|
|
B.9.Profit on disposal of
both tangible and intangible fixed assets and securities portfolio: |
0,00 |
0,00 |
0,00 |
11.770.000,00 |
2.516.000,00 |
|
|
B.10. Profit on transactions
with own shares and debentures: |
0,00 |
0,00 |
0,00 |
0,00 |
0,00 |
|
|
B.11. Capital grants
transferred to profit and loss: |
0,00 |
0,00 |
0,00 |
0,00 |
0,00 |
|
|
B.12. Extraordinary income:
|
0,00 |
0,00 |
0,00 |
0,00 |
5.383.000,00 |
|
|
B.13. Income and profit of
former financial years: |
0,00 |
0,00 |
0,00 |
0,00 |
0,00 |
|
|
B.IV. NEGATIVE EXTRAORDINARY RESULTS
(A.10+A.11+A.12+A.13+A.14-B.9-B.10-B.11-B.12-B.13): |
7.211.330,00 |
43.224.999,00 |
11.378.000,00 |
5.527.000,00 |
50.736.000,00 |
|
|
B.V. LOSSES BEFORE TAXES (B.III+B.IV-A.III-A.IV):
|
0,00 |
0,00 |
0,00 |
0,00 |
0,00 |
|
|
B.VI. RESULT OF THE PERIOD (LOSSES)
(B.V+A.15+A.16): |
0,00 |
0,00 |
0,00 |
0,00 |
0,00 |
|
MERCANTILE REGISTRY.
CASHFLOW STATEMENT
Model: Normal
> Source of information: Data contained in this section is taken from
the information declared in the Annual Accounts submitted to the Trade
Register.
|
|
2012 |
2011 |
2010 |
2009 |
2008 |
|
|
1. Fiscal year result before taxes.: 61100 |
56.401.000,00 |
15.367.000,00 |
130.612.000,00 |
110.638.000,00 |
53.373.000,00 |
|
|
2. Results adjustments.: 61200 |
69.963.000,00 |
97.245.000,00 |
27.754.000,00 |
54.618.000,00 |
123.988.000,00 |
|
|
a) Fixed Assets Amortization (+).: 61201 |
31.119.000,00 |
29.898.000,00 |
29.809.000,00 |
28.750.000,00 |
21.478.000,00 |
|
|
b) Obsolescence Allowances (+/-). : 61202 |
7.206.000,00 |
45.201.000,00 |
10.513.000,00 |
17.297.000,00 |
0,00 |
|
|
c) Variation in Provision (+/-). : 61203 |
0,00 |
156.000,00 |
199.000,00 |
0,00 |
51.107.000,00 |
|
|
e) Results on disposal of fixed assets (+/-). :
61205 |
460.000,00 |
876.000,00 |
865.000,00 |
-11.767.000,00 |
0,00 |
|
|
f) Results on disposal of financial instruments
(+/-).: 61206 |
1.000,00 |
0,00 |
-10.115.000,00 |
-37.000,00 |
0,00 |
|
|
g) Financial income (-).: 61207 |
-11.542.000,00 |
-20.035.000,00 |
-17.281.000,00 |
-15.894.000,00 |
-45.274.000,00 |
|
|
h) Financial Expenses (+). : 61208 |
47.094.000,00 |
40.819.000,00 |
37.723.000,00 |
33.958.000,00 |
96.677.000,00 |
|
|
i) Exchange differences (+/-). : 61209 |
-1.826.000,00 |
1.461.000,00 |
-24.667.000,00 |
8.319.000,00 |
0,00 |
|
|
j) Reasonable Value Variation in Financial Instruments
(+/-).: 61210 |
-2.549.000,00 |
-1.131.000,00 |
708.000,00 |
-6.008.000,00 |
0,00 |
|
|
3. Changes in current capital equity.: 61300 |
34.575.000,00 |
-29.593.000,00 |
-6.289.000,00 |
-52.804.000,00 |
-91.599.000,00 |
|
|
a) Stock (+/-).: 61301 |
5.150.000,00 |
-46.057.000,00 |
-66.220.000,00 |
35.409.000,00 |
-2.989.000,00 |
|
|
d) Debtors and other accounts receivable (+/-). :
61302 |
9.552.000,00 |
-26.313.000,00 |
-50.861.000,00 |
-12.400.000,00 |
-4.062.000,00 |
|
|
c) Other current assets (+/-). : 61303 |
-7.124.000,00 |
-382.000,00 |
11.349.000,00 |
-776.000,00 |
-75.546.000,00 |
|
|
d) Creditors and other accounts payable (+/-). :
61304 |
16.646.000,00 |
51.192.000,00 |
98.261.000,00 |
-78.134.000,00 |
-12.665.000,00 |
|
|
e) Other current liabilities (+/-).: 61305 |
13.926.000,00 |
-1.738.000,00 |
1.182.000,00 |
0,00 |
-3.782.000,00 |
|
|
f) Other non-current assets and liabilities
(+/-).: 61306 |
-3.575.000,00 |
-6.295.000,00 |
0,00 |
3.097.000,00 |
7.445.000,00 |
|
|
4. Other cash flows for operating activities.: 61400 |
-41.540.000,00 |
-21.307.000,00 |
-33.959.000,00 |
-30.683.000,00 |
-51.403.000,00 |
|
|
a) Interest payments (-). : 61401 |
-47.094.000,00 |
-40.819.000,00 |
-37.723.000,00 |
-33.958.000,00 |
-96.677.000,00 |
|
|
c) Interest collection (+). : 61403 |
11.542.000,00 |
20.035.000,00 |
17.281.000,00 |
15.894.000,00 |
45.274.000,00 |
|
|
d) Income tax payment collection (payments)
(+/-).: 61404 |
-5.988.000,00 |
-523.000,00 |
-13.517.000,00 |
-12.554.000,00 |
0,00 |
|
|
e) Other payments (payment collection) (-/+) :
61405 |
0,00 |
0,00 |
0,00 |
-65.000,00 |
0,00 |
|
|
5. Operating activity cash flows (1 + 2 + 3 + 4) : 61500 |
119.399.000,00 |
61.712.000,00 |
118.118.000,00 |
81.769.000,00 |
34.359.000,00 |
|
|
6. Payments for investment (-).: 62100 |
-279.258.000,00 |
-47.452.000,00 |
-68.790.000,00 |
83.247.000,00 |
-103.281.000,00 |
|
|
a) Companies of the group and affiliates. :
62101 |
-175.337.000,00 |
-17.894.000,00 |
-45.561.000,00 |
113.422.000,00 |
-74.322.000,00 |
|
|
b) Intangible fixed assets. : 62102 |
-3.255.000,00 |
-3.288.000,00 |
-1.724.000,00 |
0,00 |
-18.219.000,00 |
|
|
c) Fixed assets. : 62103 |
-26.414.000,00 |
-24.663.000,00 |
-21.505.000,00 |
-30.175.000,00 |
-10.445.000,00 |
|
|
e) Other financial assets. : 62105 |
-648.000,00 |
-1.607.000,00 |
0,00 |
0,00 |
-295.000,00 |
|
|
h) Other assets. : 62108 |
-73.604.000,00 |
0,00 |
0,00 |
0,00 |
0,00 |
|
|
7. Divestment payment collection (+). : 62200 |
23.897.000,00 |
600.000,00 |
12.072.000,00 |
39.159.000,00 |
47.227.000,00 |
|
|
a) Companies of the group and affiliates. :
62201 |
16.505.000,00 |
0,00 |
0,00 |
1.386.000,00 |
0,00 |
|
|
b) Intangible fixed assets. : 62202 |
1.000,00 |
0,00 |
12.000,00 |
0,00 |
0,00 |
|
|
c) Fixed assets. : 62203 |
4.629.000,00 |
600.000,00 |
10.177.000,00 |
26.266.000,00 |
0,00 |
|
|
e) Other financial assets. : 62205 |
0,00 |
0,00 |
1.883.000,00 |
11.507.000,00 |
47.227.000,00 |
|
|
h) Other assets. : 62208 |
2.762.000,00 |
0,00 |
0,00 |
0,00 |
0,00 |
|
|
8. Investment activity cash flows (6 + 7) minus Amortization:
62300 |
-255.361.000,00 |
-46.852.000,00 |
-56.718.000,00 |
122.406.000,00 |
-77.532.000,00 |
|
|
9. Payment collection and payments for equity instruments. :
63100 |
0,00 |
0,00 |
0,00 |
0,00 |
-114.000.000,00 |
|
|
b) Amortization of assets instruments (-). :
63102 |
0,00 |
0,00 |
0,00 |
0,00 |
-114.000.000,00 |
|
|
10. Payment collection and payments for financial liabilities
instruments.: 63200 |
-29.993.000,00 |
494.058.000,00 |
21.786.000,00 |
37.605.000,00 |
170.049.000,00 |
|
|
a) Issuance : 63201 |
98.134.000,00 |
570.497.000,00 |
120.250.000,00 |
119.629.000,00 |
267.009.000,00 |
|
|
2. Debts incurred with credit institutions (+). :
63203 |
52.749.000,00 |
0,00 |
113.839.000,00 |
0,00 |
237.033.000,00 |
|
|
3. Debts incurred with companies of the group and
affiliates (+).: 63204 |
38.863.000,00 |
570.497.000,00 |
0,00 |
119.629.000,00 |
29.976.000,00 |
|
|
4. Special characteristic debts (+). :
63205 |
6.522.000,00 |
0,00 |
0,00 |
0,00 |
0,00 |
|
|
5. Other debts (+). : 63206 |
0,00 |
0,00 |
6.411.000,00 |
0,00 |
0,00 |
|
|
b) Repayment and amortization of : 63207 |
-128.127.000,00 |
-76.439.000,00 |
-98.464.000,00 |
-82.024.000,00 |
-96.960.000,00 |
|
|
2. Debts incurred with credit institutions (-).: 63209 |
-123.529.000,00 |
-73.533.000,00 |
-53.412.000,00 |
-82.024.000,00 |
-82.058.000,00 |
|
|
3. Debts incurred with companies of the group and
affiliates (-). : 63210 |
0,00 |
0,00 |
-28.171.000,00 |
0,00 |
-14.201.000,00 |
|
|
5. Other debts (-). : 63212 |
-4.598.000,00 |
-2.906.000,00 |
-16.881.000,00 |
0,00 |
-701.000,00 |
|
|
11. Payments from dividends and remunerations from other assets
instruments. : 63300 |
-93.427.000,00 |
-93.897.000,00 |
-92.621.000,00 |
-153.350.000,00 |
0,00 |
|
|
a) Dividends (-).: 63301 |
-93.427.000,00 |
-93.897.000,00 |
-92.621.000,00 |
-153.350.000,00 |
0,00 |
|
|
12. Cash flows for financing activities (9+10+11).: 63400 |
-123.420.000,00 |
400.161.000,00 |
-70.835.000,00 |
-115.745.000,00 |
56.049.000,00 |
|
|
D) EFECTO DE LAS VARIACIONES DE LOS TIPOS DE CAMBIO: 64000 |
0,00 |
0,00 |
0,00 |
0,00 |
0,00 |
|
|
E) NET INCREASE/DECREASE OF CASH OR EQUIVALENT ASSETS
(+/-5+/-8+/12+/-D) : 65000 |
-259.382.000,00 |
415.021.000,00 |
-9.435.000,00 |
88.430.000,00 |
12.876.000,00 |
|
|
Cash or equivalent assets as of beginning of the
fiscal year.: 65100 |
548.027.000,00 |
133.006.000,00 |
142.441.000,00 |
54.011.000,00 |
41.135.000,00 |
|
|
Cash or equivalent assets as of end of the fiscal
year.: 65200 |
288.645.000,00 |
548.027.000,00 |
133.006.000,00 |
142.441.000,00 |
54.011.000,00 |
|
FINANCIAL DIAGNOSIS
> Economic-Financial Comparative Analysis
Data used in the following ratios and indicators is taken from the
Annual Accounts submitted by the company to the TRADE REGISTER.
> Comparison within the Sector
|
Cash Flow |
2012 |
2011 |
Variación 2012 - 2011 |
|
|||
|
|
Empresa |
Sector |
Empresa |
Sector |
Empresa |
Sector |
|
|
Cash Flow over Sales: |
-0,23 % |
0,01 % |
0,41 % |
0,00 % |
-156,22 % |
|
|
|
EBITDA over Sales: |
11,30 % |
9,23 % |
11,18 % |
10,07 % |
1,07 % |
-8,36 % |
|
|
Cash Flow Yield: |
-0,10 % |
0,00 % |
0,16 % |
0,00 % |
-163,26 % |
|
|
|
Profitability |
2012 |
2011 |
Variación 2012 - 2011 |
|
|||
|
|
Empresa |
Sector |
Empresa |
Sector |
Empresa |
Sector |
|
|
Operating economic profitability: |
7,57 % |
5,25 % |
5,42 % |
6,93 % |
39,62 % |
-24,26 % |
|
|
Total economic profitability: |
3,98 % |
2,51 % |
2,13 % |
4,15 % |
86,45 % |
-39,50 % |
|
|
Financial profitability: |
17,40 % |
1,34 % |
5,62 % |
5,83 % |
209,42 % |
-76,94 % |
|
|
Margin: |
7,61 % |
4,84 % |
7,18 % |
6,36 % |
5,99 % |
-23,85 % |
|
|
Mark-up: |
4,53 % |
1,63 % |
1,35 % |
4,71 % |
235,23 % |
-65,38 % |
|
|
Solvency |
2012 |
2011 |
Variación 2012 - 2011 |
|
|||
|
|
Empresa |
Sector |
Empresa |
Sector |
Empresa |
Sector |
|
|
Liquidity: |
0,49 |
0,12 |
0,81 |
0,11 |
-38,70 |
9,39 |
|
|
Acid Test: |
1,34 |
0,85 |
1,44 |
0,83 |
-7,11 |
2,80 |
|
|
Working Capital / Investment: |
0,21 |
0,03 |
0,25 |
0,03 |
-14,24 |
7,31 |
|
|
Solvency: |
2,29 |
1,18 |
2,23 |
1,16 |
2,80 |
1,24 |
|
|
Indebtedness |
2012 |
2011 |
Variación 2012 - 2011 |
|
|||
|
|
Empresa |
Sector |
Empresa |
Sector |
Empresa |
Sector |
|
|
Indebtedness level: |
5,38 |
1,63 |
5,12 |
1,66 |
5,15 |
-1,71 |
|
|
Borrowing Composition: |
2,75 |
1,03 |
2,24 |
1,04 |
23,02 |
-1,03 |
|
|
Repayment Ability: |
-8,46 |
164,26 |
5,31 |
811,15 |
-259,35 |
-79,75 |
|
|
Warranty: |
1,19 |
1,62 |
1,20 |
1,61 |
-0,80 |
0,69 |
|
|
Generated resources / Total creditors: |
0,05 |
0,07 |
0,05 |
0,07 |
10,20 |
-3,99 |
|
|
Efficiency |
2012 |
2011 |
Variación 2012 - 2011 |
|
|||
|
|
Empresa |
Sector |
Empresa |
Sector |
Empresa |
Sector |
|
|
Productivity: |
1,92 |
1,72 |
1,85 |
1,75 |
3,84 |
-1,60 |
|
|
Turnover of Collection Rights : |
4,38 |
4,82 |
3,88 |
4,48 |
12,97 |
7,55 |
|
|
Turnover of Payment Entitlements: |
3,59 |
3,52 |
3,41 |
3,26 |
5,21 |
7,89 |
|
|
Stock rotation: |
3,35 |
6,61 |
3,03 |
6,04 |
10,66 |
9,48 |
|
|
Assets turnover: |
0,99 |
1,08 |
0,75 |
1,09 |
31,73 |
-0,54 |
|
|
Borrowing Cost: |
2,15 |
2,94 |
1,85 |
2,93 |
15,84 |
0,57 |
|
> Trend of indicators under the General Accounting Plan of 2007
(2012, 2011, 2010, 2009, 2008)
|
Cash Flow |
2012 |
2011 |
2010 |
2009 |
2008 |
|
|
Cash Flow over Sales: |
-0,23 % |
0,41 % |
-0,01 % |
0,11 % |
1,56 % |
|
|
EBITDA over Sales: |
11,30 % |
11,18 % |
17,67 % |
20,48 % |
21,51 % |
|
|
Cash Flow Yield: |
-0,10 % |
0,16 % |
0,00 % |
0,04 % |
0,71 % |
|
|
Profitability |
2012 |
2011 |
2010 |
2009 |
2008 |
|
|
Operating economic profitability: |
7,57 % |
5,42 % |
11,47 % |
14,53 % |
22,03 % |
|
|
Total economic profitability: |
3,98 % |
2,13 % |
7,81 % |
7,21 % |
6,78 % |
|
|
Financial profitability: |
17,40 % |
5,62 % |
25,76 % |
30,91 % |
11,14 % |
|
|
Margin: |
7,61 % |
7,18 % |
11,81 % |
14,77 % |
17,12 % |
|
|
Mark-up: |
4,53 % |
1,35 % |
13,19 % |
12,48 % |
11,46 % |
|
|
Solvency |
2012 |
2011 |
2010 |
2009 |
2008 |
|
|
Liquidity: |
0,49 |
0,81 |
0,17 |
0,25 |
0,09 |
|
|
Acid Test: |
1,34 |
1,44 |
0,74 |
0,93 |
0,73 |
|
|
Working Capital / Investment: |
0,21 |
0,25 |
0,05 |
0,10 |
0,06 |
|
|
Solvency: |
2,29 |
2,23 |
1,37 |
1,64 |
1,18 |
|
|
Indebtedness |
2012 |
2011 |
2010 |
2009 |
2008 |
|
|
Indebtedness level: |
5,38 |
5,12 |
3,31 |
3,32 |
3,76 |
|
|
Borrowing Composition: |
2,75 |
2,24 |
1,16 |
1,74 |
1,37 |
|
|
Repayment Ability: |
-8,46 |
5,31 |
-175,32 |
17,42 |
35,84 |
|
|
Warranty: |
1,19 |
1,20 |
1,30 |
1,30 |
1,26 |
|
|
Generated resources / Total creditors: |
0,05 |
0,05 |
0,09 |
0,11 |
0,04 |
|
|
Efficiency |
2012 |
2011 |
2010 |
2009 |
2008 |
|
|
Productivity: |
1,92 |
1,85 |
2,32 |
2,47 |
2,52 |
|
|
Turnover of Collection Rights : |
4,38 |
3,88 |
3,71 |
4,32 |
4,70 |
|
|
Turnover of Payment Entitlements: |
3,59 |
3,41 |
3,49 |
5,08 |
6,01 |
|
|
Stock rotation: |
3,35 |
3,03 |
2,85 |
3,17 |
2,77 |
|
|
Assets turnover: |
0,99 |
0,75 |
0,97 |
0,98 |
1,29 |
|
|
Borrowing Cost: |
2,15 |
1,85 |
2,28 |
2,20 |
4,85 |
|
COMPARATIVE SECTORIAL BALANCE
Sector-based Comparison under the rules of the New General
Accounting Plan.
|
|
Variación - |
|
|
|
Empresa |
Sector |
|
|
Variación - |
|
|
|
Empresa |
Sector |
|
|
Variación - |
|
|
|
Empresa |
Sector |
Public Tenders and Works Won
No Public Tenders assigned to the name of the company.
Detail of Subsidies appearing in
Balances Memories
|
Entity |
ORGANISMO NO ESPECIFICADO |
|
Subsidy Concept |
Subvención de capital. |
|
Status |
CONCEDIDA |
|
Amount Granted |
3.000,00 |
|
Notes |
El importe reflejado corresponde al traspasado a resultados del
ejercicio, quedando pendiente de imputación al cierre 1.000,00 euros. |
|
Entity |
ORGANISMO NO ESPECIFICADO |
|
Subsidy Concept |
Subvención de capital. |
|
Status |
CONCEDIDA |
|
Amount Granted |
5.000,00 |
|
Notes |
El importe reflejado es el imputado a resultados. |
Research Summary
Company constituted in late 1989. It is a multinational company dedicated
to the design, manufacture and marketing of clothing and accessories for women
and men. There are 3,450 employees located in charge together with the holder.
In the light of the foregoing, we consider the company apt to keep being
related to usual lending operations.
FOREIGN EXCHANGE RATES
|
Currency |
Unit
|
Indian Rupees |
|
US Dollar |
1 |
Rs.60.47 |
|
UK Pound |
1 |
Rs.100.35 |
|
Euro |
1 |
Rs.79.86 |
INFORMATION DETAILS
|
Analysis Done by
: |
SUM |
|
|
|
|
Report Prepared
by : |
SDA |
RATING EXPLANATIONS
|
RATING |
STATUS |
PROPOSED CREDIT LINE |
|
|
|
>86 |
Aaa |
Possesses an extremely sound financial base with the strongest
capability for timely payment of interest and principal sums |
Unlimited |
|
|
71-85 |
Aa |
Possesses adequate working capital. No caution needed for credit
transaction. It has above average (strong) capability for payment of interest
and principal sums |
Large |
|
|
56-70 |
A |
Financial & operational base are regarded healthy. General unfavourable
factors will not cause fatal effect. Satisfactory capability for payment of
interest and principal sums |
Fairly Large |
|
|
41-55 |
Ba |
Overall operation is considered normal. Capable to meet normal
commitments. |
Satisfactory |
|
|
26-40 |
B |
Capability to
overcome financial difficulties seems comparatively below average. |
Small |
|
|
11-25 |
Ca |
Adverse factors are apparent. Repayment of interest and principal sums
in default or expected to be in default upon maturity |
Limited with
full security |
|
|
<10 |
C |
Absolute credit risk exists. Caution needed to be exercised |
Credit not
recommended |
|
|
-- |
NB |
New Business |
-- |
|
This score serves as a reference to assess SC’s credit risk and
to set the amount of credit to be extended. It is calculated from a composite
of weighted scores obtained from each of the major sections of this report. The
assessed factors and their relative weights (as indicated through %) are as
follows:
Financial
condition (40%) Ownership
background (20%) Payment
record (10%)
Credit history
(10%) Market trend
(10%) Operational
size (10%)
This report is issued at your request without any
risk and responsibility on the part of MIRA INFORM PRIVATE LIMITED (MIPL)
or its officials.