MIRA INFORM REPORT
|
Report Date : |
03.12.2014 |
IDENTIFICATION DETAILS
|
Name : |
KHUSHBU INDUSTRIES PRIVATE LIMITED |
|
|
|
|
Registered
Office : |
Plot No. 20, 21, 22, 23, Block No. 290, At/Post Zak Vehlal Road,
Taluka Dehgam, District Gandhinagar –
382330, Gujarat |
|
|
|
|
Country : |
India |
|
|
|
|
Date of
Incorporation : |
15.09.2014 |
|
|
|
|
Com. Reg. No.: |
04-080787 |
|
|
|
|
Capital
Investment / Paid-up Capital : |
Rs. 0.100 Million |
|
|
|
|
CIN No.: [Company Identification
No.] |
U27100GJ2014PTC080787 |
|
|
|
|
TAN No.: [Tax Deduction &
Collection Account No.] |
Not Available |
|
|
|
|
PAN No.: [Permanent Account No.] |
AAFCK6404N |
|
|
|
|
Legal Form : |
Private Limited Liability Company |
|
|
|
|
Line of Business
: |
Manufacturing of Steel Wire from Steel Rods with different Gages which
are used in various industrial product and hardware items mainly in Modern
kitchen Baskets and many more. |
|
|
|
|
No. of Employees
: |
18 (3 in Office and 15 in Factory) (Approximately) |
RATING & COMMENTS
|
MIRA’s Rating : |
NB |
|
RATING |
STATUS |
PROPOSED CREDIT LINE |
|
|
- |
NB |
New Business |
- |
|
Status : |
New Business |
|
|
|
|
Payment Behaviour : |
Unknown |
|
|
|
|
Litigation : |
Clear |
|
|
|
|
Comments : |
Subject is a new company incorporated during 15th September
2014 and it is establishing itself gradually. Mr. Laxmanbhai Mangaji Patel, Director has provided general
information to us and claimed that company has started its commercial
operation from 15th November 2014. However, trade relations are improving. Business is active. Payments
are reported to be unknown. The company can be considered for business dealings on safe and
secured trade terms and conditions. |
NOTES :
Any query related to this report can be made
on e-mail : infodept@mirainform.com
while quoting report number, name and date.
ECGC Country Risk Classification List – June 1, 2014
|
Country Name |
Previous Rating (31.03.2014) |
Current Rating (01.06.2014) |
|
India |
A1 |
A1 |
|
Risk Category |
ECGC
Classification |
|
Insignificant |
A1 |
|
Low |
A2 |
|
Moderate |
B1 |
|
High |
B2 |
|
Very High |
C1 |
|
Restricted |
C2 |
|
Off-credit |
D |
INDIAN ECONOMIC OVERVIEW
N E W S
Verdict Implications
: Apex court order may alter coal import dynamics. Traders go slow on talks
over coal supply contracts, uncertainty over cancellation of blocks weigh on
stocks.
Recent arrest of the
Chennai head of the Registrar of Companies, the ministry of corporate affairs
arm that ensures that companies file all the information required by the
Companies Act is the latest manifestation of a messy fight between a father and
his adopted son for the control of Rs 40000 mn business empire. The Central Bureau
of Investigation arrested Manumeethi Cholan after he accepted Rs 10 lakhs as
bribe from M A M Ramaswamy, a CBI official said.
Central Bureau of
Investigation books Electrotherm for cheating Central Bank of Rs 4360 mn.
Infosys maintains
revenue guidance. COO Rao says attrition still an area of concern and it would
take a few more quarters to bring down levels to 13-15 %.
DHL to invest Euro
100 mn in India over next 2 years. The firm has chosen India to pilot its
e-commerce business model for the Asia-Pacific region.
Blackstone may buy
stake in BlueRidge SEZ in line with the fund’s real estate strategy in India.
Kingfisher Airlines
Ltd grounded in October 2012 under the weight of heavy debt and accumulated losses,
recently approached the Delhi high court for relief in two separate cases. The
airline challenged a notice by Punjab & National Bank alleging that it had
willfully defaulted on Rs 7700 mn of loans and sought more time to comply with
the requirements under the listing agreements with the Stock Exchanges.
OnMobile likely to
sack another 300 employees. The lay-offs follow a spate of senior-level exits
over the past two years, starting with of its founder. The overall lay-offs
could number around 600 and are driven by the need to cut costs, says a former
employee.
EXTERNAL AGENCY RATING
NOT AVAILABLE
RBI DEFAULTERS’ LIST STATUS
Subject’s name is not enlisted as a defaulter
in the publicly available RBI Defaulters’ list.
EPF (Employee Provident Fund) DEFAULTERS’ LIST STATUS
Subject’s name is not enlisted as a defaulter
in the publicly available EPF (Employee Provident Fund) Defaulters’ list as of
31-03-2014.
INFORMATION PARTED BY
|
Name : |
Mr. Laxmanbhai Mangaji Patel |
|
Designation : |
Director |
|
Contact No.: |
91-9825328871 |
|
Date : |
01.12.2014 |
LOCATIONS
|
Registered Office/ Factory : |
Plot No. 20, 21, 22, 23, Block No. 290, At/Post Zak Vehlal Road,
Taluka Dehgam, District Gandhinagar –
382330, Gujarat, India |
|
Tel. No.: |
91-79-22772030/ 30417514 |
|
Mobile No.: |
91-9825328871 [Mr. Laxmanbhai Mangaji Patel] |
|
Fax No.: |
Not Available |
|
E-Mail : |
|
|
Area : |
4700 Sq. Yards [Approx.] |
|
Location : |
Owned |
NOTE:
The factory Shed in Plot No. 22 and 23 is
owned by Mr. Laxmanbhai Mangaji Patel Director of the Company and Open Land of Plot
No. 20 and 21 is owned by Mrs. Bhaviben Laxmanbhai Patel and all
manufacturing activities are carried on the same.
DIRECTORS
AS ON 23.08.2014
|
Name : |
Mr. Laxmanbhai Mangaji Patel |
|
Designation : |
Director |
|
Address : |
A-43, Keshavpark Society, Vastaral, Ahmedabad - 382418, Gujarat, India |
|
Date of Birth/Age : |
01.06.1975 |
|
Qualification : |
SSC |
|
Experience : |
15 Years Mr. Laxmanbhai is in the same line of activity since 1998. He is having good reputation in steel wire industry in Rakhial area, Ahmedabad. His trading Firm Laxmi Metal is situated in Rakhial, and famous for all grades of s.s. wire in Ahmedabad. He has wide range of market in the Particular industry. |
|
Date of Appointment : |
15.09.2014 |
|
PAN No.: |
AHJPP0643G |
|
Passport No.: |
J3645882 |
|
Voter ID No.: |
AGN1460773 |
|
Brief History : |
Mr. Laxmanbhai Mangaji Patel is the sole Proprietor of Laxmi Metal and Partner in Khushbu Enterprise. He started his trading Business carrier in the year 1998 in the rented premises. Up till now, he just runs his business as trading concern. Since the growth is right of every human being, he started his manufacturing activity by which he produces Different grads of stainless steel wire (which he usually trades) from stainless steel roads for which required land, building, machinery etc. has already been purchased by him. And want to start its production in larger scale to achieve maximum profit from its investments. Mr. Laxmanbhai is having sound knowledge in stainless steel wire industry and understand the business well. His Laxmi Metal shop in the Rakhial steel market is famous in Ahmedabad. His last ten years growth advocates him as successful businessman as he acquired approx. 2.75 crores property without any bank finance. His trading business is mainly on cash basis. Moreover strong dedication or growth of business. Focus in the same line of business activity is more important for him to achieve his target. In consideration of above facts, he opened new company named "KHUSHBU INDUSTRIES PRIVATE LIMITED" in which he is the Director of the company for conducting his manufacturing activity. |
|
DIN No.: |
06905372 |
|
|
|
|
Name : |
Mrs. Bhaviben Laxmanbhai Patel |
|
Designation : |
Director |
|
Address : |
A-43, Keshavpark Society, Vastaral, Ahmedabad - 382418, Gujarat, India |
|
Date of Birth/Age : |
14.06.1980 |
|
Qualification : |
8th Std. |
|
Experience : |
2 Years Mrs. Bhaviben is the partner in Khushbu Enterprise trading Firm of the Directors. She is Mainly taken care of Financial Part of the Company. |
|
Date of Appointment : |
15.09.2014 |
|
PAN No.: |
BAKPP2226C |
|
Voter ID No.: |
AGN1460781 |
|
Brief History : |
Mrs. Bhaviben Laxmanbhai Patel is the wife of Laxmanbhai Patel. She is one of the partners of Khushbu Enterprise. She is mainly taken care of the financial part of the business. In consideration of above facts, he opened new company named “KHUSHBU INDUSTRIES PRIVATE LIMITED" in which she is conducting his manufacturing activity. Thus, "KHUSHBU INDUSTRIES PRIVATE LIMITED" proposed to seek Cash Credit of '25.000 Millions from Bank, Out of which the Director of the Company is ready to Mortgage Plot No. 20, 21, 22, 23 in the favor of Bank having total area 4600 sq. yards (Approx.)* Rs. 6000 per Sq yards = 27.500 Millions in total value of Plot in addition with the construction cost incurred in Plot No. 22, 23 which is also estimated around 2.000 Millions in total 29.500 Millions value of Property. |
|
DIN No.: |
06911675 |
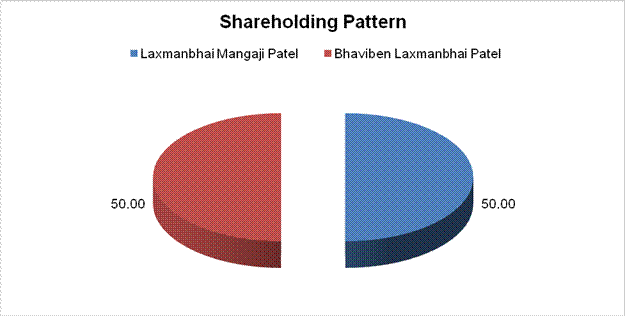
MAJOR SHAREHOLDERS / SHAREHOLDING PATTERN
AS ON 23.08.2014
|
Names of Shareholders |
No. of Shares |
Percentage of Holding |
|
Laxmanbhai Mangaji Patel |
5000 |
50.00 |
|
Bhaviben Laxmanbhai Patel |
5000 |
50.00 |
|
|
|
|
|
Total |
10000 |
100.00 |
BUSINESS DETAILS
|
Line of Business : |
Manufacturing of Steel Wire from Steel Rods with different Gages which
are used in various industrial product and hardware items mainly in Modern
kitchen Baskets and many more. |
|
|
|
|
Brand Names : |
Not Available |
|
|
|
|
Agencies Held : |
Not Available |
|
|
|
|
Exports : |
Not Available |
|
|
|
|
Imports : |
Not Available |
|
|
|
|
Terms : |
|
|
Selling : |
Credit [45 Days] |
|
|
|
|
Purchasing : |
Cash |
PRODUCTION STATUS: NOT AVAILABLE
GENERAL INFORMATION
|
Suppliers : |
|
||||||||||||||||||||||
|
|
|
||||||||||||||||||||||
|
Customers : |
Wholesalers [However retail Counter may be opened by company.]
|
||||||||||||||||||||||
|
|
|
||||||||||||||||||||||
|
No. of Employees : |
18 (3 in Office and 15 in Factory) (Approximately) |
||||||||||||||||||||||
|
|
|
||||||||||||||||||||||
|
Bankers : |
|
||||||||||||||||||||||
|
|
|
||||||||||||||||||||||
|
Facilities : |
-- |
||||||||||||||||||||||
|
|
|
|
Banking
Relations : |
-- |
|
|
|
|
Auditors : |
Not Available |
|
|
|
|
Associates/Subsidiaries : |
Not Available |
CAPITAL STRUCTURE
Authorised Capital :
|
No. of Shares |
Type |
Value |
Amount |
|
|
|
|
|
|
10000 |
Equity Shares |
Rs. 10/- each |
Rs. 0.100 Million |
|
|
|
|
|
Issued, Subscribed & Paid-up Capital :
|
No. of Shares |
Type |
Value |
Amount |
|
|
|
|
|
|
10000 |
Equity Shares |
Rs. 10/- each |
Rs. 0.100 Million |
|
|
|
|
|
FINANCIAL DATA
[all figures are
in Rupees Millions]
NEW BUSINESS
LOCAL AGENCY FURTHER INFORMATION
|
Sr. No. |
Check List by Info Agents |
Available in
Report (Yes / No) |
|
1] |
Year of Establishment |
Yes |
|
2] |
Locality of the firm |
Yes |
|
3] |
Constitutions of the firm |
Yes |
|
4] |
Premises details |
Yes |
|
5] |
Type of Business |
Yes |
|
6] |
Line of Business |
Yes |
|
7] |
Promoter's background |
Yes |
|
8] |
No. of employees |
Yes |
|
9] |
Name of person contacted |
Yes |
|
10] |
Designation of contact
person |
Yes |
|
11] |
Turnover of firm for last
three years |
No |
|
12] |
Profitability for last
three years |
No |
|
13] |
Reasons for variation
<> 20% |
-- |
|
14] |
Estimation for coming
financial year |
Yes |
|
15] |
Capital in the business |
Yes |
|
16] |
Details of sister
concerns |
No |
|
17] |
Major suppliers |
No |
|
18] |
Major customers |
No |
|
19] |
Payments terms |
Yes |
|
20] |
Export / Import details (if
applicable) |
No |
|
21] |
Market information |
-- |
|
22] |
Litigations that the firm
/ promoter involved in |
-- |
|
23] |
Banking Details |
No |
|
24] |
Banking facility details |
No |
|
25] |
Conduct of the banking
account |
-- |
|
26] |
Buyer visit details |
-- |
|
27] |
Financials, if provided |
No |
|
28] |
Incorporation details, if
applicable |
Yes |
|
29] |
Last accounts filed at
ROC |
No |
|
30] |
Major Shareholders, if
available |
Yes |
|
31] |
Date of Birth of Proprietor/Partner/Director,
if available |
Yes |
|
32] |
PAN of
Proprietor/Partner/Director, if available |
Yes |
|
33] |
Voter ID No of
Proprietor/Partner/Director, if available |
Yes |
|
34] |
External Agency Rating,
if available |
No |
------------------------------------------------------------------------------------------------------------------------------
COMPUTATION OF TOTAL
INCOME
MR. LAXMANBHAI MANGAJI
PATEL
[PROP. OF LAXMI METAL
CORPORATION]
[RS.
IN MILLIONS]
|
PARTICULARS |
2011-2012 |
||||||||||||||||||||||||||||||||||||||||||
|
|
|
|
|
||||||||||||||||||||||||||||||||||||||||
|
INCOME FROM
BUSINESS OR PROFESSIONS |
|
|
|
||||||||||||||||||||||||||||||||||||||||
|
1. Prop. of Laxmi Metal Corporation |
|
0.230 |
|
||||||||||||||||||||||||||||||||||||||||
|
|
|
|
|
||||||||||||||||||||||||||||||||||||||||
|
Net Profit / (Loss) as per
Profit and Loss Account |
|
|
|
||||||||||||||||||||||||||||||||||||||||
|
|
|
|
|
||||||||||||||||||||||||||||||||||||||||
|
Add: Depreciation as per book |
0.010 |
0.010 |
|
||||||||||||||||||||||||||||||||||||||||
|
|
|
|
|
||||||||||||||||||||||||||||||||||||||||
|
Less: Depreciation as per rules
|
0.010 |
0.010 |
|
||||||||||||||||||||||||||||||||||||||||
|
|
|
|
|
||||||||||||||||||||||||||||||||||||||||
|
Total |
|
0.230 |
|
||||||||||||||||||||||||||||||||||||||||
|
|
|
|
|
||||||||||||||||||||||||||||||||||||||||
|
2. Income received from Partnership Firms |
|
|
|
||||||||||||||||||||||||||||||||||||||||
|
|
|
|
|
||||||||||||||||||||||||||||||||||||||||
|
1. Khushbu Enterprise |
|
|
|
||||||||||||||||||||||||||||||||||||||||
|
|
|
|
|
||||||||||||||||||||||||||||||||||||||||
|
Share Income [50.00% of shares] |
0.000 |
|
|
||||||||||||||||||||||||||||||||||||||||
|
|
|
|
|
||||||||||||||||||||||||||||||||||||||||
|
Add: Interest |
0.009 |
|
|
||||||||||||||||||||||||||||||||||||||||
|
|
|
|
|
||||||||||||||||||||||||||||||||||||||||
|
Add: Salary |
0.191 |
|
|
||||||||||||||||||||||||||||||||||||||||
|
|
|
|
|
||||||||||||||||||||||||||||||||||||||||
|
Net Total Income |
|
0.200 |
|
||||||||||||||||||||||||||||||||||||||||
|
|
|
|
|
||||||||||||||||||||||||||||||||||||||||
|
Total Business Income |
|
0.430 |
|
||||||||||||||||||||||||||||||||||||||||
|
|
|
|
|
||||||||||||||||||||||||||||||||||||||||
|
Business or Profession |
|
|
0.430 |
||||||||||||||||||||||||||||||||||||||||
|
|
|
|
|
||||||||||||||||||||||||||||||||||||||||
|
GROSS TOTAL INCOME |
|
|
0.430 |
||||||||||||||||||||||||||||||||||||||||
|
|
|
|
|
||||||||||||||||||||||||||||||||||||||||
|
Deduction
[Chapter VI A] u/s 80 |
|
|
|
||||||||||||||||||||||||||||||||||||||||
|
|
||||||||||||||||||||||||||||||||||||||||||
|
|
|
|
|
||||||||||||||||||||||||||||||||||||||||
|
Deduction |
|
|
0.100 |
||||||||||||||||||||||||||||||||||||||||
|
|
|
|
|
||||||||||||||||||||||||||||||||||||||||
|
Net Income after
Deduction |
|
0.330 |
|
||||||||||||||||||||||||||||||||||||||||
|
|
|
|
|
||||||||||||||||||||||||||||||||||||||||
|
Net Income
[Rounded Off + 6] |
|
0.330 |
|
||||||||||||||||||||||||||||||||||||||||
|
|
|
|
|
||||||||||||||||||||||||||||||||||||||||
|
COMPUTATION OF TAX LIABILITY |
|||||||||||||||||||||||||||||||||||||||||||
|
Tax on taxable Income [Rs. 0.330 Million] at normal rate |
|
0.015 |
|
||||||||||||||||||||||||||||||||||||||||
|
|
|
|
|
||||||||||||||||||||||||||||||||||||||||
|
Add: Education Cess @ 2% |
|
0.001 |
|
||||||||||||||||||||||||||||||||||||||||
|
|
|
|
|
||||||||||||||||||||||||||||||||||||||||
|
Add: SHE Cess @ 1% |
|
0.000 |
|
||||||||||||||||||||||||||||||||||||||||
|
|
|
|
|
||||||||||||||||||||||||||||||||||||||||
|
Tax Liability |
|
0.016 |
|
||||||||||||||||||||||||||||||||||||||||
|
|
|
|
|
||||||||||||||||||||||||||||||||||||||||
|
Add: Interest u/s 234A |
0.002 |
|
|
||||||||||||||||||||||||||||||||||||||||
|
Interest u/s 234B |
0.003 |
|
|
||||||||||||||||||||||||||||||||||||||||
|
Interest u/s 234C |
0.000 |
|
|
||||||||||||||||||||||||||||||||||||||||
|
|
|
0.005 |
|
||||||||||||||||||||||||||||||||||||||||
|
|
|
|
|
||||||||||||||||||||||||||||||||||||||||
|
Tax with Interest |
|
0.021 |
|
||||||||||||||||||||||||||||||||||||||||
|
|
|
|
|
||||||||||||||||||||||||||||||||||||||||
|
Tax Payable
[Rounded] [+5] |
|
0.021 |
|
||||||||||||||||||||||||||||||||||||||||
|
|
|
|
|
||||||||||||||||||||||||||||||||||||||||
|
Self-Assessment Tax paid on date 28.09.2013 at State Bank of India |
|
0.021 |
|
||||||||||||||||||||||||||||||||||||||||
|
|
|
|
|
||||||||||||||||||||||||||||||||||||||||
|
Tax to Pay/
Refund |
|
|
0.000 |
||||||||||||||||||||||||||||||||||||||||
------------------------------------------------------------------------------------------------------------------------------
COMPUTATION OF TOTAL
INCOME
MRS. BHAVIBEN LAXMANBHAI
PATEL
[RS.
IN MILLIONS]
|
PARTICULARS |
2010-2011 |
||||||||||||||||||||||||||||||||||||||||||
|
|
|
|
|
||||||||||||||||||||||||||||||||||||||||
|
INCOME FROM
BUSINESS OR PROFESSIONS |
|
|
|
||||||||||||||||||||||||||||||||||||||||
|
1. Income
received from Partnership Firms |
|
|
|
||||||||||||||||||||||||||||||||||||||||
|
|
||||||||||||||||||||||||||||||||||||||||||
|
|
|
|
|
||||||||||||||||||||||||||||||||||||||||
|
Net Total Income |
|
0.487 |
|
||||||||||||||||||||||||||||||||||||||||
|
|
|
|
|
||||||||||||||||||||||||||||||||||||||||
|
Total Business Income |
|
0.487 |
|
||||||||||||||||||||||||||||||||||||||||
|
|
|
|
|
||||||||||||||||||||||||||||||||||||||||
|
Business or Profession |
|
|
0.487 |
||||||||||||||||||||||||||||||||||||||||
|
|
|
|
|
||||||||||||||||||||||||||||||||||||||||
|
GROSS TOTAL INCOME |
|
|
0.487 |
||||||||||||||||||||||||||||||||||||||||
|
|
|
|
|
||||||||||||||||||||||||||||||||||||||||
|
Deduction
[Chapter VI A] u/s 80 |
|
|
|
||||||||||||||||||||||||||||||||||||||||
|
|
||||||||||||||||||||||||||||||||||||||||||
|
|
|
|
|
||||||||||||||||||||||||||||||||||||||||
|
Deduction |
|
|
0.026 |
||||||||||||||||||||||||||||||||||||||||
|
|
|
|
|
||||||||||||||||||||||||||||||||||||||||
|
Net Income after
Deduction |
|
0.461 |
|
||||||||||||||||||||||||||||||||||||||||
|
|
|
|
|
||||||||||||||||||||||||||||||||||||||||
|
Net Income
[Rounded Off +4] |
|
0.461 |
|
||||||||||||||||||||||||||||||||||||||||
|
|
|
|
|
||||||||||||||||||||||||||||||||||||||||
|
COMPUTATION OF TAX LIABILITY |
|||||||||||||||||||||||||||||||||||||||||||
|
Tax on taxable Income [Rs. 0.461 Million] at normal rate |
|
0.027 |
|
||||||||||||||||||||||||||||||||||||||||
|
|
|
|
|
||||||||||||||||||||||||||||||||||||||||
|
Add: Education Cess @ 2% |
|
0.001 |
|
||||||||||||||||||||||||||||||||||||||||
|
|
|
|
|
||||||||||||||||||||||||||||||||||||||||
|
Add: SHE Cess @ 1% |
|
0.000 |
|
||||||||||||||||||||||||||||||||||||||||
|
|
|
|
|
||||||||||||||||||||||||||||||||||||||||
|
Tax Liability |
|
0.028 |
|
||||||||||||||||||||||||||||||||||||||||
|
|
|
|
|
||||||||||||||||||||||||||||||||||||||||
|
Add: Interest u/s 234A |
0.002 |
|
|
||||||||||||||||||||||||||||||||||||||||
|
Interest u/s 234B |
0.004 |
|
|
||||||||||||||||||||||||||||||||||||||||
|
Interest u/s 234C |
0.001 |
|
|
||||||||||||||||||||||||||||||||||||||||
|
|
|
0.007 |
|
||||||||||||||||||||||||||||||||||||||||
|
|
|
|
|
||||||||||||||||||||||||||||||||||||||||
|
Tax with Interest |
|
0.035 |
|
||||||||||||||||||||||||||||||||||||||||
|
|
|
|
|
||||||||||||||||||||||||||||||||||||||||
|
Tax Payable
[Rounded] [+5] |
|
0.035 |
|
||||||||||||||||||||||||||||||||||||||||
|
|
|
|
|
||||||||||||||||||||||||||||||||||||||||
|
Self-Assessment Tax paid on date 30.03.2012 at State Bank of India |
|
0.035 |
|
||||||||||||||||||||||||||||||||||||||||
|
|
|
|
|
||||||||||||||||||||||||||||||||||||||||
|
Tax to Pay/
Refund |
|
|
0.000 |
||||||||||||||||||||||||||||||||||||||||
------------------------------------------------------------------------------------------------------------------------------
COMPUTATION OF TOTAL
INCOME
MR. LAXMANBHAI MANGAJI
PATEL [HUF]
[PROP. OF LAXMI METAL]
[RS.
IN MILLIONS]
|
PARTICULARS |
2012-2013 |
||||||||||||||||||||||||||||||||||||||||||
|
|
|
|
|
||||||||||||||||||||||||||||||||||||||||
|
INCOME FROM
BUSINESS OR PROFESSIONS |
|
|
|
||||||||||||||||||||||||||||||||||||||||
|
1. Prop. of Laxmi Metal |
|
0.450 |
|
||||||||||||||||||||||||||||||||||||||||
|
|
|
|
|
||||||||||||||||||||||||||||||||||||||||
|
Net Profit / (Loss) as per
Profit and Loss Account |
|
|
|
||||||||||||||||||||||||||||||||||||||||
|
|
|
|
|
||||||||||||||||||||||||||||||||||||||||
|
Add: Depreciation as per book |
0.023 |
0.023 |
|
||||||||||||||||||||||||||||||||||||||||
|
|
|
|
|
||||||||||||||||||||||||||||||||||||||||
|
Less: Depreciation as per rule |
0.023 |
0.023 |
|
||||||||||||||||||||||||||||||||||||||||
|
|
|
|
|
||||||||||||||||||||||||||||||||||||||||
|
Total |
|
0.450 |
|
||||||||||||||||||||||||||||||||||||||||
|
|
|
|
|
||||||||||||||||||||||||||||||||||||||||
|
Total Business
Income |
|
0.450 |
|
||||||||||||||||||||||||||||||||||||||||
|
|
|
|
|
||||||||||||||||||||||||||||||||||||||||
|
Business or Profession |
|
|
0.450 |
||||||||||||||||||||||||||||||||||||||||
|
|
|
|
|
||||||||||||||||||||||||||||||||||||||||
|
GROSS TOTAL INCOME |
|
|
0.450 |
||||||||||||||||||||||||||||||||||||||||
|
|
|
|
|
||||||||||||||||||||||||||||||||||||||||
|
Deduction
[Chapter VI A] u/s 80 |
|
|
|
||||||||||||||||||||||||||||||||||||||||
|
|
||||||||||||||||||||||||||||||||||||||||||
|
|
|
|
|
||||||||||||||||||||||||||||||||||||||||
|
Deduction |
|
|
0.100 |
||||||||||||||||||||||||||||||||||||||||
|
|
|
|
|
||||||||||||||||||||||||||||||||||||||||
|
Net Income after
Deduction |
|
0.350 |
|
||||||||||||||||||||||||||||||||||||||||
|
|
|
|
|
||||||||||||||||||||||||||||||||||||||||
|
Net Income
[Rounded Off + 3] |
|
0.350 |
|
||||||||||||||||||||||||||||||||||||||||
|
|
|
|
|
||||||||||||||||||||||||||||||||||||||||
|
COMPUTATION OF TAX LIABILITY |
|||||||||||||||||||||||||||||||||||||||||||
|
Tax on taxable Income [Rs. 0.350 Million] at normal rate |
|
0.015 |
|
||||||||||||||||||||||||||||||||||||||||
|
|
|
|
|
||||||||||||||||||||||||||||||||||||||||
|
Add: Education Cess @ 2% |
|
0.001 |
|
||||||||||||||||||||||||||||||||||||||||
|
|
|
|
|
||||||||||||||||||||||||||||||||||||||||
|
Add: SHE Cess @ 1% |
|
0.000 |
|
||||||||||||||||||||||||||||||||||||||||
|
|
|
|
|
||||||||||||||||||||||||||||||||||||||||
|
Tax Liability |
|
0.016 |
|
||||||||||||||||||||||||||||||||||||||||
|
|
|
|
|
||||||||||||||||||||||||||||||||||||||||
|
Add: |
|
|
|
||||||||||||||||||||||||||||||||||||||||
|
Interest u/s 234B |
0.001 |
|
|
||||||||||||||||||||||||||||||||||||||||
|
Interest u/s 234C |
0.000 |
|
|
||||||||||||||||||||||||||||||||||||||||
|
|
|
0.001 |
|
||||||||||||||||||||||||||||||||||||||||
|
|
|
|
|
||||||||||||||||||||||||||||||||||||||||
|
Tax with Interest |
|
0.017 |
|
||||||||||||||||||||||||||||||||||||||||
|
|
|
|
|
||||||||||||||||||||||||||||||||||||||||
|
Tax Payable
[Rounded] [+2] |
|
0.017 |
|
||||||||||||||||||||||||||||||||||||||||
|
|
|
|
|
||||||||||||||||||||||||||||||||||||||||
|
Self-Assessment Tax paid on date 28.09.2013 at State Bank of India |
|
0.017 |
|
||||||||||||||||||||||||||||||||||||||||
|
|
|
|
|
||||||||||||||||||||||||||||||||||||||||
|
Tax to Pay/
Refund |
|
|
0.000 |
||||||||||||||||||||||||||||||||||||||||
------------------------------------------------------------------------------------------------------------------------------
CALCULATION OF INTEREST
SERVICE COVERAGE RATIO
[RS.
IN MILLIONS]
|
PARTICULARS |
2015 Estimates |
2016 Projection |
2017 Projection |
2018 Projection |
2019 Projection |
|
|
|
|
|
|
|
|
Profit after tax |
3.604 |
20.373 |
25.879 |
33.068 |
36.905 |
|
|
|
|
|
|
|
|
Depreciation |
0.750 |
0.638 |
0.542 |
0.461 |
0.392 |
|
|
|
|
|
|
|
|
Interest on Term Loan |
-- |
-- |
-- |
-- |
-- |
|
|
|
|
|
|
|
|
Interest on Working Capital |
1.750 |
3.500 |
3.500 |
3.500 |
3.500 |
|
|
|
|
|
|
|
|
TOTAL |
6.104 |
24.511 |
29.921 |
37.029 |
40.797 |
|
|
|
|
|
|
|
|
DEBT AND INTEREST TO SERVE |
|
|
|
|
|
|
Other Loan interest |
-- |
-- |
-- |
-- |
-- |
|
|
|
|
|
|
|
|
Term Loan interest |
-- |
-- |
-- |
-- |
-- |
|
|
|
|
|
|
|
|
Interest on Working Capital |
1.750 |
3.500 |
3.500 |
3.500 |
3.500 |
|
|
|
|
|
|
|
|
TOTAL |
1.750 |
3.500 |
3.500 |
3.500 |
3.500 |
|
|
|
|
|
|
|
|
ISCR |
3.49 |
7.00 |
4.73 |
10.58 |
11.66 |
|
|
|
|
|
|
|
|
Average ISCR |
38.99 |
||||
------------------------------------------------------------------------------------------------------------------------------
CALCULATION OF IRR
[RS.
IN MILLIONS]
|
PARTICULARS |
2015 Estimates |
2016 Projection |
2017 Projection |
2018 Projection |
2019 Projection |
|
|
|
|
|
|
|
|
Share Capital |
0.100 |
0.100 |
0.100 |
0.100 |
0.100 |
|
|
|
|
|
|
|
|
Securities Premium |
4.900 |
4.900 |
4.900 |
4.900 |
4.900 |
|
|
|
|
|
|
|
|
Reserves |
3.604 |
23.976 |
49.855 |
82.923 |
119.828 |
|
|
|
|
|
|
|
|
Long term loan |
4.500 |
4.500 |
4.500 |
4.500 |
4.500 |
|
|
|
|
|
|
|
|
Total Long term
Funds |
13.104 |
33.476 |
59.355 |
92.423 |
129.328 |
|
|
|
|
|
|
|
|
Intangible Assets |
-- |
-- |
-- |
-- |
-- |
|
|
|
|
|
|
|
|
Net Capital Employed |
13.104 |
33.476 |
59.355 |
92.423 |
129.328 |
|
|
|
|
|
|
|
|
Profit before Interest and Taxation |
9.965 |
37.983 |
48.451 |
61.355 |
68.408 |
|
|
|
|
|
|
|
|
IRR |
76.05% |
113.46% |
81.63% |
66.39% |
52.90% |
------------------------------------------------------------------------------------------------------------------------------
CALCULATION OF WORKING CAPITAL REQUIREMENT
[RS.
IN MILLIONS]
|
SR. NO. |
PARTICULARS |
2015 Estimates |
2016 Projection |
2017 Projection |
2018 Projection |
2019 Projection |
|
|
|
|
|
|
|
|
|
1 |
Stock in trade |
27.094 |
31.299 |
36.390 |
41.866 |
44.886 |
|
|
|
|
|
|
|
|
|
2 |
Debtors |
8.190 |
10.109 |
24.624 |
29.220 |
31.920 |
|
|
|
|
|
|
|
|
|
3 |
Net assets |
35.284 |
41.408 |
61.014 |
71.086 |
76.806 |
|
|
|
|
|
|
|
|
|
4 |
Less: Creditors |
0.000 |
0.000 |
0.000 |
0.000 |
0.000 |
|
|
|
|
|
|
|
|
|
5 |
Net Working Capital Gap |
35.284 |
41.408 |
61.014 |
71.086 |
76.806 |
|
|
|
|
|
|
|
|
|
6 |
Bank Cash Credit |
20.321 |
23.474 |
27.293 |
31.400 |
33.665 |
|
|
|
|
|
|
|
|
|
7 |
Finance against Book Debts |
4.914 |
6.065 |
14.774 |
17.532 |
19.152 |
|
|
|
|
|
|
|
|
|
8 |
Maximum permissible Finance |
25.235 |
29.540 |
42.067 |
48.932 |
52.817 |
------------------------------------------------------------------------------------------------------------------------------
PROJECTED BALANCE SHEET
[RS.
IN MILLIONS]
|
SR. NO. |
PARTICULARS |
2015 Estimates |
2016 Projection |
2017 Projection |
2018 Projection |
2019 Projection |
|
|
|
|
|
|
|
|
|
|
LIABILITIES |
|
|
|
|
|
|
1 |
Capital |
5.000 |
5.000 |
5.000 |
5.000 |
5.000 |
|
|
|
|
|
|
|
|
|
2 |
Reserves and Surplus |
3.604 |
23.976 |
49.855 |
82.923 |
119.828 |
|
|
|
|
|
|
|
|
|
3 |
Unsecured Loans |
|
|
|
|
|
|
|
- From Family Members and Relatives |
4.500 |
4.500 |
4.500 |
4.500 |
4.500 |
|
|
|
|
|
|
|
|
|
|
- From Others |
0.000 |
0.000 |
0.000 |
0.000 |
0.000 |
|
|
|
|
|
|
|
|
|
|
- Deferred Tax Liability |
0.000 |
0.000 |
0.000 |
0.000 |
0.000 |
|
|
|
|
|
|
|
|
|
4 |
Secured Loans |
|
|
|
|
|
|
|
- Term Loans |
0.000 |
0.000 |
0.000 |
0.000 |
0.000 |
|
|
|
|
|
|
|
|
|
|
- Cash Credit |
25.000 |
25.000 |
25.000 |
25.000 |
25.000 |
|
|
|
|
|
|
|
|
|
5 |
Current Liabilities |
|
|
|
|
|
|
|
Creditors |
0.000 |
0.000 |
0.000 |
0.000 |
0.000 |
|
|
|
|
|
|
|
|
|
|
Other Liabilities [Term Loan installment due within 1 year] |
0.000 |
0.000 |
0.000 |
0.000 |
0.000 |
|
|
|
|
|
|
|
|
|
6 |
Provisions |
|
|
|
|
|
|
|
Income Tax Provision |
1.611 |
9.110 |
11.572 |
14.787 |
16.503 |
|
|
|
|
|
|
|
|
|
|
TOTAL |
39.715 |
67.587 |
95.927 |
132.210 |
170.831 |
|
|
|
|
|
|
|
|
|
|
ASSETS |
|
|
|
|
|
|
1 |
Fixed Assets [Gross Block] |
5.000 |
5.000 |
5.000 |
5.000 |
5.000 |
|
|
|
|
|
|
|
|
|
|
Less: Depreciation |
0.750 |
1.388 |
1.930 |
2.391 |
2.783 |
|
|
|
|
|
|
|
|
|
|
Net Block |
4.250 |
3.612 |
3.070 |
2.609 |
2.217 |
|
|
|
|
|
|
|
|
|
2 |
Investments |
-- |
-- |
-- |
-- |
-- |
|
|
|
|
|
|
|
|
|
3 |
Current Assets |
|
|
|
|
|
|
A |
Inventory |
|
|
|
|
|
|
|
Raw Material Indigenous |
0.000 |
0.000 |
0.000 |
0.000 |
0.000 |
|
|
|
|
|
|
|
|
|
|
Raw Material Imported |
27.094 |
31.299 |
36.390 |
41.866 |
44.886 |
|
|
|
|
|
|
|
|
|
|
Finished Goods |
0.000 |
0.000 |
0.000 |
0.000 |
0.000 |
|
|
|
|
|
|
|
|
|
B |
Sundry Debtors |
8.190 |
10.109 |
24.624 |
29.220 |
31.920 |
|
|
|
|
|
|
|
|
|
C |
Other Current Assets |
0.000 |
0.000 |
0.000 |
0.000 |
0.000 |
|
|
|
|
|
|
|
|
|
D |
Cash and bank Balance |
0.181 |
22.567 |
31.843 |
58.515 |
91.808 |
|
|
|
|
|
|
|
|
|
4 |
Security Deposits with Torrent |
0.000 |
0.000 |
0.000 |
0.000 |
0.000 |
|
|
|
|
|
|
|
|
|
5 |
Other Assets, if any |
0.000 |
0.000 |
0.000 |
0.000 |
0.000 |
|
|
|
|
|
|
|
|
|
|
TOTAL |
39.715 |
67.587 |
95.927 |
132.210 |
170.831 |
|
|
|
|
|
|
|
|
|
|
Debt Equity Ratio |
1.91 |
0.75 |
0.42 |
0.27 |
0.19 |
|
|
|
|
|
|
|
|
|
|
Debt Equity Ratio with unsecured loan |
2.25 |
0.88 |
0.50 |
0.32 |
0.23 |
------------------------------------------------------------------------------------------------------------------------------
PROJECTED PROFITABILITY
STATEMENT
[RS.
IN MILLIONS]
|
PARTICULARS |
2015 Estimates |
2016 Projection |
2017 Projection |
2018 Projection |
2019 Projection |
|
|
|
|
|
|
|
|
Capacity Utilization |
70.00% |
80.00% |
90.00% |
100.00% |
100.00% |
|
|
|
|
|
|
|
|
Sales |
122.850 |
303.264 |
369.360 |
442.800 |
478.800 |
|
|
|
|
|
|
|
|
Raw Material Consumption |
133.110 |
256.320 |
307.800 |
363.600 |
387.100 |
|
|
|
|
|
|
|
|
Light/ Power |
1.958 |
4.032 |
5.184 |
6.480 |
7.020 |
|
|
|
|
|
|
|
|
Acid and other manufacturing cost |
0.391 |
0.864 |
1.134 |
1.440 |
1.620 |
|
|
|
|
|
|
|
|
Labour |
1.566 |
3.168 |
4.050 |
5.040 |
5.580 |
|
|
|
|
|
|
|
|
Administration Expenses |
1.421 |
2.736 |
4.050 |
5.400 |
6.300 |
|
|
|
|
|
|
|
|
Other Expenses |
0.783 |
1.728 |
3.240 |
4.500 |
5.400 |
|
|
|
|
|
|
|
|
Depreciation |
0.750 |
0.638 |
0.542 |
0.461 |
0.392 |
|
|
|
|
|
|
|
|
Total Cost |
139.979 |
269.486 |
326.000 |
386.921 |
413.412 |
|
|
|
|
|
|
|
|
Add: Opening Stock |
-- |
27.094 |
31.299 |
36.390 |
41.866 |
|
|
|
|
|
|
|
|
Sub-total |
139.979 |
296.580 |
357.299 |
423.311 |
455.278 |
|
|
|
|
|
|
|
|
Less: Closing Stock of raw material/WIP/ finished goods |
27.094 |
31.299 |
36.390 |
41.866 |
44.886 |
|
|
|
|
|
|
|
|
Cost of Sales |
112.885 |
265.281 |
320.909 |
381.445 |
410.392 |
|
|
|
|
|
|
|
|
Profit before Interest and Tax |
9.965 |
37.983 |
48.451 |
61.355 |
68.408 |
|
|
|
|
|
|
|
|
Interest on Term loan |
-- |
-- |
-- |
-- |
-- |
|
|
|
|
|
|
|
|
Interest on CC |
1.750 |
3.500 |
3.500 |
3.500 |
3.500 |
|
|
|
|
|
|
|
|
Profit before Directors remuneration |
8.215 |
34.483 |
44.951 |
57.855 |
64.908 |
|
|
|
|
|
|
|
|
Directors remuneration |
3.000 |
5.000 |
7.500 |
10.000 |
11.500 |
|
|
|
|
|
|
|
|
Profit before tax |
5.215 |
29.483 |
37.451 |
47.855 |
53.408 |
|
|
|
|
|
|
|
|
Current Tax |
1.611 |
9.110 |
11.572 |
14.787 |
16.503 |
|
|
|
|
|
|
|
|
Deferred tax |
-- |
-- |
-- |
-- |
-- |
|
|
|
|
|
|
|
|
Profit after Tax |
3.604 |
20.373 |
25.879 |
33.068 |
36.905 |
------------------------------------------------------------------------------------------------------------------------------
PROJECTED CASH FLOW STATEMENT
[RS.
IN MILLIONS]
|
PARTICULARS |
2015 Estimates |
2016 Projection |
2017 Projection |
2018 Projection |
2019 Projection |
|
|
|
|
|
|
|
|
Profit after Tax |
3.604 |
20.373 |
25.879 |
33.068 |
36.905 |
|
|
|
|
|
|
|
|
Provision for Depreciation |
0.750 |
0.638 |
0.542 |
0.461 |
0.392 |
|
|
|
|
|
|
|
|
Equity Share Capital |
-- |
-- |
-- |
-- |
-- |
|
|
|
|
|
|
|
|
Securities Premium |
-- |
-- |
-- |
-- |
-- |
|
|
|
|
|
|
|
|
Increase in Unsecured Loans |
-- |
-- |
-- |
-- |
-- |
|
|
|
|
|
|
|
|
Term loan |
-- |
-- |
-- |
-- |
-- |
|
|
|
|
|
|
|
|
Increase in Working Capital Loans |
25.000 |
0.000 |
0.000 |
0.000 |
0.000 |
|
|
|
|
|
|
|
|
Increase in bank LC |
-- |
-- |
-- |
-- |
-- |
|
|
|
|
|
|
|
|
Decrease in Preliminary Expenses |
-- |
-- |
-- |
-- |
-- |
|
|
|
|
|
|
|
|
Income Tax provision |
1.611 |
7.499 |
2.462 |
3.215 |
1.716 |
|
|
|
|
|
|
|
|
TOTAL |
30.965 |
28.510 |
28.883 |
36.744 |
39.013 |
|
|
|
|
|
|
|
|
Increase in fixed assets |
-- |
-- |
-- |
-- |
-- |
|
|
|
|
|
|
|
|
Decrease in term loans |
-- |
-- |
-- |
-- |
-- |
|
|
|
|
|
|
|
|
Increase in inventory |
27.094 |
4.205 |
5.091 |
5.476 |
3.020 |
|
|
|
|
|
|
|
|
Increase in debtors |
8.190 |
1.919 |
14.515 |
4.596 |
2.709 |
|
|
|
|
|
|
|
|
Income tax |
-- |
-- |
-- |
-- |
-- |
|
|
|
|
|
|
|
|
Increase in preliminary expenses |
-- |
-- |
-- |
-- |
-- |
|
|
|
|
|
|
|
|
TOTAL |
35.284 |
6.124 |
19.606 |
10.072 |
5.720 |
|
|
|
|
|
|
|
|
Opening Cash Balance |
4.500 |
0.181 |
22.567 |
31.843 |
58.515 |
|
|
|
|
|
|
|
|
Surplus/ (Deficit) |
(4.319) |
22.386 |
9.277 |
26.672 |
33.293 |
|
|
|
|
|
|
|
|
Closing Cash Balance |
0.181 |
22.567 |
31.843 |
58.515 |
91.808 |
------------------------------------------------------------------------------------------------------------------------------
CREDIT FACILITIES
[PROPOSED]
[RS.
IN MILLIONS]
|
TYPE OF FACILITIES |
AMOUNT IN MILLIONS |
PURPOSE FOR WHICH REQUIRED |
SECURITY OFFERED
|
|
|
|
|
|
PRIMARY SECURITY [DETAILS WITH APPROX. VALUE TO
BE MENTIONED] |
WHETHER COLLATERAL SECURITY OFFERED [PLEASE
MENTION YES OR NO] |
|
|
|
|
|
|
|
Cash Credit |
25.000 |
Business |
Stock, Book Debt |
Yes |
|
|
|
|
|
|
|
Term Loan |
-- |
-- |
-- |
Yes / No |
|
|
|
|
|
|
|
LC / BG |
-- |
-- |
-- |
Yes / No |
------------------------------------------------------------------------------------------------------------------------------
COLLATERAL SECURITY
OFFERED
[RS.
IN MILLIONS]
|
PARTICULARS |
AMOUNT
IN MILLIONS |
|
|
|
|
Primary Security
Stock and Book Debts created through Bank Finance |
-- |
|
|
|
|
Collateral
Security Plot No. 20, 21, 22, 23, Block No. 290, Zak, Taluka Dehgam, District Gandhinagar
is belonging to Directors of the Company and Approx. Market Value is Rs.
27.500 Millions. Directors are ready to Mortgage in the favor of Bank against
the Finance of Rs. 25.000 Millions Cash Credit as Collateral Security |
25.000 |
------------------------------------------------------------------------------------------------------------------------------
ASSESSMENT OF WORKING CAPITAL REQUIREMENTS
OPERATING STATEMENT
(RS. IN MILLIONS)
|
SR. NO. |
PARTICULARS |
2015 Estimates |
2016 Projection |
2017 Projection |
2018 Projection |
2019 Projection |
|
|
|
|
|
|
|
|
|
1 |
GROSS SALES |
|
|
|
|
|
|
|
Domestic Sales |
122.850 |
303.264 |
369.360 |
442.800 |
478.800 |
|
|
|
|
|
|
|
|
|
|
Other Sales |
0.000 |
0.000 |
0.000 |
0.000 |
0.000 |
|
|
|
|
|
|
|
|
|
|
Total Sales |
122.850 |
303.264 |
369.360 |
442.800 |
478.800 |
|
|
|
|
|
|
|
|
|
2 |
Less: Excise Duty/ Sales Tax |
0.000 |
0.000 |
0.000 |
0.000 |
0.000 |
|
|
|
|
|
|
|
|
|
3 |
NET SALES |
122.850 |
303.264 |
369.360 |
442.800 |
478.800 |
|
|
|
|
|
|
|
|
|
4 |
% age rise (+) or fall (-) |
0.00 |
146.86 |
21.79 |
19.88 |
8.13 |
|
|
|
|
|
|
|
|
|
5 |
COST OF SALES |
|
|
|
|
|
|
|
i. Raw Material [Including Store and Other] |
|
|
|
|
|
|
|
- Raw Material consumed |
133.110 |
256.320 |
307.800 |
363.600 |
387.100 |
|
|
|
|
|
|
|
|
|
|
- Manufacturing Cost |
0.391 |
0.864 |
1.134 |
1.440 |
1.620 |
|
|
|
|
|
|
|
|
|
|
ii. Consumables and Labour and Electricity etc. |
|
|
|
|
|
|
|
- Labour |
1.566 |
3.168 |
4.050 |
5.040 |
5.580 |
|
|
|
|
|
|
|
|
|
|
- Electricity Power |
1.958 |
4.032 |
5.184 |
6.480 |
7.020 |
|
|
|
|
|
|
|
|
|
|
iii. Administrative Charges |
-- |
-- |
-- |
-- |
-- |
|
|
|
|
|
|
|
|
|
|
iv. Annual Plant maintenance expenses |
-- |
-- |
-- |
-- |
-- |
|
|
|
|
|
|
|
|
|
|
v. Depreciation |
0.750 |
0.638 |
0.542 |
0.461 |
0.392 |
|
|
|
|
|
|
|
|
|
|
vi. SUB-TOTAL |
137.775 |
265.022 |
318.710 |
377.021 |
401.712 |
|
|
|
|
|
|
|
|
|
|
vii. Add: Opening Stock of WIP |
0.000 |
27.094 |
31.299 |
36.390 |
41.866 |
|
|
|
|
|
|
|
|
|
|
viii. SUB-TOTAL |
137.775 |
292.116 |
350.009 |
413.411 |
443.578 |
|
|
|
|
|
|
|
|
|
|
ix. Less: Closing Stock of WIP |
27.094 |
31.299 |
36.390 |
41.866 |
44.886 |
|
|
|
|
|
|
|
|
|
|
x. Cost of
Production |
110.681 |
260.817 |
313.619 |
371.545 |
398.692 |
|
|
|
|
|
|
|
|
|
|
xi. Add: Opening Stock of Finished Goods |
0.000 |
0.000 |
0.000 |
0.000 |
0.000 |
|
|
|
|
|
|
|
|
|
|
SUB-TOTAL [x + xi] |
110.681 |
260.817 |
313.619 |
371.545 |
398.692 |
|
|
|
|
|
|
|
|
|
|
xii. Less: Closing Stock of Finished Goods |
0.000 |
0.000 |
0.000 |
0.000 |
0.000 |
|
|
|
|
|
|
|
|
|
|
xiii. COST OF GOODS
SOLD |
110.681 |
260.817 |
313.619 |
371.545 |
398.692 |
|
|
|
|
|
|
|
|
|
|
GROSS PROFIT |
12.169 |
42.447 |
55.741 |
71.255 |
80.108 |
|
|
|
|
|
|
|
|
|
6 |
Selling, General and Administrative Expenses |
|
|
|
|
|
|
|
- Selling and Misc. Expenses |
0.783 |
1.728 |
3.240 |
4.500 |
5.400 |
|
|
|
|
|
|
|
|
|
|
- Administrative Expenses |
1.421 |
2.736 |
4.050 |
5.400 |
6.300 |
|
|
|
|
|
|
|
|
|
|
- Preliminary Expenses |
0.000 |
0.000 |
0.000 |
0.000 |
0.000 |
|
|
|
|
|
|
|
|
|
|
SUB-TOTAL |
2.204 |
4.464 |
7.290 |
9.900 |
11.700 |
|
|
|
|
|
|
|
|
|
|
SUB-TOTAL |
112.885 |
265.281 |
320.909 |
381.445 |
410.392 |
|
|
|
|
|
|
|
|
|
|
Operating Profit before interest |
9.965 |
37.983 |
48.451 |
61.355 |
68.408 |
|
|
|
|
|
|
|
|
|
7 |
Interest |
|
|
|
|
|
|
|
- To bank |
1.750 |
3.500 |
3.500 |
3.500 |
3.500 |
|
|
|
|
|
|
|
|
|
|
- On term loans |
0.000 |
0.000 |
0.000 |
0.000 |
0.000 |
|
|
|
|
|
|
|
|
|
|
- To others |
0.000 |
0.000 |
0.000 |
0.000 |
0.000 |
|
|
|
|
|
|
|
|
|
|
SUB-TOTAL |
1.750 |
3.500 |
3.500 |
3.500 |
3.500 |
|
|
|
|
|
|
|
|
|
8 |
Operating profit after interest |
8.215 |
34.483 |
44.951 |
57.855 |
64.908 |
|
|
|
|
|
|
|
|
|
9 |
Other Income/ Expenses |
|
|
|
|
|
|
|
a. Income |
0.000 |
0.000 |
0.000 |
0.000 |
0.000 |
|
|
|
|
|
|
|
|
|
|
Less: b. Expenses Directors Remuneration |
3.000 |
5.000 |
7.500 |
10.000 |
11.500 |
|
|
|
|
|
|
|
|
|
|
c. Investment Allowance |
0.000 |
0.000 |
0.000 |
0.000 |
0.000 |
|
|
|
|
|
|
|
|
|
|
Sub-total of other
income/expenses |
(3.000) |
(5.000) |
(7.500) |
(10.000) |
(11.500) |
|
|
|
|
|
|
|
|
|
10 |
Profit before Tax / Loss |
5.215 |
29.483 |
37.451 |
47.855 |
53.408 |
|
|
|
|
|
|
|
|
|
11 |
Provision for Tax |
|
|
|
|
|
|
|
Current Tax |
1.611 |
9.110 |
11.572 |
14.787 |
16.503 |
|
|
Deferred Tax |
0.000 |
0.000 |
0.000 |
0.000 |
0.000 |
|
|
|
|
|
|
|
|
|
12 |
Net Profit/ (Loss) |
3.604 |
20.373 |
25.879 |
33.068 |
36.905 |
|
|
|
|
|
|
|
|
|
13 |
Dividend / Withdrawals |
0.000 |
0.000 |
0.000 |
0.000 |
0.000 |
|
|
|
|
|
|
|
|
|
14 |
Retained Profit |
3.604 |
20.373 |
25.879 |
33.068 |
36.905 |
|
|
|
|
|
|
|
|
|
|
Retained Profit / Net Profit % |
100.00 |
100.00 |
100.00 |
100.00 |
100.00 |
|
|
|
|
|
|
|
|
|
15 |
Depreciation and IAR |
0.750 |
0.638 |
0.542 |
0.461 |
0.392 |
|
|
|
|
|
|
|
|
|
16 |
Preliminary Expenses w/o |
0.000 |
0.000 |
0.000 |
0.000 |
0.000 |
|
|
|
|
|
|
|
|
|
17 |
Cash Accruals [14 + 15 + 16] |
4.354 |
21.011 |
26.421 |
33.529 |
37.297 |
------------------------------------------------------------------------------------------------------------------------------
ANALYSIS OF BALANCE SHEET
(RS. IN MILLIONS)
|
SR. NO. |
PARTICULARS |
2015 Estimates |
2016 Projection |
2017 Projection |
2018 Projection |
2019 Projection |
|
|
|
|
|
|
|
|
|
|
CURRENT LIABILITIES |
|
|
|
|
|
|
1 |
Short
term borrowings from bank (incl. Bills purchased, discounted and excess
borrowings placed on repayment basis) |
|
|
|
|
|
|
|
(i) From applicant bank |
25.000 |
25.000 |
25.000 |
25.000 |
25.000 |
|
|
(ii)
From other banks |
-- |
-- |
-- |
-- |
-- |
|
|
(iii)
of which BP and BD |
-- |
-- |
-- |
-- |
-- |
|
|
|
|
|
|
|
|
|
|
SUB-TOTAL |
25.000 |
25.000 |
25.000 |
25.000 |
25.000 |
|
|
|
|
|
|
|
|
|
2 |
Short term borrowings from others |
|
|
|
|
|
|
|
Sundry Creditors for Capital Goods |
-- |
-- |
-- |
-- |
-- |
|
|
|
|
|
|
|
|
|
3 |
Sundry Creditors |
0.000 |
0.000 |
0.000 |
0.000 |
0.000 |
|
|
|
|
|
|
|
|
|
4 |
Advance payments from customers |
-- |
-- |
-- |
-- |
-- |
|
|
|
|
|
|
|
|
|
5 |
Provision for Taxation |
-- |
-- |
-- |
-- |
-- |
|
|
|
|
|
|
|
|
|
6 |
Dividend Payable |
-- |
-- |
-- |
-- |
-- |
|
|
|
|
|
|
|
|
|
7 |
Other Statutory Liabilities |
-- |
-- |
-- |
-- |
-- |
|
|
|
|
|
|
|
|
|
8 |
Instalments of Term Loan due within next of 12 Months |
0.000 |
0.000 |
0.000 |
0.000 |
0.000 |
|
|
|
|
|
|
|
|
|
9 |
Other
Current Liabilities and Provisions |
0.000 |
0.000 |
0.000 |
0.000 |
0.000 |
|
|
|
|
|
|
|
|
|
|
SUB-TOTAL |
0.000 |
0.000 |
0.000 |
0.000 |
0.000 |
|
|
|
|
|
|
|
|
|
10 |
TOTAL CURRENT LIABILITIES |
25.000 |
25.000 |
25.000 |
25.000 |
25.000 |
|
|
|
|
|
|
|
|
|
|
TERM LIABILITIES |
|
|
|
|
|
|
11 |
Debentures |
-- |
-- |
-- |
-- |
-- |
|
|
|
|
|
|
|
|
|
12 |
Redemption Preference Shares |
-- |
-- |
-- |
-- |
-- |
|
|
|
|
|
|
|
|
|
13 |
Term
Loans |
0.000 |
0.000 |
0.000 |
0.000 |
0.000 |
|
|
|
|
|
|
|
|
|
14 |
Car Finance |
0.000 |
0.000 |
0.000 |
0.000 |
0.000 |
|
|
|
|
|
|
|
|
|
15 |
Term
Deposits/ Unsecured Loans |
4.500 |
4.500 |
4.500 |
4.500 |
4.500 |
|
|
|
|
|
|
|
|
|
16 |
Other Term Liabilities |
0.000 |
0.000 |
0.000 |
0.000 |
0.000 |
|
|
|
|
|
|
|
|
|
17 |
TOTAL TERM LIABILITIES |
4.500 |
4.500 |
4.500 |
4.500 |
4.500 |
|
|
|
|
|
|
|
|
|
18 |
TOTAL OUTSIDE LIABILITIES |
29.500 |
29.500 |
29.500 |
29.500 |
29.500 |
|
|
|
|
|
|
|
|
|
|
NET WORTH |
|
|
|
|
|
|
19 |
Share Capital |
5.000 |
5.000 |
5.000 |
5.000 |
5.000 |
|
|
|
|
|
|
|
|
|
20 |
General Reserve |
-- |
-- |
-- |
-- |
-- |
|
|
|
|
|
|
|
|
|
21 |
Development Rebate Reserve |
-- |
-- |
-- |
-- |
-- |
|
|
|
|
|
|
|
|
|
22 |
Other Reserve Subsidy |
-- |
-- |
-- |
-- |
-- |
|
|
|
|
|
|
|
|
|
23 |
Surplus (+) or deficit (-) in Profit & Loss Account |
3.604 |
23.976 |
49.855 |
82.923 |
119.828 |
|
|
|
|
|
|
|
|
|
24 |
TOTAL NETWORTH |
8.604 |
28.976 |
54.855 |
87.923 |
124.828 |
|
|
|
|
|
|
|
|
|
25 |
TOTAL
LIABILITIES |
38.104 |
58.476 |
84.355 |
117.423 |
154.328 |
|
|
|
|
|
|
|
|
|
|
CURRENT ASSETS |
|
|
|
|
|
|
26 |
Cash
& Bank balances |
0.181 |
22.567 |
31.843 |
58.515 |
91.808 |
|
|
|
|
|
|
|
|
|
27 |
Investments |
|
|
|
|
|
|
|
a. Government and Others |
-- |
-- |
-- |
-- |
-- |
|
|
|
|
|
|
|
|
|
|
b. Fixed Deposits with banks |
-- |
-- |
-- |
-- |
-- |
|
|
|
|
|
|
|
|
|
28 |
Receivables |
|
|
|
|
|
|
|
a. Other than Exports |
8.190 |
10.109 |
24.624 |
29.220 |
31.920 |
|
|
|
|
|
|
|
|
|
|
b. Export Receivables/ Bill Discounted |
-- |
-- |
-- |
-- |
-- |
|
|
|
|
|
|
|
|
|
29 |
Installment of Deferred receivables
|
-- |
-- |
-- |
-- |
-- |
|
|
|
|
|
|
|
|
|
30 |
Inventory |
|
|
|
|
|
|
|
i. Raw materials |
|
|
|
|
|
|
|
- Imported |
0.000 |
0.000 |
0.000 |
0.000 |
0.000 |
|
|
- Indigenous |
27.094 |
31.299 |
36.390 |
41.866 |
44.886 |
|
|
|
|
|
|
|
|
|
|
ii. Finished Goods |
0.000 |
0.000 |
0.000 |
0.000 |
0.000 |
|
|
|
|
|
|
|
|
|
|
iii. Work in progress |
0.000 |
0.000 |
0.000 |
0.000 |
0.000 |
|
|
|
|
|
|
|
|
|
|
iv. Consumables Stores and Spares |
0.000 |
0.000 |
0.000 |
0.000 |
0.000 |
|
|
|
|
|
|
|
|
|
31 |
Advance to Suppliers of Raw Materials and Stores |
-- |
-- |
-- |
-- |
-- |
|
|
|
|
|
|
|
|
|
32 |
Advance payment of taxes |
-- |
-- |
-- |
-- |
-- |
|
|
|
|
|
|
|
|
|
33 |
Other Current Assets |
0.000 |
0.000 |
0.000 |
0.000 |
0.000 |
|
|
|
|
|
|
|
|
|
34 |
TOTAL CURRENT
ASSETS |
35.465 |
63.975 |
92.857 |
129.601 |
168.614 |
|
|
|
|
|
|
|
|
|
|
FIXED ASSETS |
|
|
|
|
|
|
35 |
Gross Block |
5.000 |
5.000 |
5.000 |
5.000 |
5.000 |
|
|
|
|
|
|
|
|
|
36 |
Depreciation |
0.750 |
1.388 |
1.930 |
2.391 |
2.783 |
|
|
|
|
|
|
|
|
|
37 |
NET BLOCK |
4.250 |
3.612 |
3.070 |
2.609 |
2.217 |
|
|
|
|
|
|
|
|
|
38 |
Security Deposit |
0.000 |
0.000 |
0.000 |
0.000 |
0.000 |
|
|
|
|
|
|
|
|
|
|
Advance / Deposits which are not Current Assets |
-- |
-- |
-- |
-- |
-- |
|
|
|
|
|
|
|
|
|
|
- Investment in Subsidiary Companies / Affiliates |
-- |
-- |
-- |
-- |
-- |
|
|
|
|
|
|
|
|
|
|
- Others |
0.000 |
0.000 |
0.000 |
0.000 |
0.000 |
|
|
|
|
|
|
|
|
|
|
Advance to Suppliers of Capital Goods |
-- |
-- |
-- |
-- |
-- |
|
|
|
|
|
|
|
|
|
|
Spares / Contractors for Capital |
-- |
-- |
-- |
-- |
-- |
|
|
|
|
|
|
|
|
|
|
Deferred Receivables |
-- |
-- |
-- |
-- |
-- |
|
|
|
|
|
|
|
|
|
|
Others |
-- |
-- |
-- |
-- |
-- |
|
|
|
|
|
|
|
|
|
39 |
Non-Consumable Stores and Spares |
-- |
-- |
-- |
-- |
-- |
|
|
|
|
|
|
|
|
|
40 |
Other Miscellaneous Assets including dues from Directors |
-- |
-- |
-- |
-- |
-- |
|
|
|
|
|
|
|
|
|
41 |
TOTAL OTHER
NON-CURRENT ASSETS |
0.000 |
0.000 |
0.000 |
0.000 |
0.000 |
|
|
|
|
|
|
|
|
|
42 |
Intangible Assets |
0.000 |
0.000 |
0.000 |
0.000 |
0.000 |
|
|
|
|
|
|
|
|
|
43 |
TOTAL ASSETS |
39.715 |
67.587 |
95.927 |
132.210 |
170.831 |
|
|
|
|
|
|
|
|
|
44 |
Tangible Networth |
8.604 |
28.976 |
54.855 |
87.923 |
124.828 |
|
|
|
|
|
|
|
|
|
45 |
Net Working Capital |
10.465 |
38.975 |
67.857 |
104.601 |
143.614 |
|
|
|
|
|
|
|
|
|
46 |
Current Ratio |
1.42 |
2.56 |
3.71 |
5.18 |
6.74 |
|
|
|
|
|
|
|
|
|
47 |
Total Outside Liabilities / Tangible Networth |
3.43 |
1.02 |
0.54 |
0.34 |
0.24 |
|
|
|
|
|
|
|
|
|
|
Additional
Information |
|
|
|
|
|
|
|
- Arrear of Depreciation |
-- |
-- |
-- |
-- |
-- |
|
|
|
|
|
|
|
|
|
|
- Contingent Liabilities |
-- |
-- |
-- |
-- |
-- |
------------------------------------------------------------------------------------------------------------------------------
FUND FLOW STATEMENT
(RS. IN MILLIONS)
|
PARTICULARS |
2015 Estimates |
2016 Projection |
2017 Projection |
2018 Projection |
|
|
|
|
|
|
|
Profit before Tax |
5.215 |
29.483 |
37.451 |
47.855 |
|
|
|
|
|
|
|
Add:
Depreciation |
0.750 |
0.638 |
0.542 |
0.461 |
|
|
|
|
|
|
|
Add: Preliminary Expenses |
0.000 |
0.000 |
0.000 |
0.000 |
|
|
|
|
|
|
|
Add: Investment Allowance |
-- |
-- |
-- |
-- |
|
|
|
|
|
|
|
Total |
5.965 |
30.121 |
37.993 |
48.316 |
|
|
|
|
|
|
|
Less: Taxes paid/ payable [relating to the year] |
-- |
1.611 |
9.110 |
11.572 |
|
|
|
|
|
|
|
Less:
Dividend paid/ payable [relating to the year] |
0.000 |
0.000 |
0.000 |
0.000 |
|
|
|
|
|
|
|
A. Sub-total Net
Funds Generated |
5.965 |
28.510 |
28.883 |
36.744 |
|
|
|
|
|
|
|
Increase
in Capital |
5.000 |
0.000 |
0.000 |
0.000 |
|
|
|
|
|
|
|
Increase
in Unsecured Loans |
4.500 |
0.000 |
0.000 |
0.000 |
|
|
|
|
|
|
|
Subsidy / ST deferment |
-- |
-- |
-- |
-- |
|
|
|
|
|
|
|
Increase
in Public Deposits |
-- |
-- |
-- |
-- |
|
|
|
|
|
|
|
Increase in Term Loans |
0.000 |
0.000 |
0.000 |
0.000 |
|
|
|
|
|
|
|
Decrease
in Fixed Assets |
0.000 |
0.000 |
0.000 |
0.000 |
|
|
|
|
|
|
|
Decrease in Inter-Corporate Investments and Advances |
0.000 |
0.000 |
0.000 |
0.000 |
|
|
|
|
|
|
|
Decrease
in Other non-Current assets |
0.000 |
0.000 |
0.000 |
0.000 |
|
|
|
|
|
|
|
B. Sub-total |
9.500 |
0.000 |
0.000 |
0.000 |
|
|
|
|
|
|
|
Increase
in Short-term Bank Borrowings including Bills purchased and discounted by
bankers |
25.000 |
0.000 |
0.000 |
0.000 |
|
|
|
|
|
|
|
Increase in Other Current Liabilities |
0.000 |
0.000 |
0.000 |
0.000 |
|
|
|
|
|
|
|
Decrease
in Inventory |
0.000 |
0.000 |
0.000 |
0.000 |
|
|
|
|
|
|
|
Decrease receivables [Including Bill
purchased and discounted by Banker] |
0.000 |
0.000 |
0.000 |
0.000 |
|
|
|
|
|
|
|
Decrease
in Other Current assets [Including Cash and bank balance] |
0.000 |
0.000 |
0.000 |
0.000 |
|
|
|
|
|
|
|
C. Sub-total |
25.000 |
0.000 |
0.000 |
0.000 |
|
|
|
|
|
|
|
TOTAL FUNDS AVAILABLE [A + B + C] |
40.465 |
28.510 |
28.883 |
36.744 |
|
|
|
|
|
|
|
USES |
|
|
|
|
|
Increased
in Fixed Assets un-provided Dep. of earlier years |
5.000 |
0.000 |
0.000 |
0.000 |
|
|
|
|
|
|
|
Decrease in Term Loan/ Debentures |
0.000 |
0.000 |
0.000 |
0.000 |
|
|
|
|
|
|
|
Deferred Payment Liabilities |
0.000 |
0.000 |
0.000 |
0.000 |
|
|
|
|
|
|
|
Decrease in Public Deposits |
0.000 |
0.000 |
0.000 |
0.000 |
|
|
|
|
|
|
|
Increase
in Inter-corporate Investments and Advances |
0.000 |
0.000 |
0.000 |
0.000 |
|
|
|
|
|
|
|
Decrease in Capital |
0.000 |
0.000 |
0.000 |
0.000 |
|
|
|
|
|
|
|
Increase in other non-current assets |
0.000 |
0.000 |
0.000 |
0.000 |
|
|
|
|
|
|
|
D. Sub-total |
5.000 |
0.000 |
0.000 |
0.000 |
|
|
|
|
|
|
|
Decrease in Short Term Bank Borrowings including Bills
purchased and Discounted by Bankers |
0.000 |
0.000 |
0.000 |
0.000 |
|
|
|
|
|
|
|
Electric Deposits |
0.000 |
0.000 |
0.000 |
0.000 |
|
|
|
|
|
|
|
Increase in Inventory |
27.094 |
4.205 |
5.091 |
5.476 |
|
|
|
|
|
|
|
Increase in receivables including Bills purchased and discounted by bankers |
8.190 |
1.919 |
14.515 |
4.596 |
|
|
|
|
|
|
|
Increase in Other Current Assets [Including Cash and bank Balance] |
0.181 |
22.386 |
9.277 |
26.672 |
|
|
|
|
|
|
|
E. Sub-total |
35.465 |
28.510 |
28.883 |
36.744 |
|
|
|
|
|
|
|
Loss [Item 10 of Part A of Form II] |
0.000 |
0.000 |
0.000 |
0.000 |
|
|
|
|
|
|
|
Less:
Depreciation [Item 4-VIII of Part A of Form] |
0.000 |
0.000 |
0.000 |
0.000 |
|
|
|
|
|
|
|
Gross Funds Lost |
0.000 |
0.000 |
0.000 |
0.000 |
|
|
|
|
|
|
|
Add: Taxes paid/payable |
-- |
-- |
-- |
-- |
|
|
|
|
|
|
|
Add: Dividends paid/payable |
-- |
-- |
-- |
-- |
|
|
|
|
|
|
|
F. Sub-total Net Funds Lost |
0.000 |
0.000 |
0.000 |
0.000 |
|
|
|
|
|
|
|
TOTAL FUNDS USED [D
+ E + F] |
40.465 |
28.510 |
28.883 |
36.744 |
|
|
|
|
|
|
|
Summary of Fund
Flow |
|
|
|
|
|
Long
term Sources |
15.465 |
28.510 |
28.883 |
36.744 |
|
|
|
|
|
|
|
Long term Uses |
5.000 |
0.000 |
0.000 |
0.000 |
|
|
|
|
|
|
|
Surplus
[+] / Shortfall [-] |
10.465 |
28.510 |
28.883 |
36.744 |
|
|
|
|
|
|
|
Short
term Sources |
25.000 |
0.000 |
0.000 |
0.000 |
|
|
|
|
|
|
|
Short term Uses |
35.465 |
28.510 |
28.883 |
36.744 |
|
|
|
|
|
|
|
Surplus
[+] / Shortfall [-] |
(10.465) |
(28.510) |
(28.883) |
(36.744) |
------------------------------------------------------------------------------------------------------------------------------
COMPARATIVE STATEMENT OF CURRENT ASSETS
& CURRENT LIABILITIES
(RS. IN MILLIONS)
|
SR. NO. |
PARTICULARS |
2015 ESTIMATES |
2016 PROJECTION |
2017 PROJECTION |
|
|
|
|
|
|
|
1. |
CURRENT ASSETS |
|
|
|
|
|
i. Raw Materials |
|
|
|
|
|
-
Imported |
0.000 |
0.000 |
0.000 |
|
|
[Month
Consumption] |
0.00 |
0.00 |
0.00 |
|
|
|
|
|
|
|
|
- Indigenous |
27.094 |
31.299 |
36.390 |
|
|
[Month
Consumption] |
1.27 |
1.22 |
1.20 |
|
|
|
|
|
|
|
|
ii. Other Consumable Spares |
0.000 |
0.000 |
0.000 |
|
|
[Month
Consumption] |
0.00 |
0.00 |
0.00 |
|
|
|
|
|
|
|
|
iii. Stock in process |
0.000 |
0.000 |
0.000 |
|
|
[Month
Consumption] |
-- |
-- |
-- |
|
|
|
|
|
|
|
|
iv. Finished Goods |
0.000 |
0.000 |
0.000 |
|
|
[Month Cost of Production] |
0.00 |
0.00 |
0.00 |
|
|
|
|
|
|
|
|
v. Receivables |
8.190 |
10.109 |
24.624 |
|
|
[Month of Sales] |
0.32 |
0.33 |
0.67 |
|
|
|
|
|
|
|
|
vi.
Export Receivables |
-- |
-- |
-- |
|
|
|
|
|
|
|
|
vii. Advances to Suppliers |
-- |
-- |
-- |
|
|
|
|
|
|
|
|
viii. Other Current Assets [Including Cash and bank Balances] |
0.161 |
22.567 |
31.843 |
|
|
|
|
|
|
|
|
TOTAL CURRENT
ASSETS |
35.465 |
63.975 |
92.857 |
|
|
|
|
|
|
|
2. |
CURRENT LIABILITIES
|
|
|
|
|
|
[other than bank borrowings] |
|
|
|
|
|
|
|
|
|
|
|
i. Creditors for Purchase of Raw Material and Stores |
0.000 |
0.000 |
0.000 |
|
|
|
|
|
|
|
|
Creditors for Capital Goods |
-- |
-- |
-- |
|
|
|
|
|
|
|
|
ii. Advances from Customers |
-- |
-- |
-- |
|
|
|
|
|
|
|
|
iii. Accrued Expenses |
0.000 |
0.000 |
0.000 |
|
|
|
|
|
|
|
|
iv.
Statutory Liabilities |
-- |
-- |
-- |
|
|
|
|
|
|
|
|
v. Other Current Liabilities [Installment of term loans payable in next one year] |
0.000 |
0.000 |
0.000 |
|
|
|
|
|
|
|
|
TOTAL CURRENT
LIABILITIES |
0.000 |
0.000 |
0.000 |
------------------------------------------------------------------------------------------------------------------------------
COMPUTATION OF MAXIMUM PERMISSIBLE BANK
FINANCE FOR WORKING CAPITAL
(RS. IN MILLIONS)
|
SR. NO. |
PARTICULARS |
2015 ESTIMATES |
2016 PROJECTION |
2017 PROJECTION |
|
|
|
|
|
|
|
1 |
Total Current Assets |
35.465 |
63.975 |
92.857 |
|
|
|
|
|
|
|
2 |
Other
Current Liabilities [Other
than Bank borrowings] |
0.000 |
0.000 |
0.000 |
|
|
|
|
|
|
|
3 |
Working Capital Gap |
35.465 |
63.975 |
92.857 |
|
|
|
|
|
|
|
4 |
Minimum stipulated net working Capital - 25% of WCG/ 25% of total current assets as the case may be depending upon the method of lending being applied [Export receivables to be excluded under both the methods] |
-- |
-- |
-- |
|
|
|
|
|
|
|
|
2nd
Method [Considered] |
8.866 |
15.994 |
23.214 |
|
|
|
|
|
|
|
5 |
Actual / Projected Net Working Capital |
10.465 |
38.975 |
67.857 |
|
|
|
|
|
|
|
6 |
Item 3 minus item 4 |
26.599 |
47.981 |
69.643 |
|
|
|
|
|
|
|
7 |
Item
3 minus item 5 |
25.000 |
25.000 |
25.000 |
|
|
|
|
|
|
|
8 |
Maximum permissible bank finance (item 6 or 7 whichever is less) |
25.000 |
25.000 |
25.000 |
|
|
|
|
|
|
|
9 |
Excess
borrowings, if any representing short fall in NWC |
0.000 |
0.000 |
0.000 |
|
|
|
|
|
|
|
|
[2ND METHOD OF
LENDING] |
|
|
|
|
|
|
|
|
|
|
10 |
Working Capital Gap [Item III of Part B] |
35.465 |
63.975 |
92.857 |
|
|
|
|
|
|
|
11 |
Minimum
Stipulated Net Working Capital [25%] |
8.866 |
15.994 |
23.214 |
|
|
|
|
|
|
|
12 |
Actual / Projected Net Working Capital [Item
vi of Part B] |
10.465 |
38.975 |
67.857 |
|
|
|
|
|
|
|
13 |
Item
8 minus item 9 |
26.599 |
47.981 |
69.643 |
|
|
|
|
|
|
|
14 |
Item 8 minus item 10 |
25.000 |
25.000 |
25.000 |
|
|
|
|
|
|
|
15 |
Maximum permissible finance [Minimum of 11 and 12] |
25.000 |
25.000 |
25.000 |
|
|
|
|
|
|
|
16 |
Excess
bank Borrowings [To be converted into Short term loan] |
0.000 |
0.000 |
0.000 |
------------------------------------------------------------------------------------------------------------------------------
ANALYSIS AND COMPARATIVE RATIO
(RS. IN MILLIONS)
|
SR. NO. |
PARTICULARS |
2015 Estimates |
2016 Projection |
2017 Projection |
2018 Projection |
|
|
|
|
|
|
|
|
1 |
Net Sales [Item 3 in Form II A] |
122.850 |
303.264 |
369.360 |
442.800 |
|
|
|
|
|
|
|
|
2 |
Rise
[+] or fall in Net Sales during the year as compared to previous year |
0.000 |
14.686 |
2.179 |
1.988 |
|
|
|
|
|
|
|
|
3 |
Profit before [+] or loss [-] item 10 in Form II A |
5.215 |
29.483 |
37.451 |
47.855 |
|
|
|
|
|
|
|
|
4 |
Net Profit after Tax [+] or Loss [-] Item 12 |
3.604 |
20.373 |
25.879 |
33.068 |
|
|
|
|
|
|
|
|
5 |
a.
Equity Dividend Declared |
-- |
-- |
-- |
-- |
|
|
|
|
|
|
|
|
|
b. Equity Dividend paid [Withdrawals] |
0.000 |
0.000 |
0.000 |
0.000 |
|
|
|
|
|
|
|
|
|
c.
Rate of [A] |
-- |
-- |
-- |
-- |
|
|
|
|
|
|
|
|
|
d. Rate of [B] |
-- |
-- |
-- |
-- |
|
|
|
|
|
|
|
|
6 |
Retained
Profit |
3.604 |
20.373 |
25.879 |
33.068 |
|
|
|
|
|
|
|
|
7 |
Retained Profit % |
100.00 |
100.00 |
100.00 |
100.00 |
|
|
|
|
|
|
|
|
8 |
a. Raw Material |
|
|
|
|
|
|
- Imported |
-- |
-- |
-- |
-- |
|
|
-
Indigenous |
0.000 |
0.000 |
0.000 |
0.000 |
|
|
|
|
|
|
|
|
9 |
Stock in Process. How many months Cost of Production. Do these represent? |
0.000 |
0.000 |
0.000 |
0.000 |
|
|
|
|
|
|
|
|
10 |
Finished
Goods |
0.000 |
0.000 |
0.000 |
0.000 |
|
|
|
|
|
|
|
|
11 |
Other consumable Spares that is the
percentage to total inventory and how many months normal consumption do these
represent |
0.000 |
0.000 |
0.000 |
0.000 |
|
|
|
|
|
|
|
|
12 |
a.
Receivable other than deferred receivables and Export receivables. How many
months domestic sales other than on deferred payment basis on these represent
|
8.190 |
10.109 |
24.624 |
29.220 |
|
|
|
|
|
|
|
|
|
b. Export receivable how many months export sales do there represent |
-- |
-- |
-- |
-- |
|
|
|
|
|
|
|
|
|
c. Deferred receivables |
-- |
-- |
-- |
-- |
|
|
|
|
|
|
|
|
13 |
Sundry
Creditors [Trade] [Item 4 in Form III A] |
0.000 |
0.000 |
0.000 |
0.000 |
|
|
|
|
|
|
|
|
14 |
Net Working Capital [Item 49 in Form III A] |
10.465 |
38.975 |
67.857 |
104.601 |
|
|
|
|
|
|
|
|
15 |
Current
Ratio [Item 38 in Form III A] |
1.42 |
2.56 |
3.71 |
5.18 |
|
|
|
|
|
|
|
|
16 |
Tangible Networth [Item 38 in Form
III A] |
8.604 |
28.976 |
54.855 |
87.923 |
|
|
|
|
|
|
|
|
17 |
Total
Outside Liabilities/ Tangible Networth [Item 21/ Item 48 in Form III A] [Debt
Equity Ratio] |
3.43 |
1.02 |
0.54 |
0.34 |
|
|
|
|
|
|
|
|
18 |
a. Bank Borrowing/ Total Outside Liabilities [Item 1/ Item 21 in Form III A] |
0.85 |
0.85 |
0.85 |
0.85 |
|
|
|
|
|
|
|
|
|
b. Net Sales / Total Tangible Assets [Item 3 in Form II A / Item 47 minus item 46 in Form III A] |
3.09 |
4.49 |
3.85 |
3.35 |
------------------------------------------------------------------------------------------------------------------------------
NETWORTH STATEMENT
MR. LAXMANBHAI MANGAJI PATEL
(RS. IN MILLIONS)
DETAILS
OF ASSETS
IMMOVABLE PROPERTY
|
ASSETS |
OWN / JOINT NAME |
AREA |
FREE HOLD OR
LEASE HOLD |
LOCATION/ ADDRESS |
PURCHASE COST |
PRESENT VALUE |
WHETHER
ENCUMBERED (GIVE DETAILS) |
|
Non Agri. Land |
|
|
|
|
|
|
|
|
i. Commercial |
Owned |
2500 Sq. Yards |
Freehold |
Plot No. 22 and 23,
Zak GIDC, Block 290, Zak Vehlal Road, Gandhinagar |
0.490 |
15.000 |
No |
|
ii. Residential |
Owned |
100 Sq. Yards |
Freehold |
A-43, Keshavpark
Society, Vastaral, Ahmedabad |
1.000 |
7.500 |
No |
|
Flat / House |
-- |
-- |
-- |
-- |
-- |
-- |
-- |
|
Agri. Land |
-- |
-- |
-- |
-- |
-- |
-- |
-- |
|
Others |
-- |
-- |
-- |
-- |
-- |
-- |
-- |
MOVABLE PROPERTY
INSURANCE POLICIES
|
NAME OF COMPANY AND BRANCH |
ANNUAL PREMIUM |
|
LIC Premium |
0.400 |
|
|
|
|
HDFC |
0.250 |
|
|
|
|
Kotak |
0.350 |
|
|
|
|
Total |
1.000 |
SHARES / DEBENTURES / MUTUAL FUND ETC.: NA
TERM DEPOSITS: NA
INVESTMENT IN GOVT. SECURITIES LIKE BONDS / PPF/ NSC / KVP / IVP ETC.:
NA
JEWELLERY
|
PARTICULARS |
QUANTITY |
VALUATION
[APPROX.] |
|
Gold |
100 Gms. |
0.275 |
|
|
|
|
|
Silver |
1 Kgs |
0.045 |
|
|
|
|
|
Others |
-- |
-- |
CAPITAL INVESTED IN BUSINESS
|
NAME OF THE FIRM/
COMPANY |
AMOUNT IN MILLIONS |
|
Khushbu Enterprise |
1.330 |
|
|
|
|
Laxmi Metal [HUF] |
0.465 |
LEGAL
HEIRS / FAMILY PARTICULARS
|
NAME |
OCCUPATION |
RELATION |
AGE |
MARITAL STATUS |
ADDRESS |
|
Bhaviben L. Patel |
Business |
Wife |
35 |
Married |
A-43, Keshavpark Society, Vastaral, Ahmedabad - 382418, Gujarat, India |
|
|
|
|
|
|
|
|
Khushbu L. Patel |
Study |
Daughter |
9 |
Unmarried |
A-43, Keshavpark Society, Vastaral, Ahmedabad - 382418, Gujarat, India |
|
|
|
|
|
|
|
|
Tanshok L. Patel |
Study |
Son |
7 |
Unmarried |
A-43, Keshavpark Society, Vastaral, Ahmedabad - 382418, Gujarat, India |
|
|
|
|
|
|
|
|
Pinky L. Patel |
Study |
Daughter |
14 |
Unmarried |
A-43, Keshavpark Society, Vastaral, Ahmedabad - 382418, Gujarat, India |
|
|
|
|
|
|
|
|
Bansi L. Patel |
Study |
Daughter |
12 |
Unmarried |
A-43, Keshavpark Society, Vastaral, Ahmedabad - 382418, Gujarat, India |
------------------------------------------------------------------------------------------------------------------------------
NETWORTH STATEMENT
MRS. BHAVIBEN LAXMANBHAI PATEL
(RS. IN MILLIONS)
DETAILS
OF ASSETS
IMMOVABLE PROPERTY
|
ASSETS |
OWN / JOINT NAME |
AREA |
FREE HOLD OR
LEASE HOLD |
LOCATION/ ADDRESS |
PURCHASE COST |
PRESENT VALUE |
WHETHER
ENCUMBERED (GIVE DETAILS) |
|
Non Agri. Land |
|
|
|
|
|
|
|
|
i. Commercial |
Owned |
3000 Sq. Yards |
Freehold |
Plot No. 20 and
21, Zak GIDC, Zak Vehlal Road, Gandhinagar |
2.200 |
20.000 |
-- |
|
ii. Residential |
-- |
-- |
-- |
-- |
-- |
-- |
-- |
|
Flat / House |
-- |
-- |
-- |
-- |
-- |
-- |
-- |
|
Agri. Land |
-- |
-- |
-- |
-- |
-- |
-- |
-- |
|
Others |
-- |
-- |
-- |
-- |
-- |
-- |
-- |
MOVABLE PROPERTY
INSURANCE POLICIES: NA
SHARES / DEBENTURES / MUTUAL FUND ETC.: NA
TERM DEPOSITS: NA
INVESTMENT IN GOVT. SECURITIES LIKE BONDS / PPF/ NSC / KVP / IVP ETC.:
NA
VEHICLES: NA
JEWELLERY
|
PARTICULARS |
QUANTITY |
VALUATION
[APPROX.] |
|
Gold |
400 Gms. |
1.100 |
|
|
|
|
|
Silver |
3 Kgs |
0.125 |
|
|
|
|
|
Others |
-- |
-- |
CAPITAL INVESTED IN BUSINESS
|
NAME OF THE FIRM/
COMPANY |
AMOUNT IN MILLIONS |
|
Khushbu Enterprise |
18.736 |
LEGAL
HEIRS / FAMILY PARTICULARS
|
NAME |
OCCUPATION |
RELATION |
AGE |
MARITAL STATUS |
ADDRESS |
|
Laxman Mangaji Patel |
Business |
Husband |
40 |
Married |
A-43, Keshavpark Society, Vastaral, Ahmedabad - 382418, Gujarat, India |
|
|
|
|
|
|
|
|
Khushbu L. Patel |
Study |
Daughter |
9 |
Unmarried |
A-43, Keshavpark Society, Vastaral, Ahmedabad - 382418, Gujarat, India |
|
|
|
|
|
|
|
|
Tanshok L. Patel |
Study |
Son |
7 |
Unmarried |
A-43, Keshavpark Society, Vastaral, Ahmedabad - 382418, Gujarat, India |
|
|
|
|
|
|
|
|
Pinky L. Patel |
Study |
Daughter |
14 |
Unmarried |
A-43, Keshavpark Society, Vastaral, Ahmedabad - 382418, Gujarat, India |
|
|
|
|
|
|
|
|
Bansi L. Patel |
Study |
Daughter |
12 |
Unmarried |
A-43, Keshavpark Society, Vastaral, Ahmedabad - 382418, Gujarat, India |
------------------------------------------------------------------------------------------------------------------------------
PROJECT REPORT
ABOUT THE PROJECT:
Drawing is a metal working
process which uses tensile forces to stretch metal. It is broken up into two
types: sheet metal drawing and wire, bar, and tube drawing. The specific
definition for sheet metal drawing is that it involves plastic deformation over
a curved axis. For wire, bar, and tube drawing the starting stock is drawn
through a die to reduce its diameter and increase its length. Drawing is
usually done at room temperature, thus classified a cold working process.
However, it may be performed at elevated temperatures to hot work large wires,
rods or hollow sections in order to reduce forces.
Drawing is different from rolling in that the pressure of drawing it not
transmitted through the turning action of the mill, but instead depends on
force directed locally at the area of compression. This means the amount of
possible drawing force is limited by the tensile strength of the material, a
fact that is particularly evident when drawing thin wires.
Wire drawing is a metalworking
process used to reduce the cross-section of a wire by pulling the wire through
a single, or series of, drawing die(s). There are many applications for wire
drawing, including electrical wiring, cables, tension-loaded structural
components, springs, paper clips, spokes for wheels, and stringed musical
instruments. Although similar in process, drawing is different from extrusion,
because in drawing the wire is pulled, rather than pushed, through the die.
Drawing is usually performed at room temperature, thus classified as a cold
working process, but it may be performed at elevated temperatures for large
wires to reduce forces.
PROCESS
Wire drawing
concept
The wire drawing process is quite simple in concept. The wire is
prepared by shrinking the beginning of it, by hammering, filing, rolling or swaging,
so that it will fit through the die, the wire is then pulled through the die.
As the wire is pulled through the die, its volume remains the same, so as the
diameter decreases, the length increases. Usually the wire will require more
than one draw, through successively smaller dies, to reach the desired size.
The American wire gauge scale is based on this. This can be done on a small
scale with a draw plate, or on a large: commercial scale using automated
machinery. The process of wire drawing changes material properties due to cold
working.
The area reduction in small wires is generally 15-25% and in larger
wires is 20-45%. The exact die sequence for a particular job is a function of
area reduction, input wire size and output wire size. As the area reduction
changes, so does the die sequence.
Very fine wires are usually drawn in bundles. In a bundle, the wires are
separated by a metal with similar properties, but with lower chemical
resistance so that it can be removed after drawing lf the reduction in area is
greater than 50%, the process may require an intermediate step of it can be
redrawn.
Commercial wire drawing usually starts with a coil of hot rolled 9 mm
(0.35 in) diameter wire. The surface is first treated to remove scales. It is
then fed into a wire drawing machine which may have one or more blocks in
series.
Single block wire drawing machines include means for holding the dies
accurately in position and for drawing the wire steadily through the holes. The
usual design consists of a cast-iron bench or table having a bracket standing
up to hold the die, and a vertical drum which rotates and by coiling the wire
around its surface pulls it through the die, the coil of wire being stored upon
another drum or "swift" which lies behind the die and reels off the
wire as fast as required. The wire drum or' "block" is provided with
means for rapidly coupling or uncoupling it to its vertical shaft, so that the
motion of the wire may be stopped or started instantly. The block is also
tapered, so that the coil of wire may be easily slipped off upwards when
finished. Before the wire can be attached to the block, a sufficient length of
it must be pulled through the die; this is effected by a pair of gripping
pincers on the end of a chain which is wound around a revolving drum, so
drawing the wire until enough can be coiled two or three times on the block,
where the end is secured by a small screw clamp or vice. When the wire is on
the block, it is set in motion and the wire is drawn steadily through the die;
it is very important that the block rotates evenly and that it runs true and
pulls the wire at a constant velocity, otherwise "snatching" occurs
which will weaken or even break the wire. The speeds at which wire is drawn
vary greatly, according to the material and the amount of reduction.
Machines with continuous blocks differ from single block machines by
having a series of dies through which the wire is drawn in a continuous
fashion. Due to the elongation and slips, the speed of the wire changes after each
successive redraw. This increased speed is accommodated by having a different
rotation speed for each block. One of these machines may contain 3 to 12 dies.
The operation of threading the wire through all the dies and around the blocks
is termed "stringing-up". The arrangements for lubrication include a
pump which floods the dies, and in many cases also the bottom portions of the
blocks run in lubricant.
Often intermediate anneals are required to counter the effects of cold
working, and to allow further drawing. A final anneal may also be used on the
finished product to maximize ductility and electrical conductivity.
An example of product produced in a continuous wire drawing machine is
telephone wire. It is drawn 20 to 30 times from hot rolled rod stock.
While round cross-sections dominate most drawing processes, non-circular
cross-sections are drawn. They are usually drawn when the cross-section is
small and quantities are too low to justify rolling. In these processes, a
block or Turk’s head machine are used.
UTTLTTES:
Power:
The Directors of the company has already constructed Factory Shed on
Plot No.22, 23 and in which power connection has already been taken by the
company. So company has enough power supply from GEB to continue its business
activity'
Water:
The Company has its own tube well for requirement of its water in the
production.
Labour:
The company has enough trained labour force at the factory site for
production of s.s. wire at zak. Moreover, all the labors are stay at the factory
site so company will not observe labour problem at the factory.
TYPES OF PRODUCTS:
Steel is not a single product. There are currently more than 3,500
different grades of steel with many different physical, chemical, and
environmental properties. Approximately 75% of modern steels have been
developed in the last 20 years. If the Eiffel Tower were to be rebuilt today
the engineers would only need one-third of the amount of steel. Modern cars are
built with new steels that are stronger, but up to 25% lighter than in the
Past.
Semi-finished products are solid blocks of steel, usually with a square
or rectangular cross section. At a steel mill, the crude steel production
process turns molten steel into ingots, blooms, billets or slabs. These are
called semi-finished products.
Finished steel products are forged from semi-finished products. They are
classified as follows:
· Cold-finished bars and flats (bright bars)
· Cold-finished sections including forged and cold-formed sections
· Cold-rolled narrow strip
· Cold-rolled plate and sheet in coil and lengths
· Deformed reinforcing bars
Drawn wire
· Forged bars
· Forgings (unworked)
· Heavy sections, piling and welded structural sections
· Hot-rolled bars and flats in lengths
· Hot-rolled light sections
· Hot-rolled narrow strip including universal plates
· Hot-rolled rod in a coil (including reinforcement bar in a coil)
· Hot-rolled wide strip, plate and sheet
· Points, switches, crossings, tyres, wheels and axles
· Rails and rolled accessories
· Silicon electrical sheet and strip
· Steel castings (unworked)
· Steel tubes (seamless and welded, and steel tube fittings)
SWOT ANALYSIS:
STRENGTHS
Rich mineral
resources: India has abundance of iron ore, coal and many other raw materials
required for iron and steel making. It has the fourth largest iron ore reserves
(10.3 billion tonnes) after Russia, Brazil, and Australia. Therefore, many raw
materials are available at comparatively lower costs.
Technical
manpower: It has the third largest pool of technical manpower, next to United
States and the erstwhile USSR, capable of understanding and assimilating new
technologies. The director Mr. Laxmanbhai Patel is technically sound in this
particular industry as he is in the business since 1998.
Workforce: Considering
quality of workforce, Indian steel industry has low unit labour cost,
commensurate with skill. This gets reflected in the lower production cost of
steel in India compared to many advanced countries.
Untapped market: With such
strength of resources, along with vast domestic untapped market, Indian steel
industry has the potential to face challenges successfully.
Strong managerial
capability: Mr. Laxmanbhai Patel is having sound knowledge of steel wire industries,
he understand the market, having knowledge of production, sales ability so
management is sound in this part.
WEAKNESS
High ash content
of indigenous coking coal: This is inherent in the quality and availability
of some of the essential raw materials available in India, and they adversely
affect the productive efficiency of iron-making and is generally imported.
Capital intensive
industry: Also, Steels a capital intensive industry; steel companies in India are
charged an interest rate of around 14% on capital as compared to 2.4% in Japan
and 6.4% in USA.
High administered
price and High cost of energy: Prices of essential inputs like electricity are
highly administered and it puts Indian steel industry at a disadvantage; about
45% of the input costs can be attributed to the administered costs of coal,
fuel and electricity.
Higher duties and
taxes: In India, rate of income tax is so high, moreover rate of excise duty,
vat etc. amounts to large amount then other developed countries.
OPPORTUNITIES:
Increasing
consumption: The biggest opportunity before Indian steel sector is that there is
enormous scope for increasing consumption of steel in almost all sectors in
India. The Indian rural sector remains fairly unexposed to their Multi-faceted
use of steel.
Substitution and
cost effective usage: The usage of steel in cost Effective manner is
possible in the area of housing, fencing, structures and other possible
applications where steel can substitute other materials which not only could
bring about Advantages to users but is also desirable for conservation of
forest resources.
Many potential
sectors: Excellent potential exist for enhancing steel consumption in other
sectors such as automobiles, packaging, engineering industries, irrigation and
water supply in India.
Huge infrastructure
demand:
In India, with new Government, it is expected that new government will clear
all pending infrastructure projects very soon and in this regard most of the
work has already been done by the government. Their product is used in all
types of infrastructure machineries that will help to grow them more.
Rapid
urbanization: In India, urbanization takes place very rapidly, in sense that new
cities are created and will increase their product demand indirectly.
Increasing demand
for consumer durable: Now a days, purchasing power of an average middle
class family is increased. And furniture, cars etc. are now a day's necessities
than luxury and in all that their finished goods is applied which shows their
growth.
THREATS
Linkage between
steel industry and economic growth: The linkage between the economic growth of
a country and the growth of its steel industry is strong. The growth of the
domestic steel industry between 1970 and 1990 was similar to the growth of the
economy, which as a whole was sluggish. This strong relation in today's
environment where the growth of the industry has become stagnant owing to the
overall slowdown has resulted in enhanced rivalry among existing firms.
Price wars: As the industry
is not growing the only other way to grow is by increasing one's market share.
The Indian steel industry has witnessed spurts of price wars and heavy trade
discounts, which has impacted the Indian Steel Industry.
------------------------------------------------------------------------------------------------------------------------------
VALUATION REPORT
(GENERAL DETAILS)
|
Purpose for which valuation is made |
For opine present market value Bank of
India, ITCR Branch, Ahmedabad |
||||||||||||||||||||||||||||||||||||||||||||||||||||||||||||||||||||||||||||||||
|
|
|
||||||||||||||||||||||||||||||||||||||||||||||||||||||||||||||||||||||||||||||||
|
Date as on which valuation is made |
30.10.2014 |
||||||||||||||||||||||||||||||||||||||||||||||||||||||||||||||||||||||||||||||||
|
|
|
||||||||||||||||||||||||||||||||||||||||||||||||||||||||||||||||||||||||||||||||
|
Name of the Owner |
Mr. Laxmanbhai M. Patel |
||||||||||||||||||||||||||||||||||||||||||||||||||||||||||||||||||||||||||||||||
|
|
|
||||||||||||||||||||||||||||||||||||||||||||||||||||||||||||||||||||||||||||||||
|
Persone/ Contact No. |
Laxmanbhai |
||||||||||||||||||||||||||||||||||||||||||||||||||||||||||||||||||||||||||||||||
|
|
|
||||||||||||||||||||||||||||||||||||||||||||||||||||||||||||||||||||||||||||||||
|
It the property is under Joint Ownership/ Co
Ownership Share of each such owner. Are the shares undivided? |
Freehold Property |
||||||||||||||||||||||||||||||||||||||||||||||||||||||||||||||||||||||||||||||||
|
|
|
||||||||||||||||||||||||||||||||||||||||||||||||||||||||||||||||||||||||||||||||
|
Brief description of the property |
As per Annexure I |
||||||||||||||||||||||||||||||||||||||||||||||||||||||||||||||||||||||||||||||||
|
|
|
||||||||||||||||||||||||||||||||||||||||||||||||||||||||||||||||||||||||||||||||
|
Location, Street, Ward No. |
Plot No. 22 and 23, B/h. Mahakali Industrial
Estate, Village Zak, Ahmedabad |
||||||||||||||||||||||||||||||||||||||||||||||||||||||||||||||||||||||||||||||||
|
|
|
||||||||||||||||||||||||||||||||||||||||||||||||||||||||||||||||||||||||||||||||
|
Survey / Plot No. of Land |
R.S. No. 357 |
||||||||||||||||||||||||||||||||||||||||||||||||||||||||||||||||||||||||||||||||
|
|
|
||||||||||||||||||||||||||||||||||||||||||||||||||||||||||||||||||||||||||||||||
|
Is the property situated in the Residential/
Commercial/ Mixed Area/ Industrial Area? |
Developed Industrial Area |
||||||||||||||||||||||||||||||||||||||||||||||||||||||||||||||||||||||||||||||||
|
|
|
||||||||||||||||||||||||||||||||||||||||||||||||||||||||||||||||||||||||||||||||
|
Classification of Locality – High class/
Middle Class/ Poor class? |
Middle Class Locality |
||||||||||||||||||||||||||||||||||||||||||||||||||||||||||||||||||||||||||||||||
|
|
|
||||||||||||||||||||||||||||||||||||||||||||||||||||||||||||||||||||||||||||||||
|
Proximity to civic amenities like School,
Hospitals, cinema etc. |
Hospital, Schools, Colleges, Shops Clinics
are available within nearby area. |
||||||||||||||||||||||||||||||||||||||||||||||||||||||||||||||||||||||||||||||||
|
Proximities to civic amenities -
School -
Hospital -
Office -
Market -
Airport |
Nearby area Nearby area Nearby area Nearby area Approx. 50 Km |
||||||||||||||||||||||||||||||||||||||||||||||||||||||||||||||||||||||||||||||||
|
|
|
||||||||||||||||||||||||||||||||||||||||||||||||||||||||||||||||||||||||||||||||
|
Means and proximity to surface communication
by the locality is served |
Bus routes available, rickshaws and private
vehicles can easily approach the site. |
||||||||||||||||||||||||||||||||||||||||||||||||||||||||||||||||||||||||||||||||
|
|
|
||||||||||||||||||||||||||||||||||||||||||||||||||||||||||||||||||||||||||||||||
|
Area of land supported by documentary proof,
shape dimensions and physical features |
1755.85 Sq. Mt. 2100 Sq. Yds. [As per document produced] |
||||||||||||||||||||||||||||||||||||||||||||||||||||||||||||||||||||||||||||||||
|
|
|
||||||||||||||||||||||||||||||||||||||||||||||||||||||||||||||||||||||||||||||||
|
Orientation of Site -
North -
South -
East -
West |
Block No. 289 and 290 Common Road Road Plot No. 24 |
||||||||||||||||||||||||||||||||||||||||||||||||||||||||||||||||||||||||||||||||
|
|
|
||||||||||||||||||||||||||||||||||||||||||||||||||||||||||||||||||||||||||||||||
|
Is it leasehold the name of lessor/ lessee,
nature of lease, dates of commencement and termination of lease and terms of
renewal of lease: -
Initial premium -
Ground rent payable per
annum -
Unearned increase
payable to the lessor in the event of sale or transfer |
Freehold property |
||||||||||||||||||||||||||||||||||||||||||||||||||||||||||||||||||||||||||||||||
|
|
|
||||||||||||||||||||||||||||||||||||||||||||||||||||||||||||||||||||||||||||||||
|
Is there any restrictive convenant in regard
to use of land? If so, attach a copy of the convenant. |
At present no, for further information. |
||||||||||||||||||||||||||||||||||||||||||||||||||||||||||||||||||||||||||||||||
|
|
|
||||||||||||||||||||||||||||||||||||||||||||||||||||||||||||||||||||||||||||||||
|
Does the land fall in an area included in
any town planning scheme or any development plan of government or any
statutory body? If so, give particulars |
The does not fall in any T.P. Scheme. |
||||||||||||||||||||||||||||||||||||||||||||||||||||||||||||||||||||||||||||||||
|
|
|
||||||||||||||||||||||||||||||||||||||||||||||||||||||||||||||||||||||||||||||||
|
Has any contribution been made towards
development or is any demand for such contribution still outstanding? |
At present no, for further information. |
||||||||||||||||||||||||||||||||||||||||||||||||||||||||||||||||||||||||||||||||
|
|
|
||||||||||||||||||||||||||||||||||||||||||||||||||||||||||||||||||||||||||||||||
|
Has the whole or part of land been notified
for acquisition by government or any statutory body? Give date of the
notification |
At present no, for further information. |
||||||||||||||||||||||||||||||||||||||||||||||||||||||||||||||||||||||||||||||||
|
|
|
||||||||||||||||||||||||||||||||||||||||||||||||||||||||||||||||||||||||||||||||
|
Furnish technical details of the building on
a separate sheet [The annexure to this form may be used] |
As per Annexure I |
||||||||||||||||||||||||||||||||||||||||||||||||||||||||||||||||||||||||||||||||
|
|
|
||||||||||||||||||||||||||||||||||||||||||||||||||||||||||||||||||||||||||||||||
|
Is the building owner-occupied / tenanted /
both? |
Freehold |
||||||||||||||||||||||||||||||||||||||||||||||||||||||||||||||||||||||||||||||||
|
|
|
||||||||||||||||||||||||||||||||||||||||||||||||||||||||||||||||||||||||||||||||
|
If partly owner-occupied, specify portion
and extent of area under owner-occupation |
Owner Occupied |
||||||||||||||||||||||||||||||||||||||||||||||||||||||||||||||||||||||||||||||||
|
|
|
||||||||||||||||||||||||||||||||||||||||||||||||||||||||||||||||||||||||||||||||
|
What is the floor space index permissible and
percentage actually utilized? |
As per Concern Authority |
||||||||||||||||||||||||||||||||||||||||||||||||||||||||||||||||||||||||||||||||
|
|
|
||||||||||||||||||||||||||||||||||||||||||||||||||||||||||||||||||||||||||||||||
|
-
Names of
tenants/lessees etc. -
Portion in their
occupation -
Monthly or annual rent/
Compensation/ licence fee etc. paid by each -
Gross amount received
for the whole property |
Owner Occupied at present |
||||||||||||||||||||||||||||||||||||||||||||||||||||||||||||||||||||||||||||||||
|
|
|
||||||||||||||||||||||||||||||||||||||||||||||||||||||||||||||||||||||||||||||||
|
Are any of the occupants related to, or
close business associates of the owner? |
At present no. |
||||||||||||||||||||||||||||||||||||||||||||||||||||||||||||||||||||||||||||||||
|
|
|
||||||||||||||||||||||||||||||||||||||||||||||||||||||||||||||||||||||||||||||||
|
Is separate amount being recovered for the use
of fixtures like fans, geysers, refrigerators, cooking ganges, built in
wardrobes etc. or for service charges? If so, give details |
Yes, But it included in Cost of
Construction. |
||||||||||||||||||||||||||||||||||||||||||||||||||||||||||||||||||||||||||||||||
|
|
|
||||||||||||||||||||||||||||||||||||||||||||||||||||||||||||||||||||||||||||||||
|
Give details of water and electricity charges,
if any, to be borne by the owner |
Not Produced |
||||||||||||||||||||||||||||||||||||||||||||||||||||||||||||||||||||||||||||||||
|
|
|
||||||||||||||||||||||||||||||||||||||||||||||||||||||||||||||||||||||||||||||||
|
Has the tenant to bear the whole or part of
the cost of repairs and maintenance? Give particulars |
Freehold bear the Cost |
||||||||||||||||||||||||||||||||||||||||||||||||||||||||||||||||||||||||||||||||
|
|
|
||||||||||||||||||||||||||||||||||||||||||||||||||||||||||||||||||||||||||||||||
|
If a lift is installed, who is to bear the Cost
of maintenance and operation-owner or tenant? |
Lift is not installed |
||||||||||||||||||||||||||||||||||||||||||||||||||||||||||||||||||||||||||||||||
|
|
|
||||||||||||||||||||||||||||||||||||||||||||||||||||||||||||||||||||||||||||||||
|
Is a pump is installed, who is to bear the
Cost of maintenance and operation-owner or tenant? |
Bear by the Owner |
||||||||||||||||||||||||||||||||||||||||||||||||||||||||||||||||||||||||||||||||
|
|
|
||||||||||||||||||||||||||||||||||||||||||||||||||||||||||||||||||||||||||||||||
|
Who has to bear the Cost of electricity charges
for lighting of common space like entrance hall, stairs, passages, compound,
etc. owner or tenant? |
Bear by the Owner |
||||||||||||||||||||||||||||||||||||||||||||||||||||||||||||||||||||||||||||||||
|
|
|
||||||||||||||||||||||||||||||||||||||||||||||||||||||||||||||||||||||||||||||||
|
What is the amount of property tax? Who is
to bear it? Give details with documentary proof |
Not Produced |
||||||||||||||||||||||||||||||||||||||||||||||||||||||||||||||||||||||||||||||||
|
|
|
||||||||||||||||||||||||||||||||||||||||||||||||||||||||||||||||||||||||||||||||
|
Is any dispute between landlord and tenant
regarding rent pending in a court of law? |
It is Owner occupied property |
||||||||||||||||||||||||||||||||||||||||||||||||||||||||||||||||||||||||||||||||
|
|
|
||||||||||||||||||||||||||||||||||||||||||||||||||||||||||||||||||||||||||||||||
|
Has any standard rent been fixed for the
premises under any law relating to the control of rent? |
It is leasehold property |
||||||||||||||||||||||||||||||||||||||||||||||||||||||||||||||||||||||||||||||||
|
|
|
||||||||||||||||||||||||||||||||||||||||||||||||||||||||||||||||||||||||||||||||
|
Give instances of sales of immovable
property in the locality on a separate sheet, indicating the name and address
of the property, registration No., sale price and area of land sold |
Sale instances are not possible. |
||||||||||||||||||||||||||||||||||||||||||||||||||||||||||||||||||||||||||||||||
|
|
|
||||||||||||||||||||||||||||||||||||||||||||||||||||||||||||||||||||||||||||||||
|
Land rate adopted in this valuation |
Considering the present demand of land
located at such location as on the date of valuation, inquiry made from
prominent estate brokers for particulars area and on personal experience they
suggest the rate of land as Rs. 5000 to 7000 per Sq. Yds. |
||||||||||||||||||||||||||||||||||||||||||||||||||||||||||||||||||||||||||||||||
|
|
|
||||||||||||||||||||||||||||||||||||||||||||||||||||||||||||||||||||||||||||||||
|
Rate of land adopted |
Rs. 5500 per Sq. Yds. |
||||||||||||||||||||||||||||||||||||||||||||||||||||||||||||||||||||||||||||||||
|
|
|
||||||||||||||||||||||||||||||||||||||||||||||||||||||||||||||||||||||||||||||||
|
If sale instances are not available or not
relied upon, the basis of arriving at the land rate |
Instance of sale is not possible but had inquiry
in surrounding area and taken the rate by to experience. |
||||||||||||||||||||||||||||||||||||||||||||||||||||||||||||||||||||||||||||||||
|
|
|
||||||||||||||||||||||||||||||||||||||||||||||||||||||||||||||||||||||||||||||||
|
Year of commencement of construction and
year of completion |
Year of Commencement 2014 |
||||||||||||||||||||||||||||||||||||||||||||||||||||||||||||||||||||||||||||||||
|
|
|
||||||||||||||||||||||||||||||||||||||||||||||||||||||||||||||||||||||||||||||||
|
What was the method of construction-by contract/
by employing labour directly / both? |
Both |
||||||||||||||||||||||||||||||||||||||||||||||||||||||||||||||||||||||||||||||||
|
|
|
||||||||||||||||||||||||||||||||||||||||||||||||||||||||||||||||||||||||||||||||
|
Remarks |
|
||||||||||||||||||||||||||||||||||||||||||||||||||||||||||||||||||||||||||||||||
|
|
|
||||||||||||||||||||||||||||||||||||||||||||||||||||||||||||||||||||||||||||||||
|
VALUATION
CALCULATION VALUE OF LAND Considering the present demand of land in
this locality as on date of valuation, the prominent estate brokers and on
the basis of their experience, they adopt rate of land Rs. 5000 to 7000 per
Sq. Yds.
VALUE OF BUILDING 1. Office and Store Considering the type of construction and materials
used in construction, type of finishing, and considering the past age of
structure, depreciated rate of construction is assessed as under:
As the construction of building is approx. 2
years old, considering the present condition of structure and material used
in construction 1% depreciation per annum is deducted as depreciation for
past age.
2. Production Shed Considering the type of construction and
materials used in construction, type of finishing, and considering the past age
of structure, depreciated rate of construction is assessed as under:
As the construction of building is approx. 2
years old, considering the present condition of structure and material used in
construction 1% depreciation per annum is deducted as depreciation for past
age.
So, the present value of property
This is to certify that the valuation report
is of the right property which was inspected and showed by the owner.
DISTRESS VALUE Distress/ Forced Value is the opinion of the
price at which an assets could be sold under abnormal conditions, the
perception of the seller being under duress to sell, an auction, a liquidation,
recent development, legal complications, or other such factors that
materially reduce the bargaining leverage of the seller and give prospective
buyers a significant advantage that can translate into heavily discounted
leverage of the seller and give and is forced to be sold quickly due to
extraneous conditions.
|
|||||||||||||||||||||||||||||||||||||||||||||||||||||||||||||||||||||||||||||||||
|
ANNEXURE I BRIEF DESCRIPTION OF THE PROPERTY /
TECHNICAL DETAILS |
|||||||||||||||||||||||||||||||||||||||||||||||||||||||||||||||||||||||||||||||||
|
No of floors and height of each floor |
Single Storied Building |
||||||||||||||||||||||||||||||||||||||||||||||||||||||||||||||||||||||||||||||||
|
|
|
||||||||||||||||||||||||||||||||||||||||||||||||||||||||||||||||||||||||||||||||
|
Roofing and terracing |
RCC Sheet |
||||||||||||||||||||||||||||||||||||||||||||||||||||||||||||||||||||||||||||||||
|
|
|
||||||||||||||||||||||||||||||||||||||||||||||||||||||||||||||||||||||||||||||||
|
Plinth area floor - wise [As per IS : 3861 -
1966] |
2100 Sq. Yds. |
||||||||||||||||||||||||||||||||||||||||||||||||||||||||||||||||||||||||||||||||
|
|
|
||||||||||||||||||||||||||||||||||||||||||||||||||||||||||||||||||||||||||||||||
|
Year of Construction |
2014 |
||||||||||||||||||||||||||||||||||||||||||||||||||||||||||||||||||||||||||||||||
|
|
|
||||||||||||||||||||||||||||||||||||||||||||||||||||||||||||||||||||||||||||||||
|
Estimated future life |
50 Years [Subject to Periodic Maintenance] |
||||||||||||||||||||||||||||||||||||||||||||||||||||||||||||||||||||||||||||||||
|
|
|
||||||||||||||||||||||||||||||||||||||||||||||||||||||||||||||||||||||||||||||||
|
Type of construction |
Frame structure |
||||||||||||||||||||||||||||||||||||||||||||||||||||||||||||||||||||||||||||||||
|
|
|
||||||||||||||||||||||||||||||||||||||||||||||||||||||||||||||||||||||||||||||||
|
Type of foundations |
Column footing foundation |
||||||||||||||||||||||||||||||||||||||||||||||||||||||||||||||||||||||||||||||||
|
|
|
||||||||||||||||||||||||||||||||||||||||||||||||||||||||||||||||||||||||||||||||
|
Walls |
Brick / Stone masonry |
||||||||||||||||||||||||||||||||||||||||||||||||||||||||||||||||||||||||||||||||
|
|
|
||||||||||||||||||||||||||||||||||||||||||||||||||||||||||||||||||||||||||||||||
|
Partitions |
Brick masonry |
||||||||||||||||||||||||||||||||||||||||||||||||||||||||||||||||||||||||||||||||
|
|
|
||||||||||||||||||||||||||||||||||||||||||||||||||||||||||||||||||||||||||||||||
|
Door and Windows |
Wooden |
||||||||||||||||||||||||||||||||||||||||||||||||||||||||||||||||||||||||||||||||
|
|
|
||||||||||||||||||||||||||||||||||||||||||||||||||||||||||||||||||||||||||||||||
|
Flooring |
IPS Flooring |
||||||||||||||||||||||||||||||||||||||||||||||||||||||||||||||||||||||||||||||||
|
|
|
||||||||||||||||||||||||||||||||||||||||||||||||||||||||||||||||||||||||||||||||
|
Finishing |
Cement Plaster |
||||||||||||||||||||||||||||||||||||||||||||||||||||||||||||||||||||||||||||||||
|
|
|
||||||||||||||||||||||||||||||||||||||||||||||||||||||||||||||||||||||||||||||||
|
Special architectural or decorative
features, if any |
Not yet done |
||||||||||||||||||||||||||||||||||||||||||||||||||||||||||||||||||||||||||||||||
|
|
|
||||||||||||||||||||||||||||||||||||||||||||||||||||||||||||||||||||||||||||||||
|
Internal Wiring [Surface or Conduit] |
Concealed |
||||||||||||||||||||||||||||||||||||||||||||||||||||||||||||||||||||||||||||||||
|
|
|
||||||||||||||||||||||||||||||||||||||||||||||||||||||||||||||||||||||||||||||||
|
Class of fittings [No. of water closets] |
Ordinary |
||||||||||||||||||||||||||||||||||||||||||||||||||||||||||||||||||||||||||||||||
|
|
|
||||||||||||||||||||||||||||||||||||||||||||||||||||||||||||||||||||||||||||||||
|
Sanitary Installations |
WC / urinals available |
||||||||||||||||||||||||||||||||||||||||||||||||||||||||||||||||||||||||||||||||
|
|
|
||||||||||||||||||||||||||||||||||||||||||||||||||||||||||||||||||||||||||||||||
|
Class of fittings: Superior Coloured /
Superior / White / Ordinary |
Ordinary |
||||||||||||||||||||||||||||||||||||||||||||||||||||||||||||||||||||||||||||||||
|
|
|
||||||||||||||||||||||||||||||||||||||||||||||||||||||||||||||||||||||||||||||||
|
Compound Wall -
Height and length -
Type of Construction |
Brick Masonry 20 ft. ht. length Load bearing construction |
||||||||||||||||||||||||||||||||||||||||||||||||||||||||||||||||||||||||||||||||
|
|
|
||||||||||||||||||||||||||||||||||||||||||||||||||||||||||||||||||||||||||||||||
|
No of Lifts and Capacity |
Not installed |
||||||||||||||||||||||||||||||||||||||||||||||||||||||||||||||||||||||||||||||||
|
|
|
||||||||||||||||||||||||||||||||||||||||||||||||||||||||||||||||||||||||||||||||
|
Underground Pump – capacity and type of
construction |
Capacity 2000 litre R.C.C water tank |
||||||||||||||||||||||||||||||||||||||||||||||||||||||||||||||||||||||||||||||||
|
|
|
||||||||||||||||||||||||||||||||||||||||||||||||||||||||||||||||||||||||||||||||
|
Overhead Tanks -
Where located -
Capacity -
Type of
construction |
Not installed |
||||||||||||||||||||||||||||||||||||||||||||||||||||||||||||||||||||||||||||||||
|
|
|
||||||||||||||||||||||||||||||||||||||||||||||||||||||||||||||||||||||||||||||||
|
Pump No. and their horse power |
2.5 hp |
||||||||||||||||||||||||||||||||||||||||||||||||||||||||||||||||||||||||||||||||
|
|
|
||||||||||||||||||||||||||||||||||||||||||||||||||||||||||||||||||||||||||||||||
|
Roads and paving within the compound, approximate
area and type of paving |
500 Sq. ft. having RCC Trimix |
||||||||||||||||||||||||||||||||||||||||||||||||||||||||||||||||||||||||||||||||
------------------------------------------------------------------------------------------------------------------------------
VALUATION REPORT
(GENERAL DETAILS)
|
Purpose for which valuation is made |
For opine present market value Bank of
India, ITCR Branch, Ahmedabad |
||||||||||||||||||||||||||||||
|
|
|
||||||||||||||||||||||||||||||
|
Date as on which valuation is made |
30.10.2014 |
||||||||||||||||||||||||||||||
|
|
|
||||||||||||||||||||||||||||||
|
Name of the Owner |
Mr. Bhaviben L. Patel |
||||||||||||||||||||||||||||||
|
|
|
||||||||||||||||||||||||||||||
|
Persone/ Contact No. |
Laxmanbhai |
||||||||||||||||||||||||||||||
|
|
|
||||||||||||||||||||||||||||||
|
It the property is under Joint Ownership/ Co
Ownership Share of each such owner. Are the shares undivided? |
Freehold Property |
||||||||||||||||||||||||||||||
|
|
|
||||||||||||||||||||||||||||||
|
Brief description of the property |
As per Annexure II |
||||||||||||||||||||||||||||||
|
|
|
||||||||||||||||||||||||||||||
|
Location, Street, Ward No. |
Plot No. 20 and 21, B/h. Mahakali Industrial
Estate, Village Zak, Ahmedabad |
||||||||||||||||||||||||||||||
|
|
|
||||||||||||||||||||||||||||||
|
Survey / Plot No. of Land |
R.S. No. 357 |
||||||||||||||||||||||||||||||
|
|
|
||||||||||||||||||||||||||||||
|
Is the property situated in the Residential/
Commercial/ Mixed Area/ Industrial Area? |
Developed Industrial Area |
||||||||||||||||||||||||||||||
|
|
|
||||||||||||||||||||||||||||||
|
Classification of Locality – High class/
Middle Class/ Poor class? |
Middle Class Locality |
||||||||||||||||||||||||||||||
|
|
|
||||||||||||||||||||||||||||||
|
Proximity to civic amenities like School,
Hospitals, cinema etc. |
Hospital, Schools, Colleges, Shops Clinics
are available within nearby area. |
||||||||||||||||||||||||||||||
|
|
|
||||||||||||||||||||||||||||||
|
Proximities to civic amenities -
School -
Hospital -
Office -
Market -
Airport |
Nearby area Nearby area Nearby area Nearby area Approx. 50 Km |
||||||||||||||||||||||||||||||
|
|
|
||||||||||||||||||||||||||||||
|
Means and proximity to surface communication
by the locality is served |
Bus routes available, rickshaws and private
vehicles can easily approach the site. |
||||||||||||||||||||||||||||||
|
|
|
||||||||||||||||||||||||||||||
|
Area of land supported by documentary proof,
shape dimensions and physical features |
2078.58 Sq. Mt. 2485.98 Sq. Yds. [As per document produced] |
||||||||||||||||||||||||||||||
|
|
|
||||||||||||||||||||||||||||||
|
Orientation of Site |
|
||||||||||||||||||||||||||||||
|
|
|
||||||||||||||||||||||||||||||
|
Is it leasehold the name of lessor/ lessee,
nature of lease, dates of commencement and termination of lease and terms of
renewal of lease: -
Initial premium -
Ground rent payable per
annum -
Unearned increase payable
to the lessor in the event of sale or transfer |
Freehold property |
||||||||||||||||||||||||||||||
|
|
|
||||||||||||||||||||||||||||||
|
Is there any restrictive convenant in regard
to use of land? If so, attach a copy of the convenant. |
At present no, for further information. |
||||||||||||||||||||||||||||||
|
|
|
||||||||||||||||||||||||||||||
|
Does the land fall in an area included in
any town planning scheme or any development plan of government or any
statutory body? If so, give particulars |
The does not fall in any T.P. Scheme. |
||||||||||||||||||||||||||||||
|
|
|
||||||||||||||||||||||||||||||
|
Has any contribution been made towards development
or is any demand for such contribution still outstanding? |
At present no, for further information. |
||||||||||||||||||||||||||||||
|
|
|
||||||||||||||||||||||||||||||
|
Has the whole or part of land been notified
for acquisition by government or any statutory body? Give date of the
notification |
At present no, for further information. |
||||||||||||||||||||||||||||||
|
|
|
||||||||||||||||||||||||||||||
|
Furnish technical details of the building on
a separate sheet [The annexure to this form may be used] |
As per Annexure II |
||||||||||||||||||||||||||||||
|
|
|
||||||||||||||||||||||||||||||
|
Is the building owner-occupied / tenanted /
both? |
Freehold |
||||||||||||||||||||||||||||||
|
|
|
||||||||||||||||||||||||||||||
|
If partly owner-occupied, specify portion
and extent of area under owner-occupation |
Owner Occupied |
||||||||||||||||||||||||||||||
|
|
|
||||||||||||||||||||||||||||||
|
What is the floor space index permissible
and percentage actually utilized? |
As per Concern Authority |
||||||||||||||||||||||||||||||
|
|
|
||||||||||||||||||||||||||||||
|
-
Names of
tenants/lessees etc. -
Portion in their
occupation -
Monthly or annual rent/
Compensation/ licence fee etc. paid by each -
Gross amount received
for the whole property |
Owner Occupied at present |
||||||||||||||||||||||||||||||
|
|
|
||||||||||||||||||||||||||||||
|
Are any of the occupants related to, or close
business associates of the owner? |
At present no. |
||||||||||||||||||||||||||||||
|
|
|
||||||||||||||||||||||||||||||
|
Is separate amount being recovered for the
use of fixtures like fans, geysers, refrigerators, cooking ganges, built in
wardrobes etc. or for service charges? If so, give details |
Yes, But it included in Cost of
Construction. |
||||||||||||||||||||||||||||||
|
|
|
||||||||||||||||||||||||||||||
|
Give details of water and electricity
charges, if any, to be borne by the owner |
Not Produced |
||||||||||||||||||||||||||||||
|
|
|
||||||||||||||||||||||||||||||
|
Has the tenant to bear the whole or part of the
cost of repairs and maintenance? Give particulars |
Freehold bear the Cost |
||||||||||||||||||||||||||||||
|
|
|
||||||||||||||||||||||||||||||
|
If a lift is installed, who is to bear the
Cost of maintenance and operation-owner or tenant? |
It is Open plot |
||||||||||||||||||||||||||||||
|
|
|
||||||||||||||||||||||||||||||
|
Is a pump is installed, who is to bear the
Cost of maintenance and operation-owner or tenant? |
Bear by the Owner |
||||||||||||||||||||||||||||||
|
|
|
||||||||||||||||||||||||||||||
|
Who has to bear the Cost of electricity
charges for lighting of common space like entrance hall, stairs, passages,
compound, etc. owner or tenant? |
Bear by the Owner |
||||||||||||||||||||||||||||||
|
|
|
||||||||||||||||||||||||||||||
|
What is the amount of property tax? Who is
to bear it? Give details with documentary proof |
Not Produced |
||||||||||||||||||||||||||||||
|
|
|
||||||||||||||||||||||||||||||
|
Is any dispute between landlord and tenant
regarding rent pending in a court of law? |
It is Owner occupied property |
||||||||||||||||||||||||||||||
|
|
|
||||||||||||||||||||||||||||||
|
Has any standard rent been fixed for the
premises under any law relating to the control of rent? |
It is leasehold property |
||||||||||||||||||||||||||||||
|
|
|
||||||||||||||||||||||||||||||
|
Give instances of sales of immovable property
in the locality on a separate sheet, indicating the name and address of the
property, registration No., sale price and area of land sold |
Sale instances are not possible. |
||||||||||||||||||||||||||||||
|
|
|
||||||||||||||||||||||||||||||
|
Land rate adopted in this valuation |
Considering the present demand of land
located at such location as on the date of valuation, inquiry made from
prominent estate brokers for particulars area and on personal experience they
suggest the rate of land as Rs. 5000 to 7000 per Sq. Yds. |
||||||||||||||||||||||||||||||
|
|
|
||||||||||||||||||||||||||||||
|
Rate of land adopted |
Rs. 5000 per Sq. Yds. |
||||||||||||||||||||||||||||||
|
|
|
||||||||||||||||||||||||||||||
|
If sale instances are not available or not
relied upon, the basis of arriving at the land rate |
Instance of sale is not possible but had
inquiry in surrounding area and taken the rate by to experience. |
||||||||||||||||||||||||||||||
|
|
|
||||||||||||||||||||||||||||||
|
Year of commencement of construction and
year of completion |
Open plot |
||||||||||||||||||||||||||||||
|
|
|
||||||||||||||||||||||||||||||
|
What was the method of construction-by
contract/ by employing labour directly / both? |
Both |
||||||||||||||||||||||||||||||
|
|
|
||||||||||||||||||||||||||||||
|
Remarks |
|
||||||||||||||||||||||||||||||
|
|
|
||||||||||||||||||||||||||||||
|
VALUATION
CALCULATION VALUE OF LAND Considering the present demand of land in this
locality as on date of valuation, the prominent estate brokers and on the
basis of their experience, they adopt rate of land Rs. 5000 to 7000 per Sq.
Yds.
So, the present value of property
This is to certify that the valuation report
is of the right property which was inspected and showed by the owner.
DISTRESS VALUE Distress/ Forced Value is the opinion of the
price at which an assets could be sold under abnormal conditions, the
perception of the seller being under duress to sell, an auction, a liquidation,
recent development, legal complications, or other such factors that
materially reduce the bargaining leverage of the seller and give prospective
buyers a significant advantage that can translate into heavily discounted
leverage of the seller and give and is forced to be sold quickly due to
extraneous conditions.
|
|||||||||||||||||||||||||||||||
|
ANNEXURE II BRIEF DESCRIPTION OF THE PROPERTY / TECHNICAL
DETAILS |
|||||||||||||||||||||||||||||||
|
No of floors and height of each floor |
It is open plot |
||||||||||||||||||||||||||||||
|
|
|
||||||||||||||||||||||||||||||
|
Roofing and terracing |
It is open plot |
||||||||||||||||||||||||||||||
|
|
|
||||||||||||||||||||||||||||||
|
Plinth area floor - wise [As per IS : 3861 -
1966] |
2485.98 Sq. Yds. |
||||||||||||||||||||||||||||||
|
|
|
||||||||||||||||||||||||||||||
|
Year of Construction |
It is open plot |
||||||||||||||||||||||||||||||
|
|
|
||||||||||||||||||||||||||||||
|
Estimated future life |
It is open plot [Subject to Periodic Maintenance] |
||||||||||||||||||||||||||||||
|
|
|
||||||||||||||||||||||||||||||
|
Type of construction |
It is open plot |
||||||||||||||||||||||||||||||
|
|
|
||||||||||||||||||||||||||||||
|
Type of foundations |
It is open plot |
||||||||||||||||||||||||||||||
|
|
|
||||||||||||||||||||||||||||||
|
Walls |
It is open plot |
||||||||||||||||||||||||||||||
|
|
|
||||||||||||||||||||||||||||||
|
Partitions |
It is open plot |
||||||||||||||||||||||||||||||
|
|
|
||||||||||||||||||||||||||||||
|
Door and Windows |
It is open plot |
||||||||||||||||||||||||||||||
|
|
|
||||||||||||||||||||||||||||||
|
Flooring |
It is open plot |
||||||||||||||||||||||||||||||
|
|
|
||||||||||||||||||||||||||||||
|
Finishing |
It is open plot |
||||||||||||||||||||||||||||||
|
|
|
||||||||||||||||||||||||||||||
|
Special architectural or decorative
features, if any |
It is open plot |
||||||||||||||||||||||||||||||
|
|
|
||||||||||||||||||||||||||||||
|
Internal Wiring [Surface or Conduit] |
It is open plot |
||||||||||||||||||||||||||||||
|
|
|
||||||||||||||||||||||||||||||
|
Class of fittings [No. of water closets] |
It is open plot |
||||||||||||||||||||||||||||||
|
|
|
||||||||||||||||||||||||||||||
|
Sanitary Installations |
It is open plot |
||||||||||||||||||||||||||||||
|
|
|
||||||||||||||||||||||||||||||
|
Class of fittings: Superior Coloured /
Superior / White / Ordinary |
It is open plot |
||||||||||||||||||||||||||||||
|
|
|
||||||||||||||||||||||||||||||
|
Compound Wall -
Height and length -
Type of Construction |
RCC Brick Masonry 3 ft. height Load bearing |
||||||||||||||||||||||||||||||
|
|
|
||||||||||||||||||||||||||||||
|
No of Lifts and Capacity |
It is open plot |
||||||||||||||||||||||||||||||
|
|
|
||||||||||||||||||||||||||||||
|
Underground Pump – capacity and type of
construction |
It is open plot |
||||||||||||||||||||||||||||||
|
|
|
||||||||||||||||||||||||||||||
|
Overhead Tanks -
Where located -
Capacity -
Type of
construction |
It is open plot |
||||||||||||||||||||||||||||||
|
|
|
||||||||||||||||||||||||||||||
|
Pump No. and their horse power |
It is open plot |
||||||||||||||||||||||||||||||
|
|
|
||||||||||||||||||||||||||||||
|
Roads and paving within the compound,
approximate area and type of paving |
It is open plot |
||||||||||||||||||||||||||||||
------------------------------------------------------------------------------------------------------------------------------
INDEX OF CHARGES: NO
CHARGES EXIST FOR COMPANY
------------------------------------------------------------------------------------------------------------------------------
CMT REPORT (Corruption, Money Laundering & Terrorism]
The Public Notice information has been collected from various sources
including but not limited to: The Courts,
1] INFORMATION ON
DESIGNATED PARTY
No exist designating subject or any of its beneficial owners,
controlling shareholders or senior officers as terrorist or terrorist organization
or whom notice had been received that all financial transactions involving
their assets have been blocked or convicted, found guilty or against whom a
judgement or order had been entered in a proceedings for violating
money-laundering, anti-corruption or bribery or international economic or
anti-terrorism sanction laws or whose assets were seized, blocked, frozen or
ordered forfeited for violation of money laundering or international
anti-terrorism laws.
2] Court Declaration :
No exist to suggest that subject is or was
the subject of any formal or informal allegations, prosecutions or other
official proceeding for making any prohibited payments or other improper
payments to government officials for engaging in prohibited transactions or
with designated parties.
3] Asset Declaration :
No records exist to suggest that the property or assets of the subject
are derived from criminal conduct or a prohibited transaction.
4] Record on Financial
Crime :
Charges or conviction
registered against subject: None
5] Records on Violation of
Anti-Corruption Laws :
Charges or
investigation registered against subject: None
6] Records on Int’l
Anti-Money Laundering Laws/Standards :
Charges or
investigation registered against subject: None
7] Criminal Records
No
available information exist that suggest that subject or any of its principals
have been formally charged or convicted by a competent governmental authority
for any financial crime or under any formal investigation by a competent government
authority for any violation of anti-corruption laws or international anti-money
laundering laws or standard.
8] Affiliation with
Government :
No record
exists to suggest that any director or indirect owners, controlling
shareholders, director, officer or employee of the company is a government
official or a family member or close business associate of a Government
official.
9] Compensation Package :
Our market
survey revealed that the amount of compensation sought by the subject is fair
and reasonable and comparable to compensation paid to others for similar
services.
10] Press Report :
No press reports / filings exists on
the subject.
CORPORATE GOVERNANCE
MIRA INFORM as part of its Due Diligence do provide comments on
Corporate Governance to identify management and governance. These factors often
have been predictive and in some cases have created vulnerabilities to credit
deterioration.
Our Governance Assessment focuses principally on the interactions
between a company’s management, its Board of Directors, Shareholders and other
financial stakeholders.
CONTRAVENTION
Subject is not known to have contravened any existing local laws,
regulations or policies that prohibit, restrict or otherwise affect the terms
and conditions that could be included in the agreement with the subject.
FOREIGN EXCHANGE RATES
|
Currency |
Unit
|
Indian Rupees |
|
US Dollar |
1 |
Rs. 61.93 |
|
|
1 |
Rs. 97.39 |
|
Euro |
1 |
Rs. 77.21 |
INFORMATION DETAILS
|
Information
Gathered by : |
HNA |
|
|
|
|
Analysis Done by
: |
KAR |
|
|
|
|
Report Prepared
by : |
BVA |
RATING EXPLANATIONS
|
RATING |
STATUS |
PROPOSED CREDIT LINE |
|
|
>86 |
Aaa |
Possesses an extremely sound financial base with the strongest capability
for timely payment of interest and principal sums |
Unlimited |
|
71-85 |
Aa |
Possesses adequate working capital. No caution needed for credit
transaction. It has above average (strong) capability for payment of interest
and principal sums |
Large |
|
56-70 |
A |
Financial & operational base are regarded healthy. General
unfavourable factors will not cause fatal effect. Satisfactory capability for
payment of interest and principal sums |
Fairly Large |
|
41-55 |
Ba |
Overall operation is considered normal. Capable to meet normal
commitments. |
Satisfactory |
|
26-40 |
B |
Capability to overcome financial difficulties seems comparatively
below average. |
Small |
|
11-25 |
Ca |
Adverse factors are apparent. Repayment of interest and principal sums
in default or expected to be in default upon maturity |
Limited with
full security |
|
<10 |
C |
Absolute credit risk exists. Caution needed to be exercised |
Credit not
recommended |
|
-- |
NB |
New Business |
-- |
This report is issued at your request without any
risk and responsibility on the part of MIRA INFORM PRIVATE LIMITED (MIPL)
or its officials.