MIRA
INFORM REPORT
|
Report Date : |
04.12.2014 |
IDENTIFICATION DETAILS
|
Name : |
LAWRENCE BLUNT LIMITED |
|
|
|
|
Registered Office : |
Shelley Stock Hutter 1st Floor 7-10 Chandos Street W1G9DQ |
|
|
|
|
Country : |
|
|
|
|
|
Financials (as on) : |
31.05.2013 |
|
|
|
|
Date of Incorporation : |
13.01.1989 |
|
|
|
|
Legal Form : |
Private limited with Share Capital |
|
|
|
|
Line of Business : |
Importer, manufacture and distribution of jewellery |
|
|
|
|
No. of Employees |
Not Available |
RATING & COMMENTS
|
MIRA’s Rating : |
Ba |
|
RATING |
STATUS |
PROPOSED CREDIT LINE |
|
|
41-55 |
Ba |
Overall operation is considered normal. Capable to meet normal
commitments. |
Satisfactory |
|
Status : |
Satisfactory |
|
Payment Behaviour : |
No complaints |
|
Litigation : |
Clear |
NOTES :
Any query related to this report can be made
on e-mail : infodept@mirainform.com
while quoting report number, name and date.
ECGC Country Risk Classification List – June 1, 2014
|
Country Name |
Previous Rating (31.03.2014) |
Current Rating (01.06.2014) |
|
United Kingdom |
A1 |
A1 |
|
Risk Category |
ECGC
Classification |
|
Insignificant |
A1 |
|
Low |
A2 |
|
Moderate |
B1 |
|
High |
B2 |
|
Very High |
C1 |
|
Restricted |
C2 |
|
Off-credit |
D |
UNITED KINGDOM ECONOMIC
OVERVIEW
The UK, a leading trading power and financial center, is the third largest economy in Europe after Germany and France. Over the past two decades, the government has greatly reduced public ownership. Agriculture is intensive, highly mechanized, and efficient by European standards, producing about 60% of food needs with less than 2% of the labor force. The UK has large coal, natural gas, and oil resources, but its oil and natural gas reserves are declining and the UK became a net importer of energy in 2005. Services, particularly banking, insurance, and business services, are key drivers of British GDP growth. Manufacturing, meanwhile, has declined in importance but still accounts for about 10% of economic output. After emerging from recession in 1992, Britain's economy enjoyed the longest period of expansion on record during which time growth outpaced most of Western Europe. In 2008, however, the global financial crisis hit the economy particularly hard, due to the importance of its financial sector. Falling home prices, high consumer debt, and the global economic slowdown compounded Britain's economic problems, pushing the economy into recession in the latter half of 2008 and prompting the then BROWN (Labour) government to implement a number of measures to stimulate the economy and stabilize the financial markets; these included nationalizing parts of the banking system, temporarily cutting taxes, suspending public sector borrowing rules, and moving forward public spending on capital projects. Facing burgeoning public deficits and debt levels, in 2010 the CAMERON-led coalition government (between Conservatives and Liberal Democrats) initiated a five-year austerity program, which aimed to lower London's budget deficit from about 11% of GDP in 2010 to nearly 1% by 2015. In November 2011, Chancellor of the Exchequer George OSBORNE announced additional austerity measures through 2017 largely due to the euro-zone debt crisis. The CAMERON government raised the value added tax from 17.5% to 20% in 2011. It has pledged to reduce the corporation tax rate to 21% by 2014. The Bank of England (BoE) implemented an asset purchase program of £375 billion (approximately $605 billion) as of December 2013. During times of economic crisis, the BoE coordinates interest rate moves with the European Central Bank, but Britain remains outside the European Economic and Monetary Union (EMU). In 2012, weak consumer spending and subdued business investment weighed on the economy, however, in 2013 GDP grew 1.4%, accelerating unexpectedly in the second half of the year because of greater consumer spending and a recovering housing market. The budget deficit is falling but remains high at nearly 7% and public debt has continued to increase
|
Source
: CIA |
Company name and address
LAWRENCE BLUNT
LIMITED
|
Registered Address |
Shelley Stock Hutter 1st Floor 7-10 Chandos Street W1G9DQ |
Trading Address |
1st Floor 7-10 Chandos Street W1G9DQ |
|
|
|
|
|
|
Website Address |
Office Address |
57 A Hatton Garden, 2nd Floor, Petersham House, London ECIN8JG |
|
|
Telephone Number |
- |
Fax Nos |
02078315773 |
|
TPS |
- |
FPS |
Yes |
|
Incorporation Date |
13.01.1989 |
Company Status |
Active - Accounts Filed |
|
Previous Name |
|
Type |
Private limited with Share Capital |
|
Share Capital |
£315 |
Filing Date of Accounts |
20.12.2013 |
|
Currency |
GBP |
|
|
|
SIC03 Description |
Precious metal production |
||
|
SIC07 |
24410 |
||
|
Principal Activity |
Importer, manufacture and distribution of jewellery. |
||
|
|
|
||
DIRECTORS/MANAGEMENT
Current Directors
|
Name |
Clive Newton Ross Field |
Date of Birth |
14/12/1949 |
|
Officers Title |
Mr |
Nationality |
British |
|
Present Appointments |
5 |
Function |
Director |
|
Appointment Date |
01/10/1992 |
|
|
|
Address |
Magnolia House, 24 Forest Lane, Chigwell, Essex, IG7 5AE |
||
|
Name |
Laurence James Blunt |
Date of Birth |
16/02/1958 |
|
Officers Title |
Mr |
Nationality |
British |
|
Present Appointments |
8 |
Function |
Director |
|
Appointment Date |
09/07/1991 |
|
|
|
Address |
20 Penington Road, Beaconsfield, Buckinghamshire, HP9 1ET |
||
|
Name |
Richard Charles Blunt |
Date of Birth |
18/04/1956 |
|
Officers Title |
Mr |
Nationality |
British |
|
Present Appointments |
13 |
Function |
Director |
|
Appointment Date |
09/07/1991 |
|
|
|
Address |
Reynolds, Nugents Park, Hatch End, Middlesex, HA5 4RA |
||
Current Company Secretary
|
Name |
Richard Charles Blunt |
Date of Birth |
18/04/1956 |
|
Officers Title |
Mr |
Nationality |
British |
|
Present Appointments |
13 |
Function |
Company Secretary |
|
Appointment Date |
09/07/1991 |
|
|
|
Address |
Reynolds, Nugents Park, Hatch End, Middlesex, HA5 4RA |
||
Previous Director/Company Secretaries
|
No Previous Director Details |
NEGATIVE INFORMATION
Mortgage
Total Mortgage 5
Outstanding 1
Satisfied 4
Trade Debtors / Bad Debt Summary
Total Number of Documented Trade 0
Total Value of Documented Trade £0
Exact CCJ Details
|
No CCJs found |
Possible CCJs Details
|
There are no possible CCJ details |
Writ Details
|
No writs found |
Mortgage Details
|
Mortgage Type: |
DEBENTURE |
||
|
Date Charge Created: |
23/04/96 |
|
|
|
Date Charge Registered: |
29/04/96 |
|
|
|
Date Charge Satisfied: |
- |
|
|
|
Status: |
OUTSTANDING |
|
|
|
Person(s) Entitled: |
BARCLAYS BANK PLC |
||
|
Amount Secured: |
ALL MONIES DUE OR TO BECOME DUE FROM THE COMPANY TO THE CHARGEE ON ANY ACCOUNT WHATSOEVER |
||
|
Details: |
FIXED AND FLOATING CHARGES OVER THE UNDERTAKING AND ALL PROPERTY AND ASSETS PRESENT AND FUTURE INCLUDING GOODWILL BOOKDEBTS UNCALLED CAPITAL BUILDINGS FIXTURESFIXED PLANT AND MACHINERY |
||
|
Mortgage Type: |
DEBENTURE |
||
|
Date Charge Created: |
30/07/93 |
|
|
|
Date Charge Registered: |
12/08/93 |
|
|
|
Date Charge Satisfied: |
12/12/97 |
|
|
|
Status: |
SATISFIED |
|
|
|
Person(s) Entitled: |
AITKEN HUME BANK PLC |
||
|
Amount Secured: |
ALL MONIES DUE OR TO BECOME DUE FROM THE COMPANY TO THE CHARGEE ON ANY ACCOUNT WHATSOEVER |
||
|
Details: |
FIXED AND FLOATING CHARGES OVER THE UNDERTAKING AND ALL PROPERTY AND ASSETS PRESENT AND FUTURE INCLUDING GOODWILL BOOKDEBTS UNCALLED CAPITAL BUILDINGS FIXTURESFIXED PLANT AND MACHINERY |
||
|
Mortgage Type: |
GUARANTEE & DEBENTURE |
||
|
Date Charge Created: |
17/07/92 |
|
|
|
Date Charge Registered: |
31/07/92 |
|
|
|
Date Charge Satisfied: |
14/10/93 |
|
|
|
Status: |
SATISFIED |
|
|
|
Person(s) Entitled: |
BARCLAYS BANK PLC |
||
|
Amount Secured: |
ALL MONIES DUE OR TO BECOME DUE FROM THECOMPANY AND/OR SONNENTHAL CHAIN LIMITEDTO THE CHARGEE ON ANYACCOUNT WHATSOEVER |
||
|
Details: |
SEE FORM 395 REF M562C FIXED AND FLOATING CHARGES OVER THE UNDERTAKING AND ALL PROPERTY AND ASSETS PRESENT AND FUTURE INCLUDING GOODWILL BOOKDEBTS UNCALLED CAPITAL BUILDINGS FIXTURES FIXED PLANT AND MACHINERY |
||
|
Mortgage Type: |
DEBENTURE |
||
|
Date Charge Created: |
14/03/91 |
|
|
|
Date Charge Registered: |
22/03/91 |
|
|
|
Date Charge Satisfied: |
14/10/93 |
|
|
|
Status: |
SATISFIED |
|
|
|
Person(s) Entitled: |
BARCLAYS BANK PLC |
||
|
Amount Secured: |
ALL MONIES DUE OR TO BECOME DUE FROM THE COMPANY TO THE CHARGEE ON ANY ACCOUNT WHATSOEVER |
||
|
Details: |
FIXED AND FLOATING CHARGES OVER THE UNDERTAKING AND ALL PROPERTY AND ASSETS PRESENT AND FUTURE INCLUDING GOODWILL BOOKDEBTS UNCALLED CAPITAL BUILDINGS FIXTURESFIXED PLANT AND MACHINERY |
||
|
Mortgage Type: |
DEBENTURE |
||
|
Date Charge Created: |
03/07/89 |
|
|
|
Date Charge Registered: |
11/07/89 |
|
|
|
Date Charge Satisfied: |
16/03/93 |
|
|
|
Status: |
SATISFIED |
|
|
|
Person(s) Entitled: |
THE ROYAL BANK OF SCOTLAND PLC |
||
|
Amount Secured: |
ALL MONIES DUE OR TO BECOME DUE FROM THE COMPANY TO THE CHARGEE ON ANY ACCOUNT WHATSOEVER |
||
|
Details: |
FIXED AND FLOATING CHARGES OVER THE UNDERTAKING AND ALL PROPERTY AND ASSETS PRESENT AND FUTURE INCLUDING GOODWILL BOOKDEBTS UNCALLED CAPITAL FIXTURES & FITTINGS FIXED PLANT AND MACHINERY |
||
SHARE & SHARE CAPITAL INFORMATION
Top 20 Shareholders
|
Name |
Currency |
Share Count |
Share Type |
Nominal Value |
% of Total Share Count |
|
CLIVE NEWTON ROSS FIELD |
GBP |
105 |
ORDINARY |
1 |
33.33 |
|
RICHARD BLUNT |
GBP |
105 |
ORDINARY |
1 |
33.33 |
|
MR LAURENCE JAMES BLUNT |
GBP |
105 |
ORDINARY |
1 |
33.33 |
PAYMENT INFORMATION
|
Average Invoice Value |
£70.29 |
|
Invoices available |
14 |
|
Paid |
14 |
|
Outstanding |
0 |
|
Trade Payment Data is information that we collect from selected third party partners who send us information about their whole sales ledger. |
|
|
Within Terms |
0-30 Days |
31-60 Days |
61-90 Days |
91+ Days |
|
Paid |
13 |
0 |
1 |
0 |
0 |
|
Outstanding |
0 |
0 |
0 |
0 |
0 |
GROUP STRUCTURE & AFFILIATED COMPANIES
Summary
|
Holding Company |
LAWRENCE BLUNT LIMITED |
|
Ownership Status |
Ultimately Owned |
|
Ultimate Holding Company |
LAWRENCE BLUNT LIMITED |
Group structure
|
Company Name |
Registered Number |
Latest Key Financials |
Consol. Accounts |
Turnover |
|
|
02334973 |
31.05.2013 |
N |
|
|
|
08048327 |
31.05.2013 |
N |
|
FINANCIAL INFORMATION
Profit & Loss
|
Date Of Accounts |
31/05/13 |
(%) |
31/05/12 |
(%) |
31/05/11 |
(%) |
31/05/10 |
(%) |
31/05/09 |
|
Weeks |
52 |
(%) |
52 |
(%) |
52 |
(%) |
52 |
(%) |
52 |
|
Currency |
GBP |
(%) |
GBP |
(%) |
GBP |
(%) |
GBP |
(%) |
GBP |
|
Consolidated A/cs |
N |
(%) |
N |
(%) |
N |
(%) |
N |
(%) |
N |
|
Turnover |
- |
- |
- |
- |
- |
- |
£6,454,027 |
-15.3% |
£7,619,598 |
|
Export |
- |
- |
- |
- |
- |
- |
£293,459 |
-5.8% |
£311,492 |
|
Cost of Sales |
- |
- |
- |
- |
- |
-100% |
£4,947,483 |
-20.9% |
£6,251,159 |
|
Gross Profit |
- |
- |
- |
- |
- |
- |
£1,506,544 |
10.1% |
£1,368,439 |
|
Wages & Salaries |
- |
- |
- |
- |
- |
- |
£637,690 |
4.7% |
£608,806 |
|
Directors Emoluments |
- |
- |
- |
- |
- |
- |
- |
- |
£112,036 |
|
Operating Profit |
- |
- |
- |
- |
- |
- |
£436,863 |
65.4% |
£264,140 |
|
Depreciation |
£57,823 |
-19.7% |
£71,975 |
10.1% |
£65,354 |
116.6% |
£30,169 |
-12.4% |
£34,429 |
|
Audit Fees |
- |
- |
- |
- |
- |
- |
£14,250 |
-19.1% |
£17,625 |
|
Interest Payments |
- |
- |
- |
- |
- |
- |
£11,185 |
-54.4% |
£24,507 |
|
Pre Tax Profit |
- |
- |
- |
- |
- |
- |
£425,691 |
77.6% |
£239,633 |
|
Taxation |
- |
- |
- |
- |
- |
- |
-£124,331 |
-73.7% |
-£71,589 |
|
Profit After Tax |
- |
- |
- |
- |
- |
- |
£301,360 |
79.3% |
£168,044 |
|
Dividends Payable |
- |
- |
- |
- |
- |
- |
£300,000 |
- |
- |
|
Retained Profit |
- |
- |
- |
- |
- |
- |
£1,360 |
-99.2% |
£168,044 |
Balance Sheet
|
Date Of Accounts |
31/05/13 |
(%) |
31/05/12 |
(%) |
31/05/11 |
(%) |
31/05/10 |
(%) |
31/05/09 |
|
Tangible Assets |
£190,674 |
-2.1% |
£194,700 |
-24.3% |
£257,256 |
157.8% |
£99,785 |
-3.4% |
£103,286 |
|
Intangible Assets |
0 |
- |
0 |
- |
0 |
- |
0 |
- |
0 |
|
Total Fixed Assets |
£190,674 |
-2.1% |
£194,700 |
-24.3% |
£257,256 |
157.8% |
£99,785 |
-3.4% |
£103,286 |
|
Stock |
£750,048 |
13.8% |
£659,335 |
-10.7% |
£737,985 |
-36.2% |
£1,155,918 |
-45.3% |
£2,112,022 |
|
Trade Debtors |
£1,069,369 |
-29.5% |
£1,517,107 |
50.2% |
£1,010,087 |
-36.7% |
£1,596,083 |
20.5% |
£1,324,153 |
|
Cash |
£1,023,291 |
-31.1% |
£1,485,188 |
54.4% |
£961,874 |
999.9% |
£21,213 |
- |
0 |
|
Other Debtors |
0 |
- |
0 |
- |
0 |
-100% |
£58,449 |
-5.1% |
£61,580 |
|
Miscellaneous Current Assets |
0 |
- |
0 |
- |
0 |
- |
0 |
- |
0 |
|
Total Current Assets |
£2,842,708 |
-22.4% |
£3,661,630 |
35.1% |
£2,709,946 |
-4.3% |
£2,831,663 |
-19% |
£3,497,755 |
|
Trade Creditors |
£848,098 |
-55.3% |
£1,898,099 |
57.9% |
£1,202,234 |
31.8% |
£912,452 |
-25.8% |
£1,229,841 |
|
Bank Loans & Overdrafts |
0 |
- |
0 |
- |
0 |
- |
0 |
-100% |
£570,087 |
|
Other Short Term Finance |
0 |
- |
0 |
- |
0 |
- |
0 |
-100% |
£6,819 |
|
Miscellaneous Current Liabilities |
0 |
- |
0 |
- |
0 |
-100% |
£496,236 |
81.8% |
£272,894 |
|
Total Current Liabilities |
£848,098 |
-55.3% |
£1,898,099 |
57.9% |
£1,202,234 |
-14.7% |
£1,408,688 |
-32.3% |
£2,079,641 |
|
Bank Loans & Overdrafts and LTL |
0 |
- |
0 |
- |
0 |
- |
0 |
-100% |
£570,087 |
|
Other Long Term Finance |
0 |
- |
0 |
- |
0 |
- |
0 |
- |
0 |
|
Total Long Term Liabilities |
0 |
- |
0 |
- |
0 |
- |
0 |
- |
0 |
.
Capital &
Reserves
|
Date Of Accounts |
31/05/13 |
(%) |
31/05/12 |
(%) |
31/05/11 |
(%) |
31/05/10 |
(%) |
31/05/09 |
|
Called Up Share Capital |
£315 |
- |
£315 |
- |
£315 |
- |
£315 |
- |
£315 |
|
P & L Account Reserve |
£2,085,039 |
12.2% |
£1,857,986 |
11.6% |
£1,664,723 |
17% |
£1,422,515 |
0.1% |
£1,421,155 |
|
Revaluation Reserve |
- |
- |
- |
- |
- |
- |
- |
- |
- |
|
Sundry Reserves |
£99,930 |
- |
£99,930 |
- |
£99,930 |
- |
£99,930 |
- |
£99,930 |
|
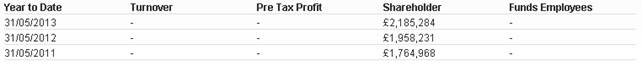
Shareholder Funds |
£2,185,284 |
11.6% |
£1,958,231 |
10.9% |
£1,764,968 |
15.9% |
£1,522,760 |
0.1% |
£1,521,400 |
Other Financial Items
|
Date Of Accounts |
31/05/13 |
(%) |
31/05/12 |
(%) |
31/05/11 |
(%) |
31/05/10 |
(%) |
31/05/09 |
|
Net Worth |
£2,185,284 |
11.6% |
£1,958,231 |
10.9% |
£1,764,968 |
15.9% |
£1,522,760 |
0.1% |
£1,521,400 |
|
Working Capital |
£1,994,610 |
13.1% |
£1,763,531 |
17% |
£1,507,712 |
6% |
£1,422,975 |
0.3% |
£1,418,114 |
|
Total Assets |
£3,033,382 |
-21.3% |
£3,856,330 |
30% |
£2,967,202 |
1.2% |
£2,931,448 |
-18.6% |
£3,601,041 |
|
Total Liabilities |
£848,098 |
-55.3% |
£1,898,099 |
57.9% |
£1,202,234 |
-14.7% |
£1,408,688 |
-32.3% |
£2,079,641 |
|
Net Assets |
£2,185,284 |
11.6% |
£1,958,231 |
10.9% |
£1,764,968 |
15.9% |
£1,522,760 |
0.1% |
£1,521,400 |
Cash Flow
|
Date Of Accounts |
31/05/13 |
(%) |
31/05/12 |
(%) |
31/05/11 |
(%) |
31/05/10 |
(%) |
31/05/09 |
|
Net Cashflow from Operations |
- |
- |
- |
- |
- |
- |
£1,007,538 |
999.9% |
-£87,615 |
|
Net Cashflow before Financing |
- |
- |
- |
- |
- |
-100% |
£598,119 |
574% |
-£126,190 |
|
Net Cashflow from Financing |
- |
- |
- |
- |
- |
- |
-£6,819 |
66.2% |
-£20,202 |
|
Increase in Cash |
- |
- |
- |
- |
- |
- |
£591,300 |
503.9% |
-£146,392 |
Miscellaneous
|
Date Of Accounts |
31/05/13 |
(%) |
31/05/12 |
(%) |
31/05/11 |
(%) |
31/05/10 |
(%) |
31/05/09 |
|
Contingent Liability |
NO |
- |
NO |
- |
NO |
- |
NO |
- |
NO |
|
Capital Employed |
£2,185,284 |
11.6% |
£1,958,231 |
10.9% |
£1,764,968 |
15.9% |
£1,522,760 |
0.1% |
£1,521,400 |
|
Number of Employees |
- |
- |
- |
- |
- |
- |
18 |
5.9% |
17 |
|
Auditors |
|
||||||||
|
Auditor Comments |
The company is exempt from audit |
||||||||
|
Bankers |
BARCLAYS BANK PLC |
||||||||
|
Bank Branch Code |
|
||||||||
Ratios
|
Date Of Accounts |
31/05/13 |
31/05/12 |
31/05/11 |
31/05/10 |
31/05/09 |
|
Pre-tax profit margin % |
- |
- |
- |
6.60 |
3.14 |
|
Current ratio |
3.35 |
1.93 |
2.25 |
2.01 |
1.68 |
|
Sales/Net Working Capital |
- |
- |
- |
4.54 |
5.37 |
|
Gearing % |
0 |
0 |
0 |
0 |
37.50 |
|
Equity in % |
72 |
50.80 |
59.50 |
51.90 |
42.20 |
|
Creditor Days |
- |
- |
- |
51.46 |
58.75 |
|
Debtor Days |
- |
- |
- |
90.01 |
63.25 |
|
Liquidity/Acid Test |
2.46 |
1.58 |
1.64 |
1.18 |
0.66 |
|
Return On Capital Employed % |
- |
- |
- |
27.95 |
15.75 |
|
Return On Total Assets Employed % |
- |
- |
- |
14.52 |
6.65 |
|
Current Debt Ratio |
0.38 |
0.96 |
0.68 |
0.92 |
1.36 |
|
Total Debt Ratio |
0.38 |
0.96 |
0.68 |
0.92 |
1.36 |
|
Stock Turnover Ratio % |
- |
- |
- |
17.91 |
27.71 |
|
Return on Net Assets Employed % |
- |
- |
- |
27.95 |
15.75 |
FOREIGN EXCHANGE RATES
N/a
ADDITIONAL INFORMATION
Status History
|
No Status History found |
*Event History
|
Date |
Description |
|
08/08/2014 |
Annual Returns |
|
01/01/2014 |
New Accounts Filed |
|
30/07/2013 |
Annual Returns |
|
10/01/2013 |
New Accounts Filed |
|
20/07/2012 |
Annual Returns |
|
14/12/2011 |
New Accounts Filed |
|
26/07/2011 |
Annual Returns |
|
09/11/2010 |
New Accounts Filed |
|
09/11/2010 |
New Accounts Filed |
|
02/10/2010 |
Annual Returns |
|
22/12/2009 |
New Accounts Filed |
|
25/08/2009 |
Annual Returns |
|
07/01/2009 |
New Accounts Filed |
|
02/08/2008 |
Annual Returns |
|
18/02/2008 |
New Accounts Filed |
Previous Company Names
|
No Previous Names found |
NOTES & COMMENTS
Commentary
|
No exact match CCJs are recorded against the company. |
|
|
There is insufficient data to indicate a change in this company's percentage of sales. |
|
|
Net Worth increased by 11.6% during the latest trading period. |
|
|
A 21.3% decline in Total Assets occurred during the latest trading period. |
|
|
There is insufficient data to indicate a change in this company's pre-tax profit. |
|
|
The company saw a decrease in their Cash Balance of 31.1% during the latest trading period. |
|
|
The company is exempt from audit. |
|
|
No recent changes in directorship are recorded. |
|
|
The company is part of a group. |
|
|
The movement in accumulated earnings would indicate that the company made a profit after tax and other appropriations, including dividends. |
|
|
The company was established over 25 years ago. |
|
DIAMOND INDUSTRY – INDIA
-
From time immemorial, India is well known in the world as the birthplace
for diamonds. It is difficult to trace the origin of diamonds but history
says that in the remote past, diamonds were mined only in India. Diamond
production in India can be traced back to almost 8th Century B.C.
India, in fact, remained undisputed leader till 18th Century
when Brazilian fields were discovered in 1725 followed by emergence of S.
Africa, Russia and Australia.
-
The achievement of the Indian diamond industry was possible only due to
combination of the manufacturing skills of the Indian workforce and the
untiring and unflagging efforts of the Indian diamantaires, supported by
progressive Government policies.
-
The area of study of family owned diamond businesses derives its
importance from the huge conglomerate of family run organizations which operate
in the diamond industry since many generations.
-
Some of the basic traits of family run business enterprises include
spirit of entrepreneurship, mutual trust lowers transaction costs, small,
nimble and quick to react, information as a source of advantage and
philanthropy.
-
Family owned diamond businesses need to improve on many fronts including
higher standard of corporate governance, long-term performance – focused
strategies, modern management and technology.
-
Utmost caution is to be exercised while dealing with some medium and
large diamond traders which are usually engaged in fictitious import – export,
inter-company transactions, financially assisted by banks. In the process,
several public sector banks lost several hundred million rupees. They mostly
diverted borrowed money for diamond business into real estate and capital
markets.
-
Excerpts from Times of India dated 30th October 2010 is as
under –
-
Gem & Jewellery Export Promotion Council in its statistical data has
shown the export of polished diamonds to have increase by 28 % in February
2013. Compared to $ 1.4 bn worth of polished diamond export in February, 2012,
India exported $ 1.84 billion worth of polished diamonds in February 2013. A
senior executive of GJEPC said, “Export of cut and polished diamonds started
falling month-wise after the imposition of 2 % of import duty on the polished
diamonds. But February, 2013 has given a new ray of hope to the industry as the
export of polished diamonds has actually increased by 28 %. It means the
industry is on the track of recovery and round tripping of diamonds has
stopped completely.” Demand has started coming from the US, the UK, Japan and
China. India’s polished diamond export is expected to cross $ 21 bn in 2013-14.
-
The banking sector has started exercising restraint while following
prudent risk management norms when lending money to gems and jewellery sector.
This follows the implementation of Basel III accord – a global voluntary
regulatory standard on bank capital adequacy, stress testing and market
liquidity.
FOREIGN EXCHANGE RATES
|
Currency |
Unit
|
Indian Rupees |
|
US Dollar |
1 |
Rs.61.89 |
|
|
1 |
Rs.96.83 |
|
Euro |
1 |
Rs.76.57 |
INFORMATION DETAILS
|
Report Prepared
by : |
TPT |
RATING EXPLANATIONS
|
RATING |
STATUS |
PROPOSED CREDIT LINE |
|
|
>86 |
Aaa |
Possesses an extremely sound financial base with the strongest
capability for timely payment of interest and principal sums |
Unlimited |
|
71-85 |
Aa |
Possesses adequate working capital. No caution needed for credit
transaction. It has above average (strong) capability for payment of interest
and principal sums |
Large |
|
56-70 |
A |
Financial & operational base are regarded healthy. General
unfavourable factors will not cause fatal effect. Satisfactory capability for
payment of interest and principal sums |
Fairly Large |
|
41-55 |
Ba |
Overall
operation is considered normal. Capable to meet normal commitments. |
Satisfactory |
|
26-40 |
B |
Capability to overcome financial difficulties seems comparatively below
average. |
Small |
|
11-25 |
Ca |
Adverse factors are apparent. Repayment of interest and principal sums
in default or expected to be in default upon maturity |
Limited with
full security |
|
<10 |
C |
Absolute credit risk exists. Caution needed to be exercised |
Credit not
recommended |
|
-- |
NB |
New Business |
-- |
This score serves as a reference to assess SC’s credit risk
and to set the amount of credit to be extended. It is calculated from a
composite of weighted scores obtained from each of the major sections of this
report. The assessed factors and their relative weights (as indicated through
%) are as follows:
Financial
condition (40%) Ownership
background (20%) Payment
record (10%)
Credit history
(10%) Market trend
(10%) Operational
size (10%)
This report is issued at your request without any
risk and responsibility on the part of MIRA INFORM PRIVATE LIMITED (MIPL)
or its officials.