MIRA
INFORM REPORT
|
Report Date : |
04.12.2014 |
IDENTIFICATION DETAILS
|
Name : |
PALL LIFE SCIENCES |
|
|
|
|
Registered Office : |
Reugelstraat 2 3320 Hoegaarden |
|
|
|
|
Country : |
|
|
|
|
|
Financials (as on) : |
31.12.2013 |
|
|
|
|
Date of Incorporation : |
21.11.1970 |
|
|
|
|
Com. Reg. No.: |
407606965 |
|
|
|
|
Legal Form : |
Private Limited Company (BL/LX) |
|
|
|
|
Line of Business : |
Manufacture of Plastic packing goods |
|
|
|
|
No. of Employees : |
131 |
RATING & COMMENTS
|
MIRA’s Rating : |
B |
|
RATING |
STATUS |
PROPOSED CREDIT LINE |
|
|
26-40 |
B |
Capability to overcome financial difficulties seems comparatively
below average. |
Small |
|
Status : |
Moderate |
|
Payment Behaviour : |
Slow but correct |
|
Litigation : |
Clear |
NOTES :
Any query related to this report can be made
on e-mail : infodept@mirainform.com
while quoting report number, name and date.
ECGC Country Risk Classification List – June 1, 2014
|
Country Name |
Previous Rating (31.03.2014) |
Current Rating (01.06.2014) |
|
|
A2 |
A2 |
|
Risk Category |
ECGC
Classification |
|
Insignificant |
A1 |
|
Low |
A2 |
|
Moderate |
B1 |
|
High |
B2 |
|
Very High |
C1 |
|
Restricted |
C2 |
|
Off-credit |
D |
This modern, open, and private-enterprise-based economy has
capitalized on its central geographic location, highly developed transport network,
and diversified industrial and commercial base. Industry is concentrated mainly
in the more heavily-populated region of
|
Source
: CIA |
Company summary
Business number 407606965
Company name PALL LIFE SCIENCES BELGIUM BVBA
Address REUGELSTRAAT 2
3320 HOEGAARDEN
Number of staff 131
Date of establishment 21/11/1970
Telephone number 016766159
Fax number 016767625
Ultimate holding company
Company name Company
Number
PALL EUROPEAN HOLDINGS LIMITED –
Commentary
The business was established over 44 years
ago.
The business has 138 employees.
The business is part of a group.
The business has changed its registered name
recently.
The business has been at the address for over
17 years.
A 61% growth in Total Assets occurred during
the latest trading period.
The business saw a decrease in their Cash
Balance of 74% during the latest trading period.
Working Capital is a
negative amount during the latest trading period.
Account
|
DATE OF
LATEST ACCOUNTS |
TURNOVER |
PROFIT
BEFORE TAX |
NET WORTH |
WORKING CAPITAL |
|
31/12/2013 |
25,319,987 |
-216,168 |
20,495,818 |
-14,701,279 |
|
31/12/2012 |
21,052,213 |
-1,588,179 |
-2,815,062 |
-20,964,802 |
|
31/12/2011 |
18,569,297 |
-2,712,946 |
3,883,246 |
-15,830,576 |
Accounts
|
DATE OF
LATEST ACCOUNTS |
BALANCE TOTAL |
NUMBER OF
EMPLOYEES |
CAPITAL |
CASHFLOW |
|
31/12/2013 |
59,435,446 |
131 |
25,310,000 |
4,127,191 |
|
31/12/2012 |
36,818,596 |
122 |
4,810,000 |
59,970 |
|
31/12/2011 |
33,816,527 |
125 |
4,810,000 |
-946,397 |
Payment expectations
Past payments Payment
expectation days 27.15
Industry average payment
expectation days 79.22 Industry average day sales
outstanding 83.99
Day sales outstanding 65.07
Court data summary
BANKRUPTCY DETAILS
Court action type no
PROTESTED BILLS
Bill amount
-
NSSO DETAILS
Date of summons 23/06/2008
Company information
Business number 407606965 Company name PALL LIFE SCIENCES BELGIUM BVBA
Fax number 016767625 Date founded 21/11/1970
Company status active Company type Private Limited Company (BL/LX)
Currency Euro (€) Date of latest accounts 31/12/2013
Activity code 22220 Liable for VAT yes
Activity description Manufacture of
Plastic packing
goods
VAT Number BE.0407.606.965 Check VAT number Belgian Bullettin of Acts moniteur belge
Contractor details
Registered contractor number -
Contractor description -
Date struck off register
Personnel (NSSO classification)Code -
Description -
Joint Industrial Committee (JIC)
JIC Code 116
Description Joint committee
for the chemical industry
category
JIC Code 207
Description Joint committee
for the employees off he chemical industry
Category
Significant Events
Event Date 15/05/2014
Event Description authority
appointed
Event Details Commentaar
15-05-2014: Volmacht aan Raf Vanheel. Intrekking volmacht van Tim Carlson.
Company accounts
Assets
Assets
Annual
accounts 31-12-2013 %
31-12-2012 % 31-12-2011 % 31-12-2010
% 31-12-2009
Weeks 52 52 52 52 52
Currency
EUR EUR EUR EUR EUR
Total fixed assets 43,380,640
77.50 24,439,742 17.04 20,882,398 2.56 20,360,843 98.73
10,245,246
Intangible fixed assets 5,895,858
-6.27 6,290,002 438 1,168,577 14.97
1,016,383 -23.63
1,330,934
Tangible fixed assets 4,127,295
22.97 3,356,324 -9.66 3,715,342 -15.45 4,394,446 -13.27
5,066,707
Land & building 1,255,082 -13.36
1,448,614 -7.51 1,566,248
-6.42 1,673,775 -2.51
1,716,885
Plant & machinery 1,007,509
-35.92 1,572,303 -23.02 2,042,453 -21.78 2,611,253 -19.59
3,247,428
Furniture & Vehicles 12,025
-43.82 21,404 -53.30 45,836 -55.44 102,869
0.46 102,394
Leasing & Other Similar Rights - -
- - - - - - -
Other tangible assets 1,852,679 490 314,003 416 60,806
828 6,549
- 0
Financial fixed assets 33,357,48 7 125 14,793,416 -7.53 15,998,479
7.01 14,950,014 288 3,847,606
Total current assets 16,054,806 29.70
12,378,854 -4.29 12,934,128 28.94 10,031,146
17.31 8,551,106
Inventories 8, 348,768 65.04
5,058,732 13.15 4,470,938 20.48 3,710,813
-13.30 4,280,209
Raw materials & consumables 2,011,265 66.33 1,209,191 7.83 1,121,404 26.92 883,558 -31.16 1,283,463
Work in progress 1,132,112 18.97 951,633
-4.78 999,456 -0.60 1,005,478 -3.28 1,039,628
Finished goods 5,205,391 79.63
2,897,908 23.31 2,350,078 29.00 1,821,777
-6.92 1,957,118
Other stocks 0 - 0 - 0 - 0 - 0
Trade debtors 4,514,003 22.39 3,688,133 -2.59 3,786,056 16.28 3,255,851 12.01 2,906,753
Other amounts receivable 1,635,852
123 732,170 56.42
1,680,155 433 314,998
-62.80 846,833
Cash 226,471
-74.60 891,690
-52.72 1,885,892 -29.47
2,673,751 564 402,614
Miscellaneous current assets 1,329,712 179 476,564 351 105,531
39.35 75,733
-33.97 114,697
Total Assets 59,435,446 61.43 36,818,596
8.88 33,816,527 11.27
30,391,989 61.69 18,796,352
Liabilities
Total shareholders equity 26,391,676 659 3,474,940 -31.21 5,051,822 -34.94
7,764,768 -4.93 8,167,775
Issued share capital 25,310,000 426 4,810,000 0 4,810,000 0 4,810,000 0 4,810,000
Share premium account - - -
- - - - - -
Revaluation reserve - - -
- -
- -
- -
|
Reserves |
1,081,676 |
81.02 |
-1,335,060 |
-652 |
241,822 |
-91.82 |
2,954,768 |
-12.00 |
3,357,775 |
|
Provisions for Liabilities & |
37,685 |
- |
0 |
- |
0 |
- |
0 |
- |
0 |
|
Charges |
|
|
|
|
|
|
|
|
|
|
Deffered taxes - - - - - - - - - |
|||||||||
|
Creditors |
33,006,085 |
-1.01 |
33,343,656 |
15.92 |
28,764,704 |
27.12 |
22,627,221 |
112 |
10,628,578 |
|
Other long term loans - - - - - - - - - |
|||||||||
|
Long term group loans - - - - - - - - - |
|||||||||
|
Other long term liabilities |
2,250,000 |
- |
0 |
- |
0 |
- |
0 |
- |
0 |
|
Total long term debts |
2,287,685 |
- |
0 |
- |
0 |
- |
0 |
- |
0 |
|
|
|||||||||
|
Current portion of long term debt |
750,000 |
- |
- |
- |
- |
- |
- |
- |
- |
|
Financial debts |
25,324,142 |
-9.50 |
27,981,009 |
15.84 |
24,155,652 |
26.17 |
19,145,869 |
156 |
7,450,000 |
|
Trade creditors |
1,904,743 |
13.22 |
1,682,266 |
86.63 |
901,371 |
-20.08 |
1,127,801 |
-12.15 |
1,283,827 |
|
Amounts Payable for Taxes, |
1,590,791 |
20.51 |
1,320,007 |
-24.47 |
1,747,711 |
34.66 |
1,297,824 |
15.71 |
1,121,585 |
|
Remuneration & Social Security |
|
|
|
|
|
|
|
|
|
|
|
|||||||||
|
Miscellaneous current liabilities |
1,186,409 |
-49.74 |
2,360,374 |
20.43 |
1,959,971 |
85.65 |
1,055,726 |
36.55 |
773,166 |
|
Total current liabilities |
30,756,085 |
-7.76 |
33,343,656 |
15.92 |
28,764,704 |
27.12 |
22,627,221 |
112 |
10,628,578 |
|
|
|
|
|
|
|
|
|
|
|
|
Total Liabilities |
59,435,446 |
61.43 |
36,818,596 |
8.88 |
33,816,527 |
11.27 |
30,391,989 |
61.69 |
18,796,352 |
|
ratio analysis |
|
|
|
|
|
|
|
|
|
|
TRADING PERFORMANCE |
|||||||||
|
Profit Before Tax |
-0.85 |
11.27 |
-7.54 |
51.61 |
-14.61 |
-570 |
-2.18 |
11.29 |
-19.31 |
|
|
|
|
|
|
|
|
|
|
|
|
Return on capital employed |
-0.75 |
1.64 |
-45.70 |
85.10 |
-53.70 |
-922 |
-5.25 |
15.24 |
-34.45 |
|
|
|
|
|
|
|
|
|
|
|
|
Return on total assets |
-0.36 |
8.35 |
-4.31 |
53.74 |
-8.02 |
-498 |
-1.34 |
8.95 |
-14.97 |
|
employed |
|
|
|
|
|
|
|
|
|
|
|
|||||||||
|
Return on net assets employed |
-0.82 |
1.79 |
-45.70 |
85.10 |
-53.70 |
-922 |
-5.25 |
15.24 |
-34.45 |
|
|
|
|
|
|
|
|
|
|
|
|
Sales / net working capital |
-1.72 |
-72.00 |
-1.00 |
85.47 |
-1.17 |
79.05 |
-1.48 |
21.11 |
-7.01 |
|
|
|
|
|
|
|
|
|
|
|
|
Stock turnover ratio |
32.97 |
37.20 |
24.03 |
-0.21 |
24.08 |
21.37 |
19.84 |
-32.47 |
29.38 |
|
|
|||||||||
|
Creditor days |
27.15 |
-1.09 |
27.45 |
71.13 |
16.04 |
-21.91 |
20.54 |
-24.57 |
27.23 |
|
Debtor days |
65.07 |
1.77 |
63.94 |
-14.08 |
74.42 |
17.12 |
63.54 |
-12.74 |
72.82 |
|
Current
ratio |
0.52 |
40.54 |
0.37 |
-17.78 |
0.45 |
2.27 |
0.44 |
-45.00 |
0.80 |
|
|
|||||||||
|
Liquidity
ratio / acid ratio |
0.25 |
13.64 |
0.22 |
-24.14 |
0.29 |
3.57 |
0.28 |
-30.0 |
0.40 |
|
|
|||||||||
|
Current debt
ratio |
1.17 |
-87.81 |
9.60 |
68.72 |
5.69 |
95.53 |
2.91 |
123 |
1.30 |
|
|
|||||||||
|
Liquidity
ratio reprocessed - - - - - - - - - |
|||||||||
|
|
|||||||||
|
Cashflow |
4,127,191 |
6782 |
59,970 |
6.34 |
-946,397 |
-175 |
1,256,905 |
108 |
-1,159,603 |
|
|
|||||||||
|
Net worth |
20,495,818 |
728 |
-2,815,062 |
-172 |
3,883,246 |
-42.46 |
6,748,385 |
-1.29 |
6,836,841 |
|
LONG TERM
STABILITY |
|
|
|
|
|
|
|
|
|
|
Gearing |
98.80 |
-87.73 |
805.22 |
68.40 |
478.16 |
93.92 |
246.57 |
170 |
91.21 |
|
|
|||||||||
|
Equity in
percentage |
49.29 |
333 |
11.38 |
-26.44 |
15.47 |
-41.47 |
26.43 |
-43.49 |
46.77 |
|
|
|||||||||
|
Total debt
ratio |
1.25 |
-86.98 |
9.60 |
68.72 |
5.69 |
95.53 |
2.91 |
123 |
1.30 |
|
Working
capital |
-14,701,279 |
70.12 |
-20,964,802 |
-32.43 |
-15,830,576 |
-25.68 |
-12,596,075 |
-506 |
-2,077,472 |
|
Profit &
loss |
|||||||||
|
Operating
Income |
27,681,849 28.42 |
21,554,901 |
13.01 |
19,073,860 |
2.82 |
18,551,084 |
15.30 |
16,089,415 |
|
|
Turnover |
25,319,987 20.27 |
21,052,213 |
13.37 |
18,569,297 |
-0.71 |
18,702,176 |
28.36 |
14,570,056 |
|
|
Total
operating expenses |
25,603,423 14.46 |
22,368,979 |
9.07 |
20,508,978 |
2.34 |
20,040,295 |
16.46 |
17,208,031 |
|
|
Gross
Operating Margin - - - - - - - - - |
|||||||||
|
|
|||||||||
|
Operating
Charges |
27,965,285 22.27 |
22,871,667 |
8.84 |
21,013,541 |
5.65 |
19,889,203 |
6.20 |
18,727,390 |
|
|
Employee
costs |
8,574,199 |
10.29 |
7,774,047 |
-1.42 |
7,885,775 |
6.10 |
7,432,190 |
16.41 |
6,384,226 |
|
Wages and
salary |
5,718,210 |
12.85 |
5,066,888 |
-2.12 |
5,176,628 |
5.88 |
4,889,347 |
13.38 |
4,312,185 |
|
Employee
pension costs |
- |
- |
- |
- |
- |
- |
- |
- |
- |
|
Social
security contributions |
1,335,611 |
2.25 |
1,306,239 |
7.51 |
1,214,963 |
1.11 |
1,201,662 |
-0.02 |
1,201,923 |
|
Other
employee costs |
1,520,378 |
8.53 |
1,400,920 |
-6.24 |
1,494,184 |
11.41 |
1,341,181 |
54.14 |
870,119 |
|
Director
remuneration |
- |
- |
- |
- |
- |
- |
- |
- |
- |
|
Amortization
and depreciation |
1,710,454 |
4.50 |
1,636,852 |
-7.34 |
1,766,548 |
6.42 |
1,659,912 |
0.51 |
1,651,441 |
|
Operating
result |
-283,436 |
21.53 |
-1,316,766 |
67.89 |
-1,939,681 |
-44.96 |
-1,338,119 |
50.73 |
-2,637,975 |
|
Total
financial income |
984,611 |
61.24 |
610,648 |
89.38 |
322,454 |
-75.76 |
1,330,462 |
2080 |
61,022 |
|
|
|
|
|
|
|
|
|
|
|
|
Total financial
expenses |
917,343 |
4.00 |
882,061 |
-19.50 |
1,095,719 |
173 |
400,320 |
69.16 |
236,650 |
|
|
|
|
|
|
|
|
|
|
|
|
Results on
ordinary operations |
-216,168 |
13.61 |
-1,588,179 |
58.54 |
-2,712,946 |
-564 |
-407,978 |
14.50 |
-2,813,603 |
|
before
taxation |
|
|
|
|
|
|
|
|
|
|
|
|||||||||
|
Extraordinary
Income |
3,229,881 |
24162 13,312 |
- |
- |
- |
4,971 |
94.25 |
2,559 |
|
|
|
|||||||||
|
Extraordinary
Charges |
578,197 |
- |
- |
- |
- |
- |
- |
- |
- |
|
|
|||||||||
|
Extraordinary
items |
2,651,684 |
19819 13,312 |
- |
0 |
-100 |
4,971 |
94.25 |
2,559 |
|
|
|
|
|
|
|
|
|
|
|
|
|
Results for
the Year Before |
2,435,516 |
154 |
-1,574,867 |
58.05 |
-2,712,946 |
-573 |
-403,006 |
14.34 |
-2,811,043 |
|
Taxation |
|
|
|
|
|
|
|
|
|
|
Other
appropriations
- - - - - - - - - |
|||||||||
|
|
|||||||||
|
Taxation |
18,779 |
831 |
2,015 |
- |
- |
- |
- |
- |
- |
Social
Balance Sheet Details
|
Social
Balance Sheet |
Total |
|
|
|||
|
During the reporting year
ended 31-12-2013 |
||||||
|
Full-time
Employees |
106 |
|
|
|||
|
Part-time
Employees |
27 |
|
|
|||
|
Total Fte
Employees |
126 |
|
|
|||
|
|
||||||
|
Number of
hours worked |
||||||
|
Full-time
Employees |
167,969 |
|
|
|||
|
Part-time
Employees |
31,509 |
|
|
|||
|
Total |
199,478 |
|
|
|||
|
|
||||||
|
Personnel
Charges |
||||||
|
Full-time
Employees |
7,249,840 |
|
|
|||
|
Part-time
Employees |
1,324,359 |
|
|
|||
|
Total |
8,574,199 |
|
|
|||
|
Benefits In
Addition To Wages |
151,574 |
|
|
|||
|
|
||||||
|
During the
previous reporting year |
||||||
|
Average number
employees in Fte |
122 |
|
|
|||
|
Actual
working hours |
192,922 |
|
|
|||
|
Personnel
Charges |
7,774,047 |
|
|
|||
|
Benefits In
Addition To Wages |
147,289 |
|
|
|||
|
|
||||||
|
|
||||||
|
Type of
Contract
Full-Time |
Part-Time |
Total Fte |
|
|||
|
Unlimited Duration Contracts 105 |
27 |
125 |
|
|||
|
Limited
Duration Contracts 3 |
- |
3 |
|
|||
|
Contracts
For Specific Work - - - |
||||||
|
Contracts
Regarding 3 Substitution |
- |
3 |
|
|||
|
Gender and
Education Level |
||||||
|
Men |
Full-Time |
Part-Time |
Total Fte |
|
||
|
Primary
education |
6 |
1 |
7 |
|
||
|
Secondairy
education |
25 |
1 |
26 |
|
||
|
Higher education (non university) |
13 |
1 |
14 |
|
||
|
Higher education (university) |
19 |
3 |
20 |
|
||
|
Women |
Full-Time |
Part-Time |
Total Fte |
|
||
|
Primary
education |
6 |
4 |
9 |
|
||
|
Secondairy
education |
30 |
8 |
36 |
|
||
|
Higher education (non university) |
4 |
7 |
10 |
|
||
|
Higher education (university) |
8 |
2 |
10 |
|
||
|
|
|
|
|
|
||
|
|
||||||
|
Working
Category |
Full-Time |
Part-Time |
Total Fte |
|
||
|
Management |
4 |
- |
4 |
|
||
|
White
collar worker |
53 |
15 |
63 |
|
||
|
Blue collar
worker |
54 |
12 |
64 |
|
||
|
Other - - - |
||||||
|
|
|
|
|
|
||
|
Temporary
personnel |
|
Total |
|
|
||
|
Average
number of temporary staff |
16 |
|
|
|||
|
Actual
working hours |
|
30,592 |
|
|
||
|
Cost of
temporary staff |
|
796,069 |
|
|
||
|
|
|
|
|
|
||
|
|
||||||
|
New staff
and leavers |
Full-Time |
Part-Time |
Total Fte |
|
||
|
New
Starters |
21 |
1 |
22 |
|
||
|
Leavers |
12 |
2 |
13 |
|
||
|
|
|
|
|
|
||
Total of formal
continuing vocational training initiatives
for workers paid by the employer Male
Female
Number of employees 64 56
Number of training hours 420
569
Net costs for enterprise 35,612
36,987
Total of less formal and informal continuing vocational
training initiatives for workers paid by the employer Male Female
Number of employees 61
61
Number of training hours 226
237
Net costs for enterprise 9,973
7,807
Total of initial training initiatives at the expense of the
employer Male
Female
Number of employees 6 -
Number of training hours 1,840 -
Net costs for enterprise 7,134
–
Industry
comparison
Activity code 22220
Activity description Manufacture
of plastic packing goods
industry average credit
rating 69.85
Industry average credit limit 150590.60
Payment
Information
Payment Information Summary
Total number of Invoices available 88
Total number of Invoices paid within or up to 30 days after the due date
56
Total number of Invoices paid more than 30 days after the due date 13
Total number of Invoices currently outstanding where the due date has
not yet been reached 19
Total number of Invoices currently outstanding beyond the due date 0
Suspension of
payments / moratorium history
Amount
-
Details -
Payment expectations
Payment expectation days 27.15
Day sales outstanding
65.07
Industry comparison
Activity code 22220
Activity description Manufacture
of plastic packing goods
Industry average payment
expectation days 79.22
Industry average day sales
Outstanding 83.99
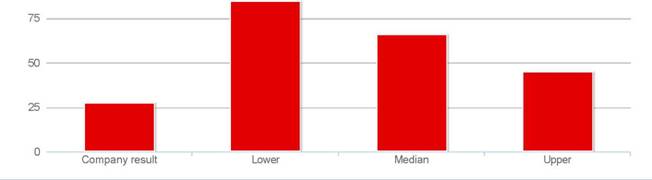
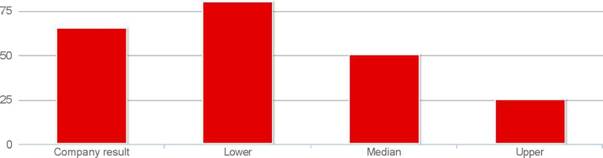
Industry quartile
analysis
Payment
expectations
Company result 27.15
Lower 84.11
Median 65.48
Upper 44.41
Day sales
outstanding
Company result 65.07
Lower 80.13
Median 50.16
Upper 25.13
Shareholder
Details
Summary
Group - Number of Companies 3
Linkages - Number of Companies 14
Number of Countries 5
Group Structure
Company name Number
Latest
financials
- PALL EUROPEAN HOLDINGS LIMITED
- - PALL LIFE SCIENCES
- - - PALL ARTELIS SPRL 875485178
BE01186238 31-12-2013
Minority
Shareholders
No minority shareholders found
Minority Interests
Business
Number Company name % Date of accounts
- ATMI AUSTAR
PACKAGING
TECHNOLOGY CO LTD
BO 40 -
- ATMI AUSTAR
PACKAGING
TECHNOLOGY CO LTD
BO 40 -
- DISPOSABLE
LAB SAS 15 -
Companies that
match this address
Business number Company name Date of accounts
467517828 ATMI
ACQUISITION IN VEREFFENING BVBA 31/12/2011
Linked Companies
Summary
Group - Number of Companies 3
Linkages - Number of Companies 14
Number of Countries 5
Linked Companies
|
NAME |
NUMBER |
LATEST KEY FINANCIALS |
TURNOVER |
|
HRB
72998 |
31.12.2012 |
- |
|
|
SC179004 |
30.11.2005 |
£7.103 |
|
|
ATMI FAB
SERVICES IRELAND LIMITED |
IE365496 |
31.12.2008 |
- |
|
467517828 |
31.12.2011 |
- |
|
|
- |
- |
$2.957.000 |
|
|
- |
- |
$161.000 |
|
|
- |
- |
- |
|
|
- |
- |
$200.000.000 |
|
|
- |
- |
- |
|
|
- |
- |
- |
|
|
- |
- |
$1.390.000.000 |
|
|
- |
- |
$46.964.000 |
|
|
ADVANCED
TECHNOLOGY MATERIALS, INC |
- |
- |
- |
|
- |
- |
- |
Summons
Legal event type Social
Security Summons
Event date 23/06/2008
Court type Court
name
Creditor's name 3rd party type
Protested Bills
There is no data for this company
Bankruptcy and
other legal events
There is no data for this company
Director details
Current director
details
Name MARIO
PHILIPS
Position Principal
Manager
Start Date 26/05/2014
Street 6
ERFKEN ERPE-MERE
Post code 9420
Country
Name YANNICK
MAISONNEUVE
Position Principal
Manager
Start Date 20/02/2014
Street 30
LES PLANCHETTES
Post code 1644
Country
Name RICHARD
JOHN JACKSON
Position Principal
Manager
Start Date 20/02/2014
Country
Former director
details
Name OLIVER
ZITZMANN
Position Director
Start Date 17/10/2002
End Date Unknown
date
Name TERRY
NAGEL
Position Director
Start Date 24/11/1999
End Date Unknown
date
Name DANIEL
P. SHARKEY
Position Principal
Manager
Start Date 28/09/2010
End Date 20/02/2014
Country
Position Managing
Director
Start Date 31/01/2008
End Date 31/12/2010
Country
Position Director
Start Date 24/11/1999
End Date Unknown
date
Country
Name MARC
SYLVAIN MARIE HUYNEN
Position Managing
Director
Start Date 15/11/1999
End Date 17/10/2002
Date of birth 09/09/1945
Street 508
CHAUSSÉE DE TIRLEMONT GELDENAKEN
Post code 1370
Country
Name MARIO
PHILIPS
Position Legal
Representative
Start Date 11/03/2004
End Date Unknown
date
Street 6
ERFKEN ERPE-MERE
Post code 9420
Country
Name ERNST
EN YOUNG BEDRIJFSREVISOREN B.V. CVBA
Position Commissioner
Start Date 19/06/2008
End Date 23/05/2011
Date of birth 06/01/1992
Street 2
DE KLEETLAAN MACHELEN
Post code 1831
Country
Name THERESE
DELSARTE
Position Director
Start Date 18/05/1997
End Date Unknown
date
Street 508
CHAUSSÉE DE TIRLEMONT GELDENAKEN
Post code 1370
Country
Name MARLEEN
VAN PRAAG
Position Director
Start Date 18/05/1997
End Date Unknown
date
Street 32
HOOGSTRAAT BIERBEEK
Post code 3360
Country
Former mandates in
other companies
Name HQ
Pack NV
Business number 440993870
Position Principal Manager
Start Date 02/06/1997
End Date Unknown
date
Business number 440993870
Position Director
Start Date 02/06/1997
End Date Unknown
date
Business number 440993870
Position Partner
Start Date 16/08/1997
End Date Unknown
date
FOREIGN EXCHANGE RATES
|
Currency |
Unit
|
Indian Rupees |
|
US Dollar |
1 |
Rs.61.87 |
|
|
1 |
Rs.96.83 |
|
Euro |
1 |
Rs.76.57 |
INFORMATION DETAILS
|
Analysis Done by
: |
RAS |
|
|
|
|
Report Prepared
by : |
SDA |
RATING EXPLANATIONS
|
RATING |
STATUS |
PROPOSED CREDIT LINE |
|
|
|
>86 |
Aaa |
Possesses an extremely sound financial base with the strongest
capability for timely payment of interest and principal sums |
Unlimited |
|
|
71-85 |
Aa |
Possesses adequate working capital. No caution needed for credit
transaction. It has above average (strong) capability for payment of interest
and principal sums |
Large |
|
|
56-70 |
A |
Financial & operational base are regarded healthy. General unfavourable
factors will not cause fatal effect. Satisfactory capability for payment of
interest and principal sums |
Fairly Large |
|
|
41-55 |
Ba |
Overall operation is considered normal. Capable to meet normal
commitments. |
Satisfactory |
|
|
26-40 |
B |
Capability to
overcome financial difficulties seems comparatively below average. |
Small |
|
|
11-25 |
Ca |
Adverse factors are apparent. Repayment of interest and principal sums
in default or expected to be in default upon maturity |
Limited with
full security |
|
|
<10 |
C |
Absolute credit risk exists. Caution needed to be exercised |
Credit not
recommended |
|
|
-- |
NB |
New Business |
-- |
|
This score serves as a reference to assess SC’s credit risk
and to set the amount of credit to be extended. It is calculated from a
composite of weighted scores obtained from each of the major sections of this
report. The assessed factors and their relative weights (as indicated through
%) are as follows:
Financial
condition (40%) Ownership
background (20%) Payment
record (10%)
Credit history
(10%) Market trend
(10%) Operational
size (10%)
This report is issued at your request without any
risk and responsibility on the part of MIRA INFORM PRIVATE LIMITED (MIPL)
or its officials.