MIRA
INFORM REPORT
|
Report Date : |
04.12.2014 |
IDENTIFICATION DETAILS
|
Name : |
PANJAPOL
PAPER INDUSTRY CO.,
LTD. |
|
|
|
|
Registered Office : |
44th
Floor, United |
|
|
|
|
Country : |
|
|
|
|
|
Financials (as on) : |
31.12.2009 |
|
|
|
|
Date of Incorporation : |
26.08.1987 |
|
|
|
|
Com. Reg. No.: |
0105530043126 [Former :
4312/2530] |
|
|
|
|
Legal Form : |
Private Limited Company |
|
|
|
|
Line of Business : |
manufacturer of
Kraft Paper, Corrugated Paper,
Kraft Liner Board Paper,
Corrugated Medium Paper. |
|
|
|
|
No of Employees : |
approximately 300
staff [office staff
and factory workers] |
RATING & COMMENTS
|
MIRA’s Rating : |
C |
|
RATING |
STATUS |
PROPOSED CREDIT LINE |
|
|
<10 |
C |
Absolute credit risk exists. Caution needed to be exercised |
Credit not
recommended |
|
Status : |
Poor |
|
Payment Behaviour : |
--- |
|
Litigation : |
--- |
NOTES :
Any query related to this report can be made
on e-mail : infodept@mirainform.com
while quoting report number, name and date.
ECGC Country Risk Classification List – June 1, 2014
|
Country Name |
Previous Rating (31.03.2014) |
Current Rating (01.06.2014) |
|
Thailand |
B1 |
B1 |
|
Risk Category |
ECGC
Classification |
|
Insignificant |
A1 |
|
Low |
A2 |
|
Moderate |
B1 |
|
High |
B2 |
|
Very High |
C1 |
|
Restricted |
C2 |
|
Off-credit |
D |
Thailand ECONOMIC OVERVIEW
With a
well-developed infrastructure, a free-enterprise economy, generally
pro-investment policies, and strong export industries, Thailand achieved steady
growth due largely to industrial and agriculture exports - mostly electronics,
agricultural commodities, automobiles and parts, and processed foods.
Unemployment, at less than 1% of the labor force, stands as one of the lowest
levels in the world, which puts upward pressure on wages in some industries.
Thailand also attracts nearly 2.5 million migrant workers from neighboring
countries. The Thai government in 2013 implemented a nation-wide 300 baht ($10)
per day minimum wage policy and deployed new tax reforms designed to lower
rates on middle-income earners. The Thai economy has weathered internal and
external economic shocks in recent years. The global economic recession
severely cut Thailand's exports, with most sectors experiencing double-digit
drops. In late 2011 Thailand's recovery was interrupted by historic flooding in
the industrial areas in Bangkok and its five surrounding provinces, crippling
the manufacturing sector. The government approved flood mitigation projects
worth $11.7 billion, which were started in 2012, to prevent similar economic
damage, and an additional $75 billion for infrastructure over the following
seven years. This was expected to lead to an economic upsurge but growth has
remained slow, in part due to ongoing political unrest and resulting
uncertainties. Spending on infrastructure will require re-approval once a new
government is seated.
|
Source : CIA |
Company name
PANJAPOL PAPER
INDUSTRY CO., LTD.
SUMMARY
ADDRESS : 44th FLOOR,
UNITED CENTER BUILDING,
323 SILOM
ROAD, SILOM, BANGRAK,
BANGKOK 10500,
THAILAND
TELEPHONE : [66]
2231-1100-10
FAX : [66]
2231-1422
E-MAIL ADDRESS : export@ppi.co.th
REGISTRATION ADDRESS : SAME AS
BUSINESS ADDRESS
ESTABLISHED : 1987
REGISTRATION NO. : 0105530043126 [Former : 4312/2530]
TAX ID NO. : 3101555851
CAPITAL REGISTERED : BHT.
449,749,660
CAPITAL PAID-UP : BHT.
449,749,660
SHAREHOLDER’S PROPORTION : THAI :
100%
FISCAL YEAR CLOSING
DATE : DECEMBER 31
LEGAL STATUS : PRIVATE LIMITED
COMPANY
EXECUTIVE : MR. SURAPONG TECHAWIBOON,
THAI
CHIEF EXECUTIVE
OFFICER
NO. OF STAFF : 300
LINES OF BUSINESS : KRAFT
PAPER & CORRUGATED
PAPER
MANUFACTURER, DISTRIBUTOR
& EXPORTER
CORPORATE PROFILE
OPERATING
TREND : STABLE
PRESENT
SITUATION : OPERATING NORMALLY
REPUTATION : FAIR
WITH NORMAL BUSINESS
ENGAGEMENT
MANAGEMENT
STANDARD : MANAGEMENT WITH
LOW PERFORMANCE
HISTORY
The
subject was established
on August 26,
1987 as a
private limited company
under the name
style PANJAPOL PAPER
INDUSTRY CO., LTD.,
by Thai groups,
the Techawiboon family,
with the business objective
to manufacture and
market Kraft and
Corrugated Papers to
both domestic and
international markets.
Subject
has entered into
a rehabilitated plan
by P S M Planner
Co., Ltd., who
is the Plan
Administer, since April
3, 2000. It
currently employs approximately 300 staff.
It
achieved the ISO 9001:20000 certification
by AJA institutes,
on January 9,
2007.
The subject’s registered
address is 44th Floor,
United Center Building, 323
Silom Road, Silom,
Bangrak, Bangkok 10500, and
this is the
subject’s current operation
address.
THE BOARD OF DIRECTORS
|
Name |
|
Nationality |
Age |
|
|
|
|
|
|
Mr. Chai Wattanasuwan |
|
Thai |
48 |
|
Mr. Chalit Satidthong |
|
Thai |
64 |
|
Mr. Nipol Kamonpantarerk |
|
Thai |
42 |
|
M.R. Sasiprin Chandratat |
|
Thai |
50 |
AUTHORIZED PERSON
Any
two of the
above directors jointly sign on behalf of the subject with
company’s affixed.
MANAGEMENT
Mr. Surapong Techawiboon
is the Chief
Executive Officer.
He is Thai
nationality with the
age of 68
years old.
Mr. Sawit Bowornsilp is
the Chief Operation
Officer.
He is Thai
nationality.
Mrs. Pensri Liyamapornsakul is
the Chief Financial
Officer.
She is Thai
nationality.
BUSINESS OPERATIONS
The
subject’s activity is
a manufacturer of Kraft
Paper, Corrugated Paper, Kraft Liner
Board Paper, Corrugated
Medium Paper.
PRODUCTION
300,000 metric tons per
year
IMPORT [COUNTRIES]
Some of paper pulps,
coals and chemicals are
imported from Australia, Canada, Finland, Germany, Republic
of China, Japan
and Korea.
MAJOR SUPPLIERS
Panjapol Pulp Industry
Public Co., Ltd. : Thailand
SALES [LOCAL]
80% of its
products is sold
locally by wholesale
to manufacturers and
end-users.
EXPORT [COUNTRIES]
20% of its
products is exported mainly to Asian countries such
as Hong Kong, Taiwan,
Singapore, India, Vietnam,
Malaysia, Philippines, Cambodia
and Republic of
China, and the
remaining to Egypt,
Dubai, Saudi Arabia,
Germany, Italy and South
Africa.
MAJOR CUSTOMERS
|
Hiang Seng Fibre
Container Co., Ltd. |
: Thailand |
|
Paper Packaging Manufacturers |
: Thailand |
|
U-Thai Co., Ltd. |
: Thailand |
|
Union Carton Co.,
Ltd. |
: Thailand |
|
Union Paper Co.,
Ltd. |
: Thailand |
|
Bangkok Packaging and
Component Co., Ltd.
|
: Thailand |
|
Panjapol Pulp Industry
Public Company Limited |
: Thailand |
PARENT COMPANY
Panjapol Pulp Industry
Public Company Limited
RELATED & AFFILIATED COMPANY
Hiang Seng Fibre
Container Co., Ltd.
Business Type : Manufacturer
of packaging products
LITIGATION
Bankruptcy and
Receivership
On August 23, 1999, the Central Bankruptcy
Court has ordered the company in
accordance with a
decided court case
No. F. 8/ 2542, to rehabilitate
its organization. On April 3, 2000, the court has approved the company’s
rehabilitation plan and
approved Siam Mun
Co., Ltd. and Delpitte Touche
Tohmatsu Planner Co.,
Ltd. as the
joint Plan Administer.
On
August 22, 2002,
the Court appointed
P S M Planner Co.,
Ltd. as the
Plan
Administer.
In 2007,
P S M Planner Co.,
Ltd has been
withdrawn from the
Plan Administer by
the subject, then
appointed Siam Mun
Co., Ltd., as
the Plan Administer,
which was approved
by the Court
on April 11,
2007.
Following the amendment
in the Rehabilitation Plan
which was approved
by the Court,
the Company had
to adjust its
capital restructuring in
according to the
Company’s financial capability
by reducing the
share capital from Bht.
100 per par
value to Bht.
10 per par
value. In addition
to this, the
company has reduced
its share capital
to Bht. 449,749,660 which was
divided into 44,974,966
shares at Bht.
10 per par
value. A decrease of
Bht. 4,047,746,940 will
be deducted from accumulated retained
earning [deficit] as at January
1, 2007. The
company has registered
a decrease in
its share capital
with the Commercial
Registration Department,
Ministry of Commerce
on June 1,
2007.
On July
15, 2008, the Central Bankruptcy Court has
ordered the company to revoke the Rehabilitation Plan.
CREDIT
Sales are by
cash or on
the credits term
of 30-60 days.
Local bills are
paid by cash
or on the
credits term of
30-60 days.
Imports
are by L/C
& T/T.
Exports are against
L/C at sight
& T/T.
BANKING
Krung Thai Bank
Public Co., Ltd.
[Head Office
: 35 Sukhumvit
Road, Klongtoeynua, Wattana,
Bangkok]
Kasikornbank Public Co.,
Ltd.
[Head Office
: 1 Kasikorn
Lane, Rajburana Road, Rajburana,
Bangkok]
TMB
Bank Public Co.,
Ltd.
[Head Office :
3000 Phaholyothin Road,
Chompol, Jatujak, Bangkok]
EMPLOYMENT
The subject employs
approximately 300 staff.
[office staff and
factory workers]
LOCATION DETAILS
The premise is rented for administrative office at the
heading address. Premise is
located in a
prime commercial area.
The factory is
located at 51
Moo 3 Pathumthani-Sena Road,
K.M. 28, T.
Hor-mok,
A. Bangsai, Ayudhya
13190 on 1,440,000
square meters of
area.
Tel : [66] 35
201-997-8, 35 201-993
COMMENT
The
demand for kraft
paper was depending upon
growing of country’s
industrial sectors of
which the needs
of paper packaging
for industrial products
for both domestic
and exports had
been slowing down
caused by world economic turmoil, therefore
demand of Kraft
paper were decreased
as well.
Subject
operates normally as
a manufacture of
Kraft and Corrugated
paper for industrial users. However,
its financial information has yet
been released to
the public since
2010, therefore, any
business engagement should
be on secured
basis only.
FINANCIAL INFORMATION
The capital was
originally registered at
Bht. 1,000,000 divided
into 10,000 shares
of Bht. 100
each.
The capital were
increased and decreased
later as follows:
Increased were : Bht.
300 ,000,000 on October
3, 1989
Bht. 900,000,000 on
July 28, 1994
Bht. 3,998,626,600
on October 2,
2000
Bht. 4,513,756,800
on October 9,
2000
Bht. 5,814,548,100
on October 10,
2000
Decreased were : Bht.
5,825,287,900 on June 28,
2002
Bht. 4,497,496,500
on November 6,
2003
Bht. 449,749,660 on
June 1, 2007
The latest registered capital
was decreased to Bht. 449,749,660 divided into
44,974,966 shares of
Bht. 10 each
with fully paid.
THE SHAREHOLDERS LISTED
WERE : [as
at March 28, 2013]
|
NAME |
HOLDING |
% |
|
Panjapol Pulp Industry
Public Company Limited Nationality: Thai Address : 323
Silom Rd., Bangrak,
Bankok |
44,974,959 |
99.99 |
|
Mr. Supoj Techawiboon Nationality: Thai Address : 69 Sukhumvit 55 Rd., Prakanong,
Klongtoey, Bangkok |
2 |
|
|
Mr. Surapong Techawiboon Nationality: Thai Address : 77
Soi Sukhumvit 38,
Prakanong, Klongtoey, Bangkok |
1 |
|
|
Mr. Suthee Techawiboon Nationality: Thai Address : 77 Sukhumvit 38 Rd.,
Prakanong, Klongtoey, Bangkok |
1 |
|
|
Mr. Liang Techawiboon Nationality: Thai Address :
26 Sukhumvit 25 Rd.,
Prakanong, Klongtoey, Bangkok |
1 |
= 0.01 |
|
Mrs. Hong Techawiboon Nationality: Thai Address : 26 Sukhumvit 25 Rd.,
Prakanong, Klongtoey, Bangkok |
1 |
|
Ms. Suthimalee Techawiboon Nationality: Thai Address : 77 Sukhumvit 38 Rd.,
Prakanong, Klongtoey, Bangkok |
1 |
|
Total Shareholders : 7
Share Structure [as
at March 28,
2013]
|
Nationality |
Shareholders |
No. of Share |
% Shares |
|
|
|
|
|
|
Thai |
7 |
44,974,966 |
100.00 |
|
Foreign |
- |
- |
- |
|
Total |
7 |
44,974,966 |
100.00 |
NAME OF AUDITOR
& CERTIFIED PUBLIC
ACCOUNTANT NO. :
Mr. Navee Patisampitavong No. 2552
BALANCE SHEET [BAHT]
The
2010-2013 financial
statements were not
submitted to the
Commercial Registration Department.
The
latest financial figures
published for December
31, 2009, 2008
& 2007 were:
ASSETS
|
Current Assets |
2009 |
2008 |
2007 |
|
|
|
|
|
|
Cash and Cash Equivalents |
549,130,738 |
391,966,226 |
239,238,560 |
|
Short-term Investment |
90,000,000 |
- |
- |
|
Trade Accounts Receivable - Parent
Company |
14,779,598 |
19,271,899 |
16,624,254 |
|
- Other
Company |
1,026,800,535 |
1,089,386,441 |
930,818,768 |
|
Inventories |
417,807,070 |
627,556,255 |
386,104,592 |
|
Refundable Value Added Tax |
9,793,338 |
12,108,928 |
20,781,067 |
|
Other Current Assets |
23,597,030 |
19,266,541 |
38,333,456 |
|
|
|
|
|
|
Total Current Assets
|
2,131,908,309 |
2,159,556,290 |
1,631,900,697 |
|
Cash at Bank
pledged as a
Collateral |
127,000,000 |
77,000,000 |
77,000,000 |
|
Reserve for Debt
Repayment under Rehabilitation Plan |
- |
321,302 |
318,936 |
|
Parent Company Receivable |
65,990,943 |
65,990,943 |
65,990,943 |
|
Fixed Assets |
2,883,331,362 |
3,023,755,163 |
3,146,966,756 |
|
Other Assets |
5,359,380 |
5,597,380 |
5,366,580 |
|
Total Assets |
5,213,589,994 |
5,332,221,078 |
4,927,543,912 |
LIABILITIES &
SHAREHOLDERS' EQUITY [BAHT]
|
Current Liabilities |
2009 |
2008 |
2007 |
|
|
|
|
|
|
Trade Accounts Payable - Parent
Company |
2,290,762,340 |
2,033,887,763 |
1,649,006,539 |
|
- Other
Company |
125,164,740 |
81,297,869 |
116,896,089 |
|
Current Portion of
Finance Lease Contract Liabilities
|
1,872,726 |
1,888,525 |
- |
|
Current Portion of
Liabilities under Debt Restructuring Plan |
468,358,797 |
418,904,270 |
278,263,199 |
|
Related Company Payable |
1,178,244 |
578,907 |
4,637,838 |
|
Other Current Liabilities |
29,427,840 |
93,938,100 |
22,167,609 |
|
|
|
|
|
|
Total Current Liabilities |
2,916,764,687 |
2,630,495,434 |
2,070,971,274 |
|
Finance Lease Contract
Liabilities |
1,375,916 |
3,276,890 |
- |
|
Debt Restructuring Plan - Parent
Company |
229,940,278 |
229,940,278 |
229,940,278 |
|
- Other
Company |
1,392,194,307 |
1,762,672,208 |
2,120,256,648 |
|
Total Liabilities |
4,540,275,188 |
4,626,384,810 |
4,421,168,200 |
|
|
|
|
|
|
Shareholders' Equity |
|
|
|
|
|
|
|
|
|
Share capital : Baht 10
par value authorized, issued
and fully paid share
capital 44,974,966 shares |
449,749,660 |
449,749,660 |
449,749,660 |
|
|
|
|
|
|
Capital Paid |
449,749,660 |
449,749,660 |
449,749,660 |
|
Retained Earning -
Unappropriated |
223,565,146 |
256,086,608 |
56,626,052 |
|
Total Shareholders' Equity |
673,314,806 |
705,836,268 |
506,375,712 |
|
Total Liabilities &
Shareholders' Equity |
5,213,589,994 |
5,332,221,078 |
4,927,543,912 |
PROFIT & LOSS ACCOUNT
|
Revenue |
2009 |
2008 |
2007 |
|
|
|
|
|
|
Sales |
3,228,879,716 |
4,199,348,689 |
3,889,557,785 |
|
Other Income |
55,812,692 |
84,308,037 |
20,956,599 |
|
Gain on Debt
Restructuring |
- |
- |
4,080,714,930 |
|
Total Revenues |
3,284,692,408 |
4,283,656,726 |
7,991,229,314 |
|
Expenses |
|
|
|
|
|
|
|
|
|
Cost of Sales
before Impact of Diminution of Fixed
Assets |
3,211,158,288 |
[4,020,899,717] |
3,695,053,535 |
|
Allowance for Diminution of
Inventories |
[9,031,067] |
[6,754,995] |
- |
|
Less: Impact of Diminution of Fixed Assets |
[77,661,138] |
77,661,138 |
[77,661,138] |
|
|
|
|
|
|
Cost of Sales
- Net |
3,124,466,083 |
3,949,993,574 |
3,617,392,397 |
|
Selling Expenses |
91,817,232 |
74,384,195 |
68,229,324 |
|
Administrative Expenses |
59,144,353 |
33,152,736 |
60,106,562 |
|
Factory Expenses during
Non-production |
40,480,951 |
26,516,459 |
27,520,628 |
|
Financial Expenses |
1,305,251 |
149,206 |
12,778,022 |
|
Total Expenses |
3,317,213,870 |
4,084,196,170 |
3,786,026,933 |
|
|
|
|
|
|
Net Profit / [Loss] |
[32,521,462] |
199,460,556 |
4,205,202,381 |
FINANCIAL ANALYSIS
|
ITEM |
UNIT |
2009 |
2008 |
2007 |
|
|
|
|
|
|
|
LIQUIDITY RATIO |
|
|
|
|
|
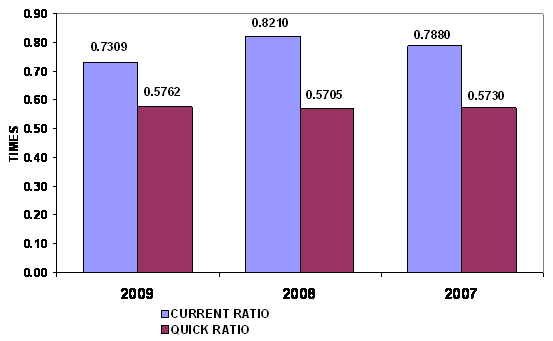
CURRENT RATIO |
TIMES |
0.73 |
0.82 |
0.79 |
|
QUICK RATIO |
TIMES |
0.58 |
0.57 |
0.57 |
|
|
|
|
|
|
|
ACTIVITY RATIO |
|
|
|
|
|
FIXED ASSETS TURNOVER |
TIMES |
1.12 |
1.39 |
1.24 |
|
TOTAL ASSETS TURNOVER |
TIMES |
0.62 |
0.79 |
0.79 |
|
INVENTORY CONVERSION PERIOD |
DAYS |
48.81 |
57.99 |
38.96 |
|
INVENTORY TURNOVER |
TIMES |
7.48 |
6.29 |
9.37 |
|
RECEIVABLES CONVERSION PERIOD |
DAYS |
116.07 |
94.69 |
87.35 |
|
RECEIVABLES TURNOVER |
TIMES |
3.14 |
3.85 |
4.18 |
|
PAYABLES CONVERSION PERIOD |
DAYS |
14.62 |
7.51 |
11.79 |
|
CASH CONVERSION CYCLE |
DAYS |
150.26 |
145.16 |
114.51 |
|
|
|
|
|
|
|
PROFITABILITY
RATIO |
|
|
|
|
|
COST OF GOODS SOLD |
% |
96.77 |
94.06 |
93.00 |
|
SELLING & ADMINISTRATION |
% |
5.93 |
3.19 |
4.01 |
|
INTEREST |
% |
0.04 |
0.00 |
0.33 |
|
GROSS PROFIT MARGIN |
% |
4.96 |
7.95 |
112.45 |
|
NET PROFIT MARGIN BEFORE EX. ITEM |
% |
(1.01) |
4.75 |
108.12 |
|
NET PROFIT MARGIN |
% |
(1.01) |
4.75 |
108.12 |
|
RETURN ON EQUITY |
% |
(4.83) |
28.26 |
830.45 |
|
RETURN ON ASSET |
% |
(0.62) |
3.74 |
85.34 |
|
EARNING PER SHARE |
BAHT |
(0.72) |
4.43 |
93.50 |
|
|
|
|
|
|
|
LEVERAGE RATIO |
|
|
|
|
|
DEBT RATIO |
TIMES |
0.87 |
0.87 |
0.90 |
|
DEBT TO EQUITY RATIO |
TIMES |
6.74 |
6.55 |
8.73 |
|
TIME INTEREST EARNED |
TIMES |
(24.92) |
1,336.81 |
329.10 |
|
|
|
|
|
|
|
ANNUAL GROWTH |
|
|
|
|
|
SALES GROWTH |
% |
(23.11) |
7.96 |
|
|
OPERATING PROFIT |
% |
(116.30) |
(95.26) |
|
|
NET PROFIT |
% |
(116.30) |
(95.26) |
|
|
FIXED ASSETS |
% |
(4.64) |
(3.92) |
|
|
TOTAL ASSETS |
% |
(2.22) |
8.21 |
|
ANNUAL GROWTH :
RISKY
An annual sales growth is -23.11%. Turnover has decreased from THB
4,199,348,689.00 in 2008 to THB 3,228,879,716.00 in 2009. While net profit has decreased
from THB 199,460,556.00 in 2008 to THB -32,521,462.00 in 2009. And total assets
has decreased from THB 5,332,221,078.00 in 2008 to THB 5,213,589,994.00 in
2009.
PROFITABILITY :
RISKY

PROFITABILITY
RATIO
|
Gross Profit Margin |
4.96 |
Deteriorated |
Industrial Average |
82.19 |
|
Net Profit Margin |
(1.01) |
Deteriorated |
Industrial Average |
14.17 |
|
Return on Assets |
(0.62) |
Deteriorated |
Industrial Average |
18.28 |
|
Return on Equity |
(4.83) |
Deteriorated |
Industrial Average |
48.85 |
Gross Profit Margin used to assess a firm's financial health by
revealing the proportion of money left over from revenues after accounting for
the cost of goods sold. Gross profit margin serves as the source for paying
additional expenses and future savings. The company's figure is 4.96%. When
compared with the industry average, the ratio of the company was lower. This
indicated that company may have problems with control over its costs.
Net Profit Margin is the indicator of the company's efficiency in that
net profit takes into consideration all expenses of the company. A low profit
margin indicates a low margin of safety, higher risk that a decline in sales
will erase profits and result in a net loss. The company's figure is -1.01%.
When compared with the industry average, the ratio of the company was lower.
Return on Assets measures how efficiently profits are being generated
from the assets employed in the business when compared with the ratios of firms
in a similar business. A low ratio in comparison with industry averages
indicates an inefficient use of business assets. When compared with the
industry average, it was lower, the company's figure is -0.62%.
Return on Equity indicates how profitable a company is by comparing its
net income to its average shareholders' equity, ROE measures how much the
shareholders earned for their investment in the company. When compared with the
industry average, it was lower, the company's figure is -4.83%.
Trend of the
average competitors in the same industry for last 5 years
Return on Assets Downtrend
Return on Equity Downtrend
LIQUIDITY : RISKY
LIQUIDITY RATIO
|
Current Ratio |
0.73 |
Risky |
Industrial Average |
0.66 |
|
Quick Ratio |
0.58 |
|
|
|
|
Cash Conversion Cycle |
150.26 |
|
|
|
The Current Ratio is to ascertain whether a company's short-term assets
are readily available to pay off its short-term liabilities. The company's figure
is 0.73 times in 2009, decrease from 0.82 times, then the company may not be
efficiently using its current assets. When compared with the industry average,
the ratio of the company was higher, indicated that company was an efficient
operator in a dominant position within its industry.
The Quick Ratio is a liquidity indicator that further refines the
current ratio by measuring the amount of the most liquid current assets there
are to cover current liabilities. The company's figure is 0.58 times in 2009,
increase from 0.57 times, then the company has not enough current assets that
presumably can be quickly converted to cash for pay financial obligations.
The Cash Conversion Cycle measures the number of days a company's cash
is tied up in the production and sales process of its operations and the
benefit from payment terms from its creditors. It meant the company could
survive when no cash inflow was received from sale for 151 days.
Trend of the
average competitors in the same industry for last 5 years
Current Ratio Downtrend
LEVERAGE : RISKY


LEVERAGE RATIO
|
Debt Ratio |
0.87 |
Acceptable |
Industrial Average |
0.55 |
|
Debt to Equity Ratio |
6.74 |
Risky |
Industrial Average |
1.21 |
|
Times Interest Earned |
(24.92) |
Risky |
Industrial Average |
- |
Debt to Equity Ratio a measurement of how much suppliers, lenders,
creditors and obligors have committed to the company versus what the
shareholders have committed. A higher the percentage means that the company is using
less equity and has stronger leverage position.
Times Interest Earned measuring a company's ability to meet its debt
obligations. Ratio is -24.92 lower than 1, so the company is not generating
enough cash from EBIT to meet its interest obligations.
Debt Ratio shows the proportion of a company's assets which are financed
through debt. The company's figure is 0.87 greater than 0.5, most of the
company's assets are financed through debt.
Trend of the
average competitors in the same industry for last 5 years
Debt Ratio Downtrend
Times Interest Earned Stable
ACTIVITY :
SATISFACTORY

ACTIVITY RATIO
|
Fixed Assets Turnover |
1.12 |
Impressive |
Industrial Average |
- |
|
Total Assets Turnover |
0.62 |
Deteriorated |
Industrial Average |
1.49 |
|
Inventory Conversion Period |
48.81 |
|
|
|
|
Inventory Turnover |
7.48 |
Impressive |
Industrial Average |
7.23 |
|
Receivables Conversion Period |
116.07 |
|
|
|
|
Receivables Turnover |
3.14 |
Deteriorated |
Industrial Average |
7.31 |
|
Payables Conversion Period |
14.62 |
|
|
|
The company's Account Receivable Ratio is calculated as 3.14 and 3.85 in
2009 and 2008 respectively. This ratio measures the efficiency of the company in
managing its trade debtors to generate revenue. A lower ratio may indicate over
extension and collection problems. Conversely, a higher ratio may indicate an
overtly stringent policy. In this case, the company's A/R ratio in 2009
decreased from 2008. This would suggest the company had deteriorated in the
management of its debt collections.
Inventory Turnover in Days Ratio indicates the liquidity of inventory.
It estimates the number of days that it will take to sell the current
inventory. Inventory is particularly sensitive to change in business
activities. The inventory turnover in days has decreased from 58 days at the
end of 2008 to 49 days at the end of 2009. This represents a positive trend.
And Inventory turnover has increased from 6.29 times in year 2008 to 7.48 times
in year 2009.
The company's Total Asset Turnover is calculated as 0.62 times and 0.79
times in 2009 and 2008 respectively. This ratio is determined by dividing total
assets into total sales turnover. The ratio measures the activity of the assets
and the ability of the firm to generate sales through the use of the assets.
Trend of the
average competitors in the same industry for last 5 years
Fixed Assets Turnover Stable
Total Assets Turnover Downtrend
Inventory Turnover Downtrend
Receivables Turnover Downtrend
FOREIGN EXCHANGE RATES
|
Currency |
Unit
|
Indian Rupees |
|
US Dollar |
1 |
Rs.61.89 |
|
UK Pound |
1 |
Rs.96.83 |
|
Euro |
1 |
Rs.76.57 |
INFORMATION DETAILS
|
Analysis Done by
: |
KAR |
|
|
|
|
Report Prepared by
: |
MNL |
RATING EXPLANATIONS
|
RATING |
STATUS |
PROPOSED CREDIT LINE |
|
|
>86 |
Aaa |
Possesses an extremely sound financial base with the strongest
capability for timely payment of interest and principal sums |
Unlimited |
|
71-85 |
Aa |
Possesses adequate working capital. No caution needed for credit
transaction. It has above average (strong) capability for payment of interest
and principal sums |
Large |
|
56-70 |
A |
Financial & operational base are regarded healthy. General unfavourable
factors will not cause fatal effect. Satisfactory capability for payment of
interest and principal sums |
Fairly Large |
|
41-55 |
Ba |
Overall operation is considered normal. Capable to meet normal
commitments. |
Satisfactory |
|
26-40 |
B |
Capability to overcome financial difficulties seems comparatively
below average. |
Small |
|
11-25 |
Ca |
Adverse factors are apparent. Repayment of interest and principal sums
in default or expected to be in default upon maturity |
Limited with full
security |
|
<10 |
C |
Absolute credit risk exists. Caution needed to be exercised |
Credit not
recommended |
|
-- |
NB |
New Business |
-- |
This score serves as a reference to assess SC’s credit risk
and to set the amount of credit to be extended. It is calculated from a
composite of weighted scores obtained from each of the major sections of this
report. The assessed factors and their relative weights (as indicated through
%) are as follows:
Financial
condition (40%) Ownership
background (20%) Payment
record (10%)
Credit history
(10%) Market trend
(10%) Operational
size (10%)
This report is issued at your request without any
risk and responsibility on the part of MIRA INFORM PRIVATE LIMITED (MIPL) or
its officials.