MIRA INFORM REPORT
|
Report Date : |
10.12.2014 |
IDENTIFICATION DETAILS
|
Name : |
SOCIEDAD ANONIMA ROBAMA |
|
|
|
|
Registered Office : |
Crta. Nacional Ii, Km
680,60 P.Ind.Mas Puigvert. - Palafolls - 08389 – |
|
|
|
|
Country : |
|
|
|
|
|
Financials (as on) : |
2013 |
|
|
|
|
Date of Incorporation : |
26.12.1966 |
|
|
|
|
Legal Form : |
Private Company |
|
|
|
|
Line of Business : |
· Manufacturer of dyes and pigments · Engaged in manufacturing and sale of optical and Auxiliary Brighteners, mainly for the Paper, Textile and Leather Industry. · subject operates in three business units are as follows: o Paper Business Unit (Optical Brighteners & Dyestuffs) o Textile Business Unit (Dyes & Textile Auxiliaries) o Leather Business Unit (Leather) |
|
|
|
|
No of Employees : |
61 (2013) |
RATING & COMMENTS
|
MIRA’s Rating : |
Ba |
|
RATING |
STATUS |
PROPOSED CREDIT LINE |
|
|
41-55 |
Ba |
Overall operation is considered normal. Capable to meet normal
commitments. |
Satisfactory |
|
Status : |
Satisfactory |
|
Payment Behaviour : |
No Complaints |
|
Litigation : |
Clear |
NOTES :
Any query related to this report can be made
on e-mail : infodept@mirainform.com
while quoting report number, name and date.
ECGC Country Risk Classification List – September 30, 2014
|
Country Name |
Previous Rating (30.06.2014) |
Current Rating (30.09.2014) |
|
|
A2 |
A2 |
|
Risk Category |
ECGC
Classification |
|
Insignificant |
A1 |
|
Low |
A2 |
|
Moderate |
B1 |
|
High |
B2 |
|
Very High |
C1 |
|
Restricted |
C2 |
|
Off-credit |
D |
|
Source : CIA |
EXECUTIVE SUMMARY
|
Name: |
SOCIEDAD
ANONIMA ROBAMA |
|
NIF
/ Fiscal code: |
A08044299 |
|
Trade
Name |
ROBAMA |
|
Status: |
ACTIVE |
|
Incorporation
Date: |
26/12/1966 |
|
Legal Form |
Private Company |
|
Register
Data |
Register
Section 8 Sheet 44044 |
|
Last
Publication in BORME: |
24/11/2014
[Appointments] |
|
Last
Published Account Deposit: |
2013 |
|
Share
Capital: |
276.465,57 |
|
|
|
|
Localization: |
CRTA.
NACIONAL II, KM 680,60 P.IND.MAS PUIGVERT. - PALAFOLLS - 08389 - |
|
Telephone
- Fax - Email - Website: |
Ph.:.
937 669 000 Email. info@robama.com Website.
www.robama.com |
|
|
|
|
Activity: |
|
|
|
· Manufacturer of dyes and pigments · Engaged in manufacturing and sale of optical and Auxiliary Brighteners, mainly for the Paper, Textile and Leather Industry. · subject operates in three business units are as follows: o Paper Business Unit (Optical Brighteners & Dyestuffs) o Textile Business Unit (Dyes & Textile Auxiliaries) o Leather Business Unit (Leather) |
|
Registered
Trademarks: |
|
|
Audited
/ Opinion: |
Si
/ |
|
Tenders
and Awards: |
0
for a total cost of 0 |
|
Subsidies: |
3
for a total cost of 141716.65 |
|
Quality
Certificate: |
No |
|
|
|
|
|
More
than adequate capacity to meet its financial obligations. However, this capacity
has a higher probability to deteriorate in the mid-long term than in higher
categories. |
|
|
|
|
Defaults,
Legal Claims and Insolvency Proceedings : |
|
|
|
|
Number |
Amount
(€) |
Most
Recent Entry |
|
Insolvency
Proceedings, Bankruptcy and Suspension of Payments |
|
Unpublished |
--- |
--- |
|
Defaults
on debt with Financial Institutions and Large Companies |
|
None |
--- |
--- |
|
Judicial
Claims (Notices, Executive Proceedings, Attachments, Auctions, Bad Debt) |
|
None |
0 |
--- |
|
Proceedings
heard by the |
|
Unpublished |
0 |
--- |
|
Proceedings
heard by the |
|
Unpublished |
0 |
--- |
Partners
|
|
TRUMPLER
ESPAÑOLA SA |
60
% |
|
|
Shares: |
1 |
|
|
Other
Links: |
4 |
|
|
No.
of Active Corporate Bodies: |
|
|
|
Ratios |
2013 |
2012 |
Change |
|
|
Nº
of employees: |
61 |
|
|
|
Guarantees
|
Properties
Registered: |
Company
NO, Administrator NO |
|
Financing
/ Guarantee Sources : |
Sources
YES, Guarantees YES |
|
|
|
INVESTIGATION SUMMARY
|
|
|
The firm was established in 1996, and continues the business started by the families Rovira, Bachs and Maciá back in 1925. It is engaged in the manufacture and sale of chemicals and develops its activity both nationally and internationally. There is no evidence of any default in the sources consulted, although according to the last figures filed at the Trade Registry, it can be noticed that despite the results of the fiscal year are positive(740,619 Euro/s), there are still losses from past fiscal years (-2,339,849 Euro/s). Its own funds are positive in 4, 060,785 Euros. Although it is considered apt to keep being related to usual risk operations, it is advisable to monitore its commercial evolution in an on-going basis. |
|
|
Identification
|
|
|
Social
Denomination: |
SOCIEDAD ANONIMA ROBAMA |
|
Trade
Name: |
ROBAMA |
|
NIF
/ Fiscal code: |
A08044299 |
|
Corporate
Status: |
ACTIVE |
|
Start
of activity: |
1925 |
|
Registered
Office: |
CRTA. NACIONAL II, KM
680,60 P.IND.MAS PUIGVERT. |
|
Locality: |
PALAFOLLS |
|
Province: |
|
|
Postal
Code: |
08389 |
|
Telephone: |
937 669 000 |
|
Fax: |
937 669 011 |
|
Website: |
|
|
Email: |
|
|
Interviewed
Person: |
This information was
obtained through indirect sources, due to the refusal by the responsible
members of the society to provide any collaboration. |
Activity
|
NACE: |
2012 |
|
CNAE
Obtaining Source: |
2012 |
|
Additional
Information: |
Manufacture and sale of
optical and auxiliary brighteners, mainly for the paper, textile and leather
industry. |
|
Franchise: |
No |
|
Import
/ export: |
IMPORTS / EXPORTS |
|
Future
Perspective: |
Consolidation |
|
Industry
situation: |
Maturity |
Number of Employees
|
|
Year |
No. of employees |
Established |
Incidentals |
|
|
|
2013 |
61 |
|
|
|
Chronological
Summary
|
|
|
|
|
|
|
Year |
Act |
|
|
|
1990 |
Accounts deposit (ejer.
1989) |
|
|
|
1991 |
Accounts deposit (ejer.
1990) Appointments/ Re-elections (1) |
|
|
|
1992 |
Accounts deposit (ejer.
1991) Adaptation to Law (1) Appointments/ Re-elections (1) Other Concepts/ Events
(1) Statutory Modifications (1) |
|
|
|
1993 |
Accounts deposit (ejer.
1992) Appointments/ Re-elections (1) Cessations/ Resignations/ Reversals (1)
Statutory Modifications (1) |
|
|
|
1994 |
Accounts deposit (ejer. 1993)
Appointments/ Re-elections (4) Cessations/ Resignations/ Reversals (3) |
|
|
|
1995 |
Accounts deposit (ejer.
1994) Appointments/ Re-elections (1) Cessations/ Resignations/ Reversals (1)
Change of Social address (1) |
|
|
|
1996 |
Accounts deposit (ejer.
1995) |
|
|
|
1997 |
Accounts deposit (ejer.
1996) Appointments/ Re-elections (1) Cessations/ Resignations/ Reversals (1)
Increase of Capital (1) Take-over Merger (4) |
|
|
|
1998 |
Appointments/ Re-elections
(3) Cessations/ Resignations/ Reversals (2) Take-over Merger (1) |
|
|
|
1999 |
Accounts deposit (ejer.
1997, 1998) |
|
|
|
2001 |
Accounts deposit (ejer.
1999, 2000) |
|
|
|
2002 |
Declaration of Sole Propietorship
(1) Loss of the sole propietorship condition (1) Other Concepts/ Events (2)
Take-over Merger (5) |
|
|
|
2003 |
Accounts deposit (ejer.
2001, 2002) Appointments/ Re-elections (1) |
|
|
|
2004 |
Appointments/ Re-elections
(1) Other Concepts/ Events (1) |
|
|
|
2005 |
Accounts deposit (ejer.
2003, 2004) Appointments/ Re-elections (2) Cessations/ Resignations/
Reversals (1) |
|
|
|
2006 |
Accounts deposit (ejer.
2005) Appointments/ Re-elections (1) |
|
|
|
2007 |
Accounts deposit (ejer.
2006) Appointments/ Re-elections (1) Cessations/ Resignations/ Reversals (1)
Change of Social address (1) |
|
|
|
2008 |
Accounts deposit (ejer. 2007)
Appointments/ Re-elections (2) Cessations/ Resignations/ Reversals (1) |
|
|
|
2009 |
Accounts deposit (ejer.
2008) |
|
|
|
2010 |
Accounts deposit (ejer.
2009) |
|
|
|
2011 |
Accounts deposit (ejer. 2010)
Appointments/ Re-elections (3) Cessations/ Resignations/ Reversals (2) |
|
|
|
2012 |
Accounts deposit (ejer.
2011) |
|
|
|
2013 |
Accounts deposit (ejer.
2012) Appointments/ Re-elections (1) Cessations/ Resignations/ Reversals (1) Statutory
Modifications (1) |
|
|
|
2014 |
Accounts deposit (ejer.
2013) Appointments/ Re-elections (3) Cessations/ Resignations/ Reversals (1) |
|
Breakdown of Owners' Equity
|
|
|
Registered
Capital: |
276.465,57 |
|
Paid
up capital: |
276.465,57 |
Updated Evolution of the
Subscribed and Paid-in Capital
|
|||||
|
|
|
|
|
|
|
|
Publishing Date |
Registration Type |
Capital Subscribed |
Paid up capital |
Underwritten result |
Disbursed Result |
|
14/08/1997 |
Increase of Capital |
66.111 |
66.111 |
276.466 |
276.466 |
Active Social Bodies
|
Post published |
Social Body's Name |
Appointment Date |
Other Positions in this
Company |
|
PRESIDENT |
BARENYS MARTINEZ JOAN |
24/04/2013 |
2 |
|
MEMBER OF THE BOARD |
HENRICUS ADRIANUS ANTONIUS
MARIA VUGS |
17/11/2014 |
1 |
|
|
GIL CALVO PILAR |
24/04/2013 |
4 |
|
|
BARENYS MARTINEZ JOAN |
24/04/2013 |
2 |
|
|
CHRISTIAN JOHANN JACOB
FRIEDRICH ROSS |
30/09/1998 |
1 |
|
JOINT ATTORNEY |
RIUS PALLEIRO JAVIER |
02/07/2014 |
1 |
|
|
GARCIA SANZ CONCEPCION |
02/07/2014 |
1 |
|
PROXY |
BARENYS MARTINEZ JUAN |
20/07/2011 |
3 |
|
|
PEREZ CARRETERO SALVADOR |
20/07/2011 |
3 |
|
NON CONSELLOR SECRETARY |
MARIMON PRATS LUIS F |
24/04/2013 |
1 |
|
ACCOUNTS' AUDITOR / HOLDER |
IBERAUDIT MRM
AUDICONSULTING SLP |
25/09/2014 |
2 |
Historical Social Bodies
|
Social Body's Name |
Post published |
End Date |
Other Positions in this
Company |
|
AUDICONSULTING IBERIA MRM
SLP |
ACCOUNTS' AUDITOR / HOLDER |
04/11/2011 |
1 |
|
BACHS TORRES JUAN |
MEMBER OF THE BOARD |
05/10/1994 |
2 |
|
|
PRESIDENT |
05/10/1994 |
|
|
BAILLES LOPEZ FRANCISCO |
PROXY |
03/05/1994 |
1 |
|
BARENYS MARTINEZ JORDI |
PROXY |
24/04/2013 |
1 |
|
BARENYS MARTINEZ JORDI
MARIA |
PRESIDENT |
25/07/2008 |
11 |
|
|
PROXY |
20/07/2011 |
|
|
|
PROXY |
03/11/1998 |
|
|
|
PROXY |
11/11/1998 |
|
|
|
PROXY |
20/08/2007 |
|
|
|
MEMBER OF THE BOARD |
25/07/2008 |
|
|
|
PROXY |
22/09/1997 |
|
|
|
MEMBER OF THE BOARD |
09/10/2003 |
|
|
|
PRESIDENT |
09/10/2003 |
|
|
|
MEMBER OF THE BOARD |
24/04/2013 |
|
|
|
PRESIDENT |
24/04/2013 |
|
|
BARENYS MARTINEZ JUAN |
PROXY |
20/08/2007 |
3 |
|
|
PROXY |
20/07/2011 |
|
|
BARENYS MARTORELL ANTONIO |
MEMBER OF THE BOARD |
28/12/1994 |
3 |
|
|
CHIEF EXECUTIVE OFFICER |
28/12/1994 |
|
|
|
PRESIDENT |
28/12/1994 |
|
|
CHRISTIAN JOHANN JACOB
FRIEDRICH ROOS |
MEMBER OF THE BOARD |
28/04/2011 |
2 |
|
|
MEMBER OF THE BOARD |
25/07/2008 |
|
|
CHRISTIAN ROSS |
CHIEF EXECUTIVE OFFICER |
30/09/1998 |
1 |
|
COOPERS AND LYBRAND SA |
ACCOUNTS' AUDITOR / HOLDER |
07/10/2004 |
1 |
|
FABREGAS MERCADE Y CO
AUDITORES CONSULTORES SL |
ACCOUNTS' AUDITOR / HOLDER |
17/11/2008 |
1 |
|
FIMSA SL |
SINGLE PARTNER |
18/10/2002 |
1 |
|
GARCIA CAIRO POCH Y CIA
AUDITORES ASOCIADOS |
ACCOUNTS' AUDITOR / HOLDER |
23/02/1995 |
1 |
|
GIL CALVO PILAR |
MEMBER OF THE BOARD |
25/07/2008 |
4 |
|
|
MEMBER OF THE BOARD |
09/10/2003 |
|
|
|
MEMBER OF THE BOARD |
24/04/2013 |
|
|
GIL PABLO MANUEL |
MEMBER OF THE BOARD |
30/09/1998 |
3 |
|
|
PROXY |
20/08/2007 |
|
|
|
CHIEF EXECUTIVE OFFICER |
30/09/1998 |
|
|
IBERAUDIT MRM AUDICONSULTING
SLP |
ACCOUNTS' AUDITOR / HOLDER |
25/09/2014 |
2 |
|
LOPEZ BOTELLA MARIANO |
PROXY |
22/09/1997 |
1 |
|
MACIA CASALS VICTOR |
MEMBER OF THE BOARD |
05/10/1994 |
5 |
|
|
PROXY |
20/08/2007 |
|
|
|
CHIEF EXECUTIVE OFFICER |
20/10/1993 |
|
|
|
CHIEF EXECUTIVE OFFICER |
05/10/1994 |
|
|
|
SECRETARY |
05/10/1994 |
|
|
MARIMON GARNIER LUIS
FRANCISCO |
NON CONSELLOR SECRETARY |
24/04/2013 |
1 |
|
NORBERT SCHUSTER |
MEMBER OF THE BOARD |
30/09/1998 |
4 |
|
|
MEMBER OF THE BOARD |
09/10/2003 |
|
|
|
MEMBER OF THE BOARD |
03/02/2005 |
|
|
|
PRESIDENT |
30/09/1998 |
|
|
PEREZ CARRETERO SALVADOR |
PROXY |
20/08/2007 |
3 |
|
|
PROXY |
20/07/2011 |
|
|
PRICE WATERHOUSE COOPERS
AUDITORES SL |
ACCOUNTS' AUDITOR / HOLDER |
29/09/2005 |
3 |
|
|
ACCOUNTS' AUDITOR / HOLDER |
16/11/2005 |
|
|
|
ACCOUNTS' AUDITOR / HOLDER |
30/10/2006 |
|
|
ROOS CHRISTIAN JOHANN
JACOB FRIEDRICH |
MEMBER OF THE BOARD |
30/09/1998 |
1 |
|
ROVIRA DE CAMPS RAMON |
MEMBER OF THE BOARD |
05/10/1994 |
5 |
|
|
PROXY |
20/08/2007 |
|
|
|
CHIEF EXECUTIVE OFFICER |
20/10/1993 |
|
|
|
CHIEF EXECUTIVE OFFICER |
05/10/1994 |
|
|
|
VICE CHAIRMAN |
05/10/1994 |
|
|
THOMAS HARTMUT FEIGEL |
MEMBER OF THE BOARD |
24/04/2013 |
2 |
|
|
MEMBER OF THE BOARD |
17/11/2014 |
|
Executive board
|
Post |
NIF |
Name |
|
FINANCIAL DIRECTOR |
|
SALVADOR PEREZ CARRETERO |
|
MANAGING DIRECTOR |
|
JORGE BARENYS |
Defaults, Legal Claims and
Insolvency Proceedings
|
Section enabling assessment of the degree of compliance of the company
queried with its payment obligations. It provides information on the existence
and nature of all stages of Insolvency and Legal Proceedings published with
reference to the Company in the country's various Official Bulletins and
national newspapers, as well Defaults Registered in the main national credit
bureaus (ASNEF Industrial and RAI ).
Summary
Chronological
summary
|
|
|
Number
of Publications |
Amount
(_) |
Start
date |
End
date |
|
Insolvency
Proceedings, Bankruptcy and Suspension of Payments |
|
Unpublished |
--- |
--- |
--- |
|
Request/Declaration |
|
0 |
--- |
date |
|
|
Proceedings |
|
--- |
--- |
|
--- |
|
Resolution |
|
--- |
--- |
|
--- |
|
Defaults
on debt with Financial Institutions and Large Companies |
Bank and Commercial Delinquency |
None |
0 |
|
|
|
Status:
Friendly |
|
--- |
|
|
|
|
Status:
Pre-Litigation |
|
--- |
|
|
|
|
Status:
Litigation |
|
--- |
|
|
|
|
Status:
Non-performing |
|
--- |
|
|
|
|
Status:
insolvency proceedings, bankruptcy and suspension of payments |
|
--- |
|
|
|
|
Other
status |
|
--- |
|
|
|
|
Legal
and Administrative Proceedings |
|
Unpublished |
--- |
|
|
|
Notices
of defaults and enforcement |
|
--- |
--- |
|
--- |
|
Seizures |
|
--- |
--- |
|
--- |
|
Auctions |
|
--- |
--- |
|
--- |
|
Declarations
of insolvency and bad debt |
|
--- |
--- |
|
--- |
|
Proceedings
heard by the Civil Court |
|
Unpublished |
--- |
|
|
|
Proceedings
heard by the Labour Court |
|
Unpublished |
--- |
|
|
Details
Probability of default
> Estimated Probability of Default for the next 12 months: 0.917 %
> Latest Scoring Changes:
|
Sector in which comparison is carried out: 201 Manufacture of basic chemicals, fertilisers and nitrogen compounds, plastics and synthetic rubber in primary forms |
|
|
Relative
Position:
|
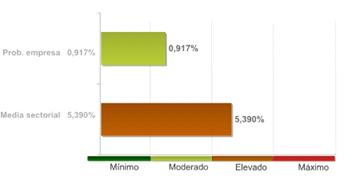
The
company's comparative analysis with the rest of the companies that comprise the
sector, shows the company holds a better position with regard to the
probability of non-compliance.
The
93.00% of the companies of the sector SOCIEDAD ANONIMA ROBAMA belongs to show a
higher probability of non-compliance.
The
probability of the company's non-compliance with its payment obligations within
deadlines estimated by our qualifications models is 0.917%.
In the event they fail to comply with the payment, the seriousness of the loss will depend on factors such as the promptness of the commencement of the charging management, the existence of executive documents which match the credit or the existence of guarantees and free debt assets under the name of the debtor. Therefore, the probability of non-compliance should not be solely interpreted as the total loss of the owed amount.
|
Result of query submitted to the R.A.I. (Spanish
Bad Debt Register) on |
LEGAL CLAIMS
|
|
Summary
of Judicial Claims |
|
|
|
|
|
|
|
No se han publicado |
|
|
|
No se han publicado |
|
|
|
|
|
|
|
No se han publicado |
|
|
|
No se han publicado |
|
|
|
No se han publicado |
|
|
|
No se han publicado |
|
|
|
|
|
|
|
No se han publicado |
|
|
|
No se han publicado |
|
|
|
|
|
|
|
No se han publicado |
References
|
|
Suppliers |
|
|
|
Name |
NIF |
Telephone |
|
|
|
SAIKA |
|
|
|
|
|
UNIXPER |
|
|
|
|
|
BACHUS |
|
|
|
Link List
|
ABSORBS TO: |
2 Entities |
|
IS RELATED WITH: |
2 Entities |
|
PARTICIPATES IN: |
1 Entities |
|
SHAREHOLDERS: |
1 Entities |
Shareholders
|
Relationship |
Entity |
Province |
Shareholding stake |
|
SHAREHOLDERS |
TRUMPLER ESPAÑOLA SA |
BARCELONA |
60 |
|
PARTICIPATES IN |
ROBAMA, SOCIEDAD ANONIMA,
DE CV (MEXICO) |
|
99 |
Other relationships
|
Relationship |
Entity |
Province |
Shareholding stake |
|
IS RELATED WITH |
| | |
|
|
|
|
ARGENTINA TRUMPLER |
|
|
|
|
TRUMPLER, SOCIEDAD
ANONIMA, & CO CHEMISCHE FABRIK ( ALEMANIA) |
|
|
|
ABSORBS TO |
COMPAÑIA DE INVERSIONES Y
RAICES, S.A. |
BARCELONA |
|
|
|
FIMSA SA |
BARCELONA |
|
Turnover
|
|
|
Total
Sales 2013 |
18.208.940,38 |
|
Financial Accounts and Balance Sheets
|
Financial Years Presented
|
Ejercicio |
Tipo
de Cuentas Anuales |
Fecha
Presentacion |
|
2013 |
Normales |
August
2014 |
|
2012 |
Normales |
June
2013 |
|
2011 |
Normales |
June
2012 |
|
2010 |
Normales |
July
2011 |
|
2009 |
Normales |
August
2010 |
|
2008 |
Normales |
July
2009 |
|
2007 |
Normales |
October
2008 |
|
2006 |
Normales |
July
2007 |
|
2005 |
Normales |
September
2006 |
|
2004 |
Normales |
October
2005 |
|
2003 |
Normales |
December
2004 |
|
2002 |
Normales |
September
2003 |
|
2001 |
Normales |
December
2002 |
|
2000 |
Normales |
October
2001 |
|
1999 |
Normales |
January
2001 |
|
1998 |
Normales |
July
1999 |
|
1997 |
Normales |
December
1998 |
|
1996 |
Normales |
September
1997 |
|
1995 |
Normales |
July
1996 |
|
1994 |
Normales |
July
1995 |
|
1993 |
Normales |
October
1994 |
|
1992 |
Normales |
July
1993 |
|
1991 |
Normales |
July
1992 |
|
1990 |
Normales |
August
1991 |
|
1989 |
Normales |
September
1990 |
The
data in the report regarding the last Company Accounts submitted by the company
is taken from the TRADE REGISTER serving the region in which the company's
address is located 31/12/2013
> Balance en formato Normal de acuerdo al Nuevo Plan
General Contable 2007
Information corresponding to the fiscal year 2013 2012 2011 2010 2009 is taken from information submitted to the TRADE REGISTER. Data corresponding to fiscal years before 2013 2012 2011 2010 2009 has been compiled based on the equivalence criteria stipulated in Act JUS/206/2009. Where the provisions of the Act did not establish relevant equivalence criteria
|
|
ORIGINAL |
ORIGINAL |
ORIGINAL |
ORIGINAL |
ORIGINAL |
|
|
Assets |
2013 |
2012 |
2011 |
2010 |
2009 |
|
|
A)
NON-CURRENT ASSETS: 11000 |
3.647.587,00 |
3.970.547,00 |
4.252.410,00 |
4.125.301,00 |
4.542.094,00 |
|
|
I. Intangible fixed assets : 11100 |
37.364,00 |
32.333,00 |
3.510,00 |
11.348,00 |
24.954,00 |
|
|
1. Development: 11110 |
0,00 |
0,00 |
0,00 |
0,00 |
0,00 |
|
|
2. Concessions: 11120 |
0,00 |
0,00 |
0,00 |
0,00 |
0,00 |
|
|
3. Patents, licencing, trade marks and
similar: 11130 |
14,00 |
957,00 |
2.684,00 |
5.457,00 |
8.918,00 |
|
|
4. Goodwill: 11140 |
0,00 |
0,00 |
0,00 |
0,00 |
0,00 |
|
|
5. IT applications: 11150 |
37.350,00 |
31.376,00 |
826,00 |
5.891,00 |
16.037,00 |
|
|
6. Investigation: 11160 |
0,00 |
0,00 |
0,00 |
0,00 |
0,00 |
|
|
7. Intellectual property: 11180 |
0,00 |
0,00 |
0,00 |
0,00 |
0,00 |
|
|
8. Greenhouse gas emission allowance:
11190 |
0,00 |
0,00 |
0,00 |
0,00 |
0,00 |
|
|
9. Other intangible fixed assets. :
11170 |
0,00 |
0,00 |
0,00 |
0,00 |
0,00 |
|
|
II. Tangible fixed assets : 11200 |
2.962.721,00 |
3.190.710,00 |
3.370.281,00 |
3.656.981,00 |
4.069.179,00 |
|
|
1. Land and buildings: 11210 |
1.763.272,00 |
1.818.892,00 |
1.860.201,00 |
1.947.536,00 |
2.015.298,00 |
|
|
2. Technical installations and other
tangible fixed assets: 11220 |
1.182.985,00 |
1.364.068,00 |
1.335.825,00 |
1.523.963,00 |
1.868.399,00 |
|
|
3. Tangible asset in progress and
advances: 11230 |
16.463,00 |
7.750,00 |
174.255,00 |
185.482,00 |
185.482,00 |
|
|
III. Real estate investment: 11300 |
0,00 |
0,00 |
0,00 |
0,00 |
0,00 |
|
|
1. Land: 11310 |
0,00 |
0,00 |
0,00 |
0,00 |
0,00 |
|
|
2. Buildings: 11320 |
0,00 |
0,00 |
0,00 |
0,00 |
0,00 |
|
|
IV. Long-term investments in Group companies and associates :
11400 |
581.175,00 |
721.291,00 |
861.406,00 |
441.059,00 |
441.059,00 |
|
|
1. Equity instruments: 11410 |
441.059,00 |
441.059,00 |
441.059,00 |
441.059,00 |
441.059,00 |
|
|
2. Credits to businesses: 11420 |
140.116,00 |
280.231,00 |
420.347,00 |
0,00 |
0,00 |
|
|
3. Debt securities: 11430 |
0,00 |
0,00 |
0,00 |
0,00 |
0,00 |
|
|
4. Derivatives : 11440 |
0,00 |
0,00 |
0,00 |
0,00 |
0,00 |
|
|
5. Other financial assets : 11450 |
0,00 |
0,00 |
0,00 |
0,00 |
0,00 |
|
|
6. Other investments: 11460 |
0,00 |
0,00 |
0,00 |
0,00 |
0,00 |
|
|
V. Long-term financial investments: 11500 |
18.746,00 |
17.213,00 |
17.213,00 |
15.912,00 |
6.901,00 |
|
|
1. Equity instruments: 11510 |
0,00 |
0,00 |
0,00 |
0,00 |
0,00 |
|
|
2. Credits to third parties : 11520 |
0,00 |
0,00 |
0,00 |
0,00 |
0,00 |
|
|
3. Debt securities: 11530 |
0,00 |
0,00 |
0,00 |
0,00 |
0,00 |
|
|
4. Derivatives : 11540 |
0,00 |
0,00 |
0,00 |
0,00 |
0,00 |
|
|
5. Other financial assets : 11550 |
18.746,00 |
17.213,00 |
17.213,00 |
15.912,00 |
6.901,00 |
|
|
6. Other investments: 11560 |
0,00 |
0,00 |
0,00 |
0,00 |
0,00 |
|
|
VI. Assets for deferred tax : 11600 |
47.581,00 |
9.000,00 |
0,00 |
0,00 |
0,00 |
|
|
VII. Non-current trade debts : 11700 |
0,00 |
0,00 |
0,00 |
0,00 |
0,00 |
|
|
B)
CURRENT ASSETS: 12000 |
9.112.812,00 |
8.877.205,00 |
8.118.716,00 |
7.709.772,00 |
6.210.467,00 |
|
|
I. Non-current assets held for sale : 12100 |
0,00 |
0,00 |
0,00 |
0,00 |
0,00 |
|
|
II. Stocks: 12200 |
4.568.476,00 |
3.565.826,00 |
3.690.515,00 |
2.963.440,00 |
2.363.774,00 |
|
|
1. Commercial: 12210 |
735.606,00 |
695.900,00 |
691.953,00 |
664.855,00 |
515.784,00 |
|
|
2. Primary material and other supplies:
12220 |
2.542.309,00 |
1.645.960,00 |
1.616.751,00 |
1.203.645,00 |
604.957,00 |
|
|
3. Work in progress: 12230 |
476.331,00 |
506.239,00 |
429.287,00 |
441.342,00 |
566.240,00 |
|
|
a) Of long-term
production cycle : 12231 |
0,00 |
0,00 |
0,00 |
0,00 |
0,00 |
|
|
b) Of short-term production
cycle : 12232 |
476.331,00 |
506.239,00 |
429.287,00 |
441.342,00 |
566.240,00 |
|
|
4. Finished goods: 12240 |
814.230,00 |
717.727,00 |
952.523,00 |
653.598,00 |
676.793,00 |
|
|
a) Of long-term production
cycle : 12241 |
0,00 |
0,00 |
0,00 |
0,00 |
0,00 |
|
|
b) Of short-term
production cycle : 12242 |
814.230,00 |
717.727,00 |
952.523,00 |
653.598,00 |
676.793,00 |
|
|
5. By-products, residues and recycled
materials: 12250 |
0,00 |
0,00 |
0,00 |
0,00 |
0,00 |
|
|
6. Advances to suppliers: 12260 |
0,00 |
0,00 |
0,00 |
0,00 |
0,00 |
|
|
III. Trade debtors and others receivable accounts: 12300 |
3.974.979,00 |
4.603.031,00 |
3.831.556,00 |
4.148.239,00 |
3.448.462,00 |
|
|
1. Trade debtors / accounts receivable:
12310 |
2.215.826,00 |
2.132.480,00 |
1.909.108,00 |
1.962.863,00 |
1.991.919,00 |
|
|
a) Long-term
receivables from sales and services supplied : 12311 |
0,00 |
0,00 |
0,00 |
0,00 |
0,00 |
|
|
b) Customers for
sales and provisions of services : 12312 |
2.215.826,00 |
2.132.480,00 |
1.909.108,00 |
1.962.863,00 |
1.991.919,00 |
|
|
2. Customers, Group companies and
associates : 12320 |
1.331.323,00 |
1.477.813,00 |
1.098.082,00 |
1.752.258,00 |
1.228.374,00 |
|
|
3. Other accounts receivable: 12330 |
1.500,00 |
342,00 |
793,00 |
1.423,00 |
288,00 |
|
|
4. Personnel: 12340 |
13.500,00 |
10.580,00 |
4.300,00 |
7.100,00 |
1.000,00 |
|
|
5. Assets for deferred tax: 12350 |
28,00 |
162,00 |
144,00 |
10,00 |
351,00 |
|
|
6. Other debtors, including tax and social
security: 12360 |
412.802,00 |
981.653,00 |
819.129,00 |
424.586,00 |
226.530,00 |
|
|
7. Called up share capital: 12370 |
0,00 |
0,00 |
0,00 |
0,00 |
0,00 |
|
|
IV. Short-term investments in Group companies and associates:
12400 |
140.115,00 |
140.115,00 |
140.115,00 |
0,00 |
0,00 |
|
|
1. Equity instruments: 12410 |
0,00 |
0,00 |
0,00 |
0,00 |
0,00 |
|
|
2. Credits to businesses: 12420 |
140.115,00 |
140.115,00 |
140.115,00 |
0,00 |
0,00 |
|
|
3. Debt securities: 12430 |
0,00 |
0,00 |
0,00 |
0,00 |
0,00 |
|
|
4. Derivatives : 12440 |
0,00 |
0,00 |
0,00 |
0,00 |
0,00 |
|
|
5. Other financial assets : 12450 |
0,00 |
0,00 |
0,00 |
0,00 |
0,00 |
|
|
6. Other investments: 12460 |
0,00 |
0,00 |
0,00 |
0,00 |
0,00 |
|
|
V. Short-term financial investments : 12500 |
0,00 |
0,00 |
60.000,00 |
30.000,00 |
63.250,00 |
|
|
1. Equity instruments: 12510 |
0,00 |
0,00 |
0,00 |
0,00 |
0,00 |
|
|
2. Credits to businesses: 12520 |
0,00 |
0,00 |
0,00 |
0,00 |
0,00 |
|
|
3. Debt securities: 12530 |
0,00 |
0,00 |
0,00 |
0,00 |
0,00 |
|
|
4. Derivatives : 12540 |
0,00 |
0,00 |
0,00 |
0,00 |
0,00 |
|
|
5. Other financial assets : 12550 |
0,00 |
0,00 |
60.000,00 |
30.000,00 |
63.250,00 |
|
|
6. Other investments: 12560 |
0,00 |
0,00 |
0,00 |
0,00 |
0,00 |
|
|
VI. Short-term accruals: 12600 |
0,00 |
0,00 |
0,00 |
0,00 |
0,00 |
|
|
VII. Cash and other equivalent liquid assets : 12700 |
429.241,00 |
568.233,00 |
396.530,00 |
568.093,00 |
334.981,00 |
|
|
1. Treasury: 12710 |
429.241,00 |
568.233,00 |
396.530,00 |
568.093,00 |
334.981,00 |
|
|
2. Other equivalent liquid assets:
12720 |
0,00 |
0,00 |
0,00 |
0,00 |
0,00 |
|
|
TOTAL
ASSETS (A + B) : 10000 |
12.760.399,00 |
12.847.752,00 |
12.371.126,00 |
11.835.072,00 |
10.752.561,00 |
|
|
|
ORIGINAL |
ORIGINAL |
ORIGINAL |
ORIGINAL |
ORIGINAL |
|
|
Liabilities
and Net Worth |
2013 |
2012 |
2011 |
2010 |
2009 |
|
|
A)
NET WORTH: 20000 |
4.060.785,00 |
3.320.166,00 |
2.677.311,00 |
2.079.406,00 |
1.659.623,00 |
|
|
A-1) Shareholders' equity: 21000 |
4.060.785,00 |
3.320.166,00 |
2.677.311,00 |
2.079.406,00 |
1.659.623,00 |
|
|
I. Capital: 21100 |
276.466,00 |
276.466,00 |
276.466,00 |
276.466,00 |
276.466,00 |
|
|
1. Registered capital : 21110 |
276.466,00 |
276.466,00 |
276.466,00 |
276.466,00 |
276.466,00 |
|
|
2. (Uncalled capital): 21120 |
0,00 |
0,00 |
0,00 |
0,00 |
0,00 |
|
|
II. Share premium: 21200 |
535.707,00 |
535.707,00 |
535.707,00 |
535.707,00 |
535.707,00 |
|
|
III. Reserves: 21300 |
4.847.842,00 |
4.847.842,00 |
4.847.842,00 |
4.847.842,00 |
4.847.842,00 |
|
|
1. Legal y estatutarias: 21310 |
55.293,00 |
55.293,00 |
55.293,00 |
55.293,00 |
55.293,00 |
|
|
2. Other reserves: 21320 |
4.792.549,00 |
4.792.549,00 |
4.792.549,00 |
4.792.549,00 |
4.792.549,00 |
|
|
3. Revaluation reserves: 21330 |
0,00 |
0,00 |
0,00 |
0,00 |
0,00 |
|
|
IV. (Common stock equity): 21400 |
0,00 |
0,00 |
0,00 |
0,00 |
0,00 |
|
|
V. Results from previous periods: 21500 |
-2.339.849,00 |
-2.960.375,00 |
-3.580.609,00 |
-4.000.391,00 |
-3.872.943,00 |
|
|
1. Brought forward: 21510 |
0,00 |
0,00 |
0,00 |
0,00 |
0,00 |
|
|
2. (Negative results from previous
periods): 21520 |
-2.339.849,00 |
-2.960.375,00 |
-3.580.609,00 |
-4.000.391,00 |
-3.872.943,00 |
|
|
VI. Other shareholders' contributions: 21600 |
0,00 |
0,00 |
0,00 |
0,00 |
0,00 |
|
|
VII. Result of the period: 21700 |
740.619,00 |
620.527,00 |
597.905,00 |
419.783,00 |
-127.448,00 |
|
|
VIII. (Interim dividend): 21800 |
0,00 |
0,00 |
0,00 |
0,00 |
0,00 |
|
|
IX. Other net worth instruments: 21900 |
0,00 |
0,00 |
0,00 |
0,00 |
0,00 |
|
|
A-2) Adjustments due to changes in value: 22000 |
0,00 |
0,00 |
0,00 |
0,00 |
0,00 |
|
|
I. Financial assets held for sale: 22100 |
0,00 |
0,00 |
0,00 |
0,00 |
0,00 |
|
|
II. Hedge operations: 22200 |
0,00 |
0,00 |
0,00 |
0,00 |
0,00 |
|
|
III. Linked non-current assets and liabilities held for sale :
22300 |
0,00 |
0,00 |
0,00 |
0,00 |
0,00 |
|
|
IV. Exchange rate difference: 22400 |
0,00 |
0,00 |
0,00 |
0,00 |
0,00 |
|
|
V. Other: 22500 |
0,00 |
0,00 |
0,00 |
0,00 |
0,00 |
|
|
A-3) Received subsidies, donations and legacies: 23000 |
0,00 |
0,00 |
0,00 |
0,00 |
0,00 |
|
|
B)
NON-CURRENT LIABILITIES: 31000 |
914.337,00 |
1.727.649,00 |
2.443.814,00 |
3.197.392,00 |
3.946.085,00 |
|
|
I. Long-term provisions: 31100 |
0,00 |
0,00 |
0,00 |
0,00 |
0,00 |
|
|
1. Long-term employee benefits liability:
31110 |
0,00 |
0,00 |
0,00 |
0,00 |
0,00 |
|
|
2. Environmental actions: 31120 |
0,00 |
0,00 |
0,00 |
0,00 |
0,00 |
|
|
3. Restructuring provisions: 31130 |
0,00 |
0,00 |
0,00 |
0,00 |
0,00 |
|
|
4. Other provisions: 31140 |
0,00 |
0,00 |
0,00 |
0,00 |
0,00 |
|
|
II Long-term creditors: 31200 |
914.337,00 |
1.727.649,00 |
2.421.486,00 |
3.162.420,00 |
3.909.744,00 |
|
|
1. Liabilities and other securities:
31210 |
0,00 |
0,00 |
0,00 |
0,00 |
0,00 |
|
|
2. Amounts owed to credit institutions:
31220 |
914.337,00 |
1.727.649,00 |
2.421.486,00 |
3.162.420,00 |
3.909.744,00 |
|
|
3. Creditors from financial leasing:
31230 |
0,00 |
0,00 |
0,00 |
0,00 |
0,00 |
|
|
4. Derivatives : 31240 |
0,00 |
0,00 |
0,00 |
0,00 |
0,00 |
|
|
5. Other financial liabilities :
31250 |
0,00 |
0,00 |
0,00 |
0,00 |
0,00 |
|
|
III. Long-term debts with Group companies and associates:
31300 |
0,00 |
0,00 |
0,00 |
0,00 |
0,00 |
|
|
IV. Liabilities for deferred tax: 31400 |
0,00 |
0,00 |
22.328,00 |
34.972,00 |
36.341,00 |
|
|
V. Long-term accruals: 31500 |
0,00 |
0,00 |
0,00 |
0,00 |
0,00 |
|
|
VI. Non-current trade creditors : 31600 |
0,00 |
0,00 |
0,00 |
0,00 |
0,00 |
|
|
VII. Special long-term debts : 31700 |
0,00 |
0,00 |
0,00 |
0,00 |
0,00 |
|
|
C)
CURRENT LIABILITIES : 32000 |
7.785.277,00 |
7.799.938,00 |
7.250.001,00 |
6.558.274,00 |
5.146.853,00 |
|
|
I. Liabilities linked to non-current assets held for sale:
32100 |
0,00 |
0,00 |
0,00 |
0,00 |
0,00 |
|
|
II. Short-term provisions: 32200 |
0,00 |
0,00 |
19.130,00 |
0,00 |
0,00 |
|
|
1. Provisions from greenhouse gas emission
allowance: 32210 |
0,00 |
0,00 |
0,00 |
0,00 |
0,00 |
|
|
2. Other provisions: 32220 |
0,00 |
0,00 |
0,00 |
0,00 |
0,00 |
|
|
III. Short-term creditors : 32300 |
3.484.363,00 |
2.697.783,00 |
2.494.869,00 |
2.324.270,00 |
2.125.355,00 |
|
|
1. Liabilities and other securities:
32310 |
0,00 |
0,00 |
0,00 |
0,00 |
0,00 |
|
|
2. Amounts owed to credit institutions:
32320 |
3.363.000,00 |
2.564.862,00 |
2.494.121,00 |
2.311.895,00 |
2.100.134,00 |
|
|
3. Creditors from financial leasing:
32330 |
0,00 |
0,00 |
0,00 |
0,00 |
0,00 |
|
|
4. Derivatives : 32340 |
0,00 |
0,00 |
0,00 |
0,00 |
0,00 |
|
|
5. Other financial liabilities :
32350 |
121.363,00 |
132.921,00 |
749,00 |
12.374,00 |
25.221,00 |
|
|
IV. Short-term debts with Group companies and associates:
32400 |
0,00 |
0,00 |
0,00 |
0,00 |
0,00 |
|
|
V. Trade creditors and other accounts payable: 32500 |
4.300.914,00 |
5.102.155,00 |
4.736.002,00 |
4.234.005,00 |
3.021.497,00 |
|
|
1. Suppliers: 32510 |
2.904.685,00 |
3.548.892,00 |
2.868.858,00 |
2.550.313,00 |
2.147.473,00 |
|
|
a) Long-term debts :
32511 |
0,00 |
0,00 |
0,00 |
0,00 |
0,00 |
|
|
b) Short-term debts :
32512 |
2.904.685,00 |
3.548.892,00 |
2.868.858,00 |
2.550.313,00 |
2.147.473,00 |
|
|
2. Suppliers, Group companies and
associates: 32520 |
21.288,00 |
14.291,00 |
0,00 |
1.375,00 |
33.330,00 |
|
|
3. Other creditors: 32530 |
849.430,00 |
1.002.967,00 |
1.361.404,00 |
1.212.799,00 |
425.646,00 |
|
|
4. Personnel (remuneration due):
32540 |
392.964,00 |
406.963,00 |
376.902,00 |
361.043,00 |
313.904,00 |
|
|
5. Liabilities for current tax:
32550 |
0,00 |
0,00 |
0,00 |
0,00 |
0,00 |
|
|
6. Other accounts payable to Public
Administrations.: 32560 |
131.833,00 |
128.963,00 |
128.837,00 |
106.823,00 |
100.796,00 |
|
|
7. Advances from clients: 32570 |
715,00 |
78,00 |
0,00 |
1.651,00 |
347,00 |
|
|
VI. Short-term accruals: 32600 |
0,00 |
0,00 |
0,00 |
0,00 |
0,00 |
|
|
VII. Special short-term debts : 32700 |
0,00 |
0,00 |
0,00 |
0,00 |
0,00 |
|
|
TOTAL
NET WORTH AND LIABILITIES (A + B + C) : 30000 |
12.760.399,00 |
12.847.752,00 |
12.371.126,00 |
11.835.072,00 |
10.752.561,00 |
|
|
|
ORIGINAL |
ORIGINAL |
ORIGINAL |
ORIGINAL |
ORIGINAL |
|
|
Profit
and Loss |
2013 |
2012 |
2011 |
2010 |
2009 |
|
|
1.
Net turnover: 40100 |
18.208.940,00 |
17.674.443,00 |
15.961.567,00 |
15.418.090,00 |
13.553.422,00 |
|
|
a) Sales: 40110 |
18.156.166,00 |
17.615.092,00 |
15.887.328,00 |
15.368.411,00 |
13.553.422,00 |
|
|
b) Rendering of services: 40120 |
52.775,00 |
59.351,00 |
74.239,00 |
49.679,00 |
0,00 |
|
|
c) Income of financial nature of holding companies: 40130 |
0,00 |
0,00 |
0,00 |
0,00 |
0,00 |
|
|
2.
Changes in stocks of finished goods and work in progress: 40200 |
66.595,00 |
-157.844,00 |
286.870,00 |
-148.093,00 |
-31.831,00 |
|
|
3.
Works carried out by the company for its assets: 40300 |
0,00 |
0,00 |
0,00 |
0,00 |
0,00 |
|
|
4.
Supplies : 40400 |
-10.376.228,00 |
-9.875.075,00 |
-8.947.899,00 |
-8.226.513,00 |
-7.422.750,00 |
|
|
a) Stock consumption: 40410 |
-5.453.750,00 |
-2.946.451,00 |
-2.615.665,00 |
-3.012.839,00 |
-2.663.695,00 |
|
|
b) Consumption of raw materials and miscellaneous consumable
ones: 40420 |
-4.919.736,00 |
-6.954.286,00 |
-6.313.779,00 |
-5.198.039,00 |
-4.557.966,00 |
|
|
c) Works carried out by other companies: 40430 |
-1.062,00 |
-1.140,00 |
-1.069,00 |
-1.986,00 |
-617,00 |
|
|
d) Impairment of stock, primary material and other supplies:
40440 |
-1.681,00 |
26.802,00 |
-17.386,00 |
-13.649,00 |
-200.471,00 |
|
|
5.
Other operating income: 40500 |
178.389,00 |
20.337,00 |
18.299,00 |
0,00 |
0,00 |
|
|
a) Auxiliary income and other from current management:
40510 |
178.389,00 |
20.337,00 |
18.299,00 |
0,00 |
0,00 |
|
|
b) Operation subsidies included in the Period's
result: 40520 |
0,00 |
0,00 |
0,00 |
0,00 |
0,00 |
|
|
6.
Personnel costs: 40600 |
-3.305.430,00 |
-3.118.676,00 |
-3.026.964,00 |
-2.895.368,00 |
-2.786.873,00 |
|
|
a) Wages, salaries et al.: 40610 |
-2.520.862,00 |
-2.423.107,00 |
-2.362.936,00 |
-2.245.184,00 |
-2.125.784,00 |
|
|
b) Social security costs: 40620 |
-784.568,00 |
-695.570,00 |
-664.028,00 |
-650.184,00 |
-661.089,00 |
|
|
c) Provisions : 40630 |
0,00 |
0,00 |
0,00 |
0,00 |
0,00 |
|
|
7.
Other operating costs: 40700 |
-3.411.095,00 |
-3.241.851,00 |
-3.100.807,00 |
-2.916.673,00 |
-2.281.677,00 |
|
|
a) External services: 40710 |
-3.269.609,00 |
-3.042.870,00 |
-2.889.869,00 |
-2.331.294,00 |
-2.107.959,00 |
|
|
b) Taxes: 40720 |
-141.451,00 |
-137.177,00 |
-151.621,00 |
-175.804,00 |
-137.640,00 |
|
|
c) Losses, impairments and variation in provisions from trade
operations : 40730 |
-35,00 |
-61.803,00 |
-59.317,00 |
-409.575,00 |
-36.079,00 |
|
|
d) Other current management expenditure : 40740 |
0,00 |
0,00 |
0,00 |
0,00 |
0,00 |
|
|
e) Expenses due to greenhouse gas emissions: 40750 |
0,00 |
0,00 |
0,00 |
0,00 |
0,00 |
|
|
8.
Amortisation of fixed assets: 40800 |
-329.615,00 |
-300.289,00 |
-372.872,00 |
-446.337,00 |
-686.389,00 |
|
|
9.
Allocation of subsidies of non-financial fixed assets and other: 40900 |
0,00 |
0,00 |
0,00 |
0,00 |
0,00 |
|
|
10.
Excess provisions : 41000 |
0,00 |
0,00 |
0,00 |
0,00 |
0,00 |
|
|
11.
Impairment and result of transfers of fixed assets: 41100 |
0,00 |
-19.871,00 |
-2.086,00 |
0,00 |
0,00 |
|
|
a) Impairment and losses : 41110 |
0,00 |
0,00 |
0,00 |
0,00 |
0,00 |
|
|
b) Results for transfers and other : 41120 |
0,00 |
-19.871,00 |
-2.086,00 |
0,00 |
0,00 |
|
|
c) Impairment and profit due to disposals of assets of holding
companies: 41130 |
0,00 |
0,00 |
0,00 |
0,00 |
0,00 |
|
|
12.
Negative difference in combined businesses: 41200 |
0,00 |
0,00 |
0,00 |
0,00 |
0,00 |
|
|
13.
Other results : 41300 |
312,00 |
19.046,00 |
-3.047,00 |
2.880,00 |
-4.388,00 |
|
|
A.1)
OPERATING INCOME (1 + 2 + 3 + 4 + 5 + 6 + 7 + 8 + 9 + 10 + 11 + 12 + 13) :
49100 |
1.031.868,00 |
1.000.219,00 |
813.061,00 |
787.987,00 |
339.514,00 |
|
|
14.
Financial income : 41400 |
18.454,00 |
27.418,00 |
149.485,00 |
51,00 |
1.950,00 |
|
|
a) Of shares in equity instruments : 41410 |
0,00 |
0,00 |
148.810,00 |
0,00 |
0,00 |
|
|
a 1) In Group companies and associates:
41411 |
0,00 |
0,00 |
148.810,00 |
0,00 |
0,00 |
|
|
a 2) In third parties: 41412 |
0,00 |
0,00 |
0,00 |
0,00 |
0,00 |
|
|
b) From negotiable securities and other financial instruments :
41420 |
18.454,00 |
27.418,00 |
675,00 |
51,00 |
1.950,00 |
|
|
b 1) From Group companies and associates :
41421 |
17.931,00 |
22.432,00 |
0,00 |
0,00 |
0,00 |
|
|
b 2) From third parties : 41422 |
523,00 |
4.986,00 |
675,00 |
51,00 |
1.950,00 |
|
|
c) Allocation of financial subsidies, donations and legacies :
41430 |
0,00 |
0,00 |
0,00 |
0,00 |
0,00 |
|
|
15.
Financial expenditure: 41500 |
-248.149,00 |
-362.252,00 |
-396.527,00 |
-376.063,00 |
-382.597,00 |
|
|
a) Amounts owed to Group companies and associates : 41510 |
0,00 |
-12.601,00 |
-16.954,00 |
-20.000,00 |
0,00 |
|
|
b) For debts with third parties : 41520 |
-248.149,00 |
-349.651,00 |
-379.573,00 |
-356.063,00 |
-382.597,00 |
|
|
c) Stock renewal : 41530 |
0,00 |
0,00 |
0,00 |
0,00 |
0,00 |
|
|
16.
Changes in fair value of financial instruments : 41600 |
0,00 |
0,00 |
0,00 |
0,00 |
0,00 |
|
|
a) Trading book and other : 41610 |
0,00 |
0,00 |
0,00 |
0,00 |
0,00 |
|
|
b) Allocation of financial assets held for sale to the result
for the period: 41620 |
0,00 |
0,00 |
0,00 |
0,00 |
0,00 |
|
|
17.
Exchange rate differences : 41700 |
-100.135,00 |
-53.859,00 |
19.243,00 |
6.439,00 |
-87.685,00 |
|
|
18.
Impairment and result for transfers of financial instruments: 41800 |
0,00 |
0,00 |
0,00 |
0,00 |
0,00 |
|
|
a) Impairment and losses : 41810 |
0,00 |
0,00 |
0,00 |
0,00 |
0,00 |
|
|
b) Results for transfers and other : 41820 |
0,00 |
0,00 |
0,00 |
0,00 |
0,00 |
|
|
19.
Other financial income and expenditure: 42100 |
0,00 |
0,00 |
0,00 |
0,00 |
0,00 |
|
|
a) Incorporation of financial expenditure to assets:
42110 |
0,00 |
0,00 |
0,00 |
0,00 |
0,00 |
|
|
b) Financial income from arrangement with creditors:
42120 |
0,00 |
0,00 |
0,00 |
0,00 |
0,00 |
|
|
c) Other income and expenditure: 42130 |
0,00 |
0,00 |
0,00 |
0,00 |
0,00 |
|
|
A.2)
FINANCIAL REVENUE (14+15+16+17+18+19) : 49200 |
-329.830,00 |
-388.693,00 |
-227.799,00 |
-369.573,00 |
-468.332,00 |
|
|
A.3)
NET RESULT BEFORE TAXES (A.1+A.2) : 49300 |
702.038,00 |
611.527,00 |
585.262,00 |
418.414,00 |
-128.817,00 |
|
|
20.
Income taxes: 41900 |
38.581,00 |
9.000,00 |
12.644,00 |
1.369,00 |
1.369,00 |
|
|
A.4)
PROFIT AFTER TAXES (A.3+20) : 49400 |
740.619,00 |
620.527,00 |
597.905,00 |
419.783,00 |
-127.448,00 |
|
|
21.
Result of the year coming from interrupted operations : 42000 |
0,00 |
0,00 |
0,00 |
0,00 |
0,00 |
|
|
A.5)
RESULT OF THE PERIOD (A.4+21) : 49500 |
740.619,00 |
620.527,00 |
597.905,00 |
419.783,00 |
-127.448,00 |
|
>
Normal Balance Sheet under the rules of the 1990 General Accounting Plan (repealed
since 1st January of 2008)
Information corresponding to the fiscal year 2013 2012 2011 2010 2009 has been compiled based on the equivalence criteria stipulated in Act JUS/206/2009. Where the provisions of the Act did not establish relevant equivalence criteria
|
|
EQUIVALENCIA |
EQUIVALENCIA |
EQUIVALENCIA |
EQUIVALENCIA |
EQUIVALENCIA |
|
|
ASSETS |
2013 |
2012 |
2011 |
2010 |
2009 |
|
|
A)
SHAREHOLDERS (PARTNERS) BY UNCALLED SUSCRIBED CAPITAL: |
0,00 |
0,00 |
0,00 |
0,00 |
0,00 |
|
|
B)
FIXED ASSETS: |
3.600.006,00 |
3.961.547,00 |
4.252.410,00 |
4.125.301,00 |
4.542.094,00 |
|
|
I. Formation expenses: |
0,00 |
0,00 |
0,00 |
0,00 |
0,00 |
|
|
II. Intangible fixed assets: |
37.364,00 |
32.333,00 |
3.510,00 |
11.348,00 |
24.954,00 |
|
|
1. Research and development costs: |
0,00 |
0,00 |
0,00 |
0,00 |
0,00 |
|
|
2. Concessions, patents, licences,
trademarks et al.: |
14,00 |
957,00 |
2.684,00 |
5.457,00 |
8.918,00 |
|
|
3. Goodwill: |
0,00 |
0,00 |
0,00 |
0,00 |
0,00 |
|
|
4. Key money paid for premises: |
0,00 |
0,00 |
0,00 |
0,00 |
0,00 |
|
|
5. Software: |
37.350,00 |
31.376,00 |
826,00 |
5.891,00 |
16.037,00 |
|
|
6. Assets under capital leases: |
0,00 |
0,00 |
0,00 |
0,00 |
0,00 |
|
|
7. Payments on account: |
0,00 |
0,00 |
0,00 |
0,00 |
0,00 |
|
|
8. Provisions: |
0,00 |
0,00 |
0,00 |
0,00 |
0,00 |
|
|
9. Accumulated depreciation: |
0,00 |
0,00 |
0,00 |
0,00 |
0,00 |
|
|
III. Tangible fixed assets: |
2.962.721,00 |
3.190.710,00 |
3.370.281,00 |
3.656.981,00 |
4.069.179,00 |
|
|
1. Land and construction: |
1.763.272,00 |
1.818.892,00 |
1.860.201,00 |
1.947.536,00 |
2.015.298,00 |
|
|
2. Technical installations and machinery:
|
1.128.663,00 |
1.301.430,00 |
1.274.484,00 |
1.453.982,00 |
1.782.602,00 |
|
|
3. Other installations, tools and
furniture: |
33.963,00 |
39.162,00 |
38.351,00 |
43.752,00 |
53.641,00 |
|
|
4. Payments on account and tangible fixed
assets under construction: |
16.463,00 |
7.750,00 |
174.255,00 |
185.482,00 |
185.482,00 |
|
|
5. Other tangible assets: |
20.360,00 |
23.476,00 |
22.990,00 |
26.228,00 |
32.156,00 |
|
|
6. Provisions: |
0,00 |
0,00 |
0,00 |
0,00 |
0,00 |
|
|
7. Accumulated depreciation: |
0,00 |
0,00 |
0,00 |
0,00 |
0,00 |
|
|
IV. Financial investments: |
599.921,00 |
738.504,00 |
878.619,00 |
456.972,00 |
447.960,00 |
|
|
1. Equity investments in group companies:
|
441.059,00 |
441.059,00 |
441.059,00 |
441.059,00 |
441.059,00 |
|
|
2. Receivables from group companies:
|
140.116,00 |
280.231,00 |
420.347,00 |
0,00 |
0,00 |
|
|
3. Equity investment in associated
companies: |
0,00 |
0,00 |
0,00 |
0,00 |
0,00 |
|
|
4. Credits to associated companies: |
0,00 |
0,00 |
0,00 |
0,00 |
0,00 |
|
|
5. Long-term securities portfolio: |
0,00 |
0,00 |
0,00 |
0,00 |
0,00 |
|
|
6. Other receivables: |
0,00 |
0,00 |
0,00 |
0,00 |
0,00 |
|
|
7. Long term guarantees and deposits:
|
18.746,00 |
17.213,00 |
17.213,00 |
15.912,00 |
6.901,00 |
|
|
8. Provisions: |
0,00 |
0,00 |
0,00 |
0,00 |
0,00 |
|
|
9. Long-term receivables from public
bodies: |
0,00 |
0,00 |
0,00 |
0,00 |
0,00 |
|
|
V. Own shares: |
0,00 |
0,00 |
0,00 |
0,00 |
0,00 |
|
|
VI. Long-term trade receivables: |
0,00 |
0,00 |
0,00 |
0,00 |
0,00 |
|
|
C)
Deferred expenses: |
0,00 |
0,00 |
0,00 |
0,00 |
0,00 |
|
|
D)
CURRENT ASSETS: |
9.160.393,00 |
8.886.205,00 |
8.118.716,00 |
7.709.772,00 |
6.210.467,00 |
|
|
I. Called-up share capital (not paid): |
0,00 |
0,00 |
0,00 |
0,00 |
0,00 |
|
|
II. Stocks: |
4.568.476,00 |
3.565.826,00 |
3.690.515,00 |
2.963.440,00 |
2.363.774,00 |
|
|
1. Goods for resale: |
735.606,00 |
695.900,00 |
691.953,00 |
664.855,00 |
515.784,00 |
|
|
2. Raw materials and other consumables:
|
2.542.309,00 |
1.645.960,00 |
1.616.751,00 |
1.203.645,00 |
604.957,00 |
|
|
3. Goods in process and semifinished ones:
|
476.331,00 |
506.239,00 |
429.287,00 |
441.342,00 |
566.240,00 |
|
|
4. Finished products: |
814.230,00 |
717.727,00 |
952.523,00 |
653.598,00 |
676.793,00 |
|
|
5. Byproducts, scrap and recovered
materials: |
0,00 |
0,00 |
0,00 |
0,00 |
0,00 |
|
|
6. Payments on account: |
0,00 |
0,00 |
0,00 |
0,00 |
0,00 |
|
|
7. Provisions: |
0,00 |
0,00 |
0,00 |
0,00 |
0,00 |
|
|
III. Debtors: |
4.022.560,00 |
4.612.031,00 |
3.831.556,00 |
4.148.239,00 |
3.448.462,00 |
|
|
1. Trade debtors / accounts receivable:
|
2.215.826,00 |
2.132.480,00 |
1.909.108,00 |
1.962.863,00 |
1.991.919,00 |
|
|
2. Accounts receivable, Group companies:
|
1.331.323,00 |
1.477.813,00 |
1.098.082,00 |
1.752.258,00 |
1.228.374,00 |
|
|
3. Accounts receivable, associated
companies: |
0,00 |
0,00 |
0,00 |
0,00 |
0,00 |
|
|
4. Other debtors: |
1.500,00 |
342,00 |
793,00 |
1.423,00 |
288,00 |
|
|
5. Staff: |
13.500,00 |
10.580,00 |
4.300,00 |
7.100,00 |
1.000,00 |
|
|
6. Public bodies: |
460.411,00 |
990.815,00 |
819.273,00 |
424.596,00 |
226.881,00 |
|
|
7. Provisions: |
0,00 |
0,00 |
0,00 |
0,00 |
0,00 |
|
|
IV. Short-term investments: |
140.115,00 |
140.115,00 |
200.115,00 |
30.000,00 |
63.250,00 |
|
|
1. Equity investments in group companies:
|
0,00 |
0,00 |
0,00 |
0,00 |
0,00 |
|
|
2. Receivables from group companies:
|
140.115,00 |
140.115,00 |
140.115,00 |
0,00 |
0,00 |
|
|
3. Equity investment in associated companies:
|
0,00 |
0,00 |
0,00 |
0,00 |
0,00 |
|
|
4. Credits to associated companies: |
0,00 |
0,00 |
0,00 |
0,00 |
0,00 |
|
|
5. Short term securities portfolio: |
0,00 |
0,00 |
0,00 |
0,00 |
0,00 |
|
|
6. Other receivables: |
0,00 |
0,00 |
0,00 |
0,00 |
0,00 |
|
|
7. Shor term guarantees and deposits:
|
0,00 |
0,00 |
60.000,00 |
30.000,00 |
63.250,00 |
|
|
8. Provisions: |
0,00 |
0,00 |
0,00 |
0,00 |
0,00 |
|
|
V. Short-term treasury shares: |
0,00 |
0,00 |
0,00 |
0,00 |
0,00 |
|
|
VI. Cash at bank and in hand: |
429.241,00 |
568.233,00 |
396.530,00 |
568.093,00 |
334.981,00 |
|
|
VII. Prepayments and accrued income: |
0,00 |
0,00 |
0,00 |
0,00 |
0,00 |
|
|
GENERAL
TOTAL (A + B + C + D): |
12.760.399,00 |
12.847.752,00 |
12.371.126,00 |
11.835.072,00 |
10.752.561,00 |
|
MERCANTILE
REGISTRY.
|
|
EQUIVALENCIA |
EQUIVALENCIA |
EQUIVALENCIA |
EQUIVALENCIA |
EQUIVALENCIA |
|
|
LIABILITIES |
2013 |
2012 |
2011 |
2010 |
2009 |
|
|
A)
EQUITY: |
4.060.785,00 |
3.320.166,00 |
2.677.311,00 |
2.079.406,00 |
1.659.623,00 |
|
|
I. Subscribed capital: |
276.466,00 |
276.466,00 |
276.466,00 |
276.466,00 |
276.466,00 |
|
|
II. Share premium: |
535.707,00 |
535.707,00 |
535.707,00 |
535.707,00 |
535.707,00 |
|
|
III. Revaluation reserves: |
0,00 |
0,00 |
0,00 |
0,00 |
0,00 |
|
|
IV. Reserves: |
4.847.842,00 |
4.847.842,00 |
4.847.842,00 |
4.847.842,00 |
4.847.842,00 |
|
|
1. Legal reserve: |
55.293,00 |
55.293,00 |
55.293,00 |
55.293,00 |
55.293,00 |
|
|
2. Reserves for own shares: |
0,00 |
0,00 |
0,00 |
0,00 |
0,00 |
|
|
3. Reserves for shares of the controlling
company: |
0,00 |
0,00 |
0,00 |
0,00 |
0,00 |
|
|
4. Statutory reserves: |
0,00 |
0,00 |
0,00 |
0,00 |
0,00 |
|
|
5. Miscellaneous reserves: |
4.792.549,00 |
4.792.549,00 |
4.792.549,00 |
4.792.549,00 |
4.792.549,00 |
|
|
Differences due to capital adjustement to
euros: |
0,00 |
0,00 |
0,00 |
0,00 |
0,00 |
|
|
V. Profit or loss brought forward: |
-2.339.849,00 |
-2.960.375,00 |
-3.580.609,00 |
-4.000.391,00 |
-3.872.943,00 |
|
|
1. Retained earnings: |
0,00 |
0,00 |
0,00 |
0,00 |
0,00 |
|
|
2. Prior year losses: |
-2.339.849,00 |
-2.960.375,00 |
-3.580.609,00 |
-4.000.391,00 |
-3.872.943,00 |
|
|
3. Partners' contributions so as
to compensate losses: |
0,00 |
0,00 |
0,00 |
0,00 |
0,00 |
|
|
VI. Profit or loss for the financial year: |
740.619,00 |
620.527,00 |
597.905,00 |
419.783,00 |
-127.448,00 |
|
|
VII. Interim dividend paid: |
0,00 |
0,00 |
0,00 |
0,00 |
0,00 |
|
|
VIII. Own shares for capital reduction: |
0,00 |
0,00 |
0,00 |
0,00 |
0,00 |
|
|
B)
Deferred income: |
0,00 |
0,00 |
0,00 |
0,00 |
0,00 |
|
|
1. Capital grants: |
0,00 |
0,00 |
0,00 |
0,00 |
0,00 |
|
|
2. Unrealised exchange gains: |
0,00 |
0,00 |
0,00 |
0,00 |
0,00 |
|
|
3. Other deferred income: |
0,00 |
0,00 |
0,00 |
0,00 |
0,00 |
|
|
4. Public revenues to distribute in
several financial years: |
0,00 |
0,00 |
0,00 |
0,00 |
0,00 |
|
|
C)
PROVISIONS FOR LIABILITIES AND CHARGES: |
0,00 |
0,00 |
0,00 |
0,00 |
0,00 |
|
|
1. Provisions for pension fund and other
similar obligations: |
0,00 |
0,00 |
0,00 |
0,00 |
0,00 |
|
|
2. Provisions for taxes: |
0,00 |
0,00 |
0,00 |
0,00 |
0,00 |
|
|
3. Other provisions: |
0,00 |
0,00 |
0,00 |
0,00 |
0,00 |
|
|
4. Reversion fund: |
0,00 |
0,00 |
0,00 |
0,00 |
0,00 |
|
|
D)
LONG TERM LIABILITIES: |
914.337,00 |
1.727.649,00 |
2.443.814,00 |
3.197.392,00 |
3.946.085,00 |
|
|
I. Issued debentures and other marketable securities: |
0,00 |
0,00 |
0,00 |
0,00 |
0,00 |
|
|
1. Non-convertible debentures: |
0,00 |
0,00 |
0,00 |
0,00 |
0,00 |
|
|
2. Convertible debentures: |
0,00 |
0,00 |
0,00 |
0,00 |
0,00 |
|
|
3. Other debt securities: |
0,00 |
0,00 |
0,00 |
0,00 |
0,00 |
|
|
II. Amounts owed to credit institutions: |
914.337,00 |
1.727.649,00 |
2.421.486,00 |
3.162.420,00 |
3.909.744,00 |
|
|
1. Loans and other liabilities: |
914.337,00 |
1.727.649,00 |
2.421.486,00 |
3.162.420,00 |
3.909.744,00 |
|
|
2. Long-term liabilities from capital leases:
|
0,00 |
0,00 |
0,00 |
0,00 |
0,00 |
|
|
III. Debts with companies of the group and affiliated ones:
|
0,00 |
0,00 |
0,00 |
0,00 |
0,00 |
|
|
1. Amounts owed to group companies: |
0,00 |
0,00 |
0,00 |
0,00 |
0,00 |
|
|
2. Amounts owed to associated companies:
|
0,00 |
0,00 |
0,00 |
0,00 |
0,00 |
|
|
IV. Other creditors: |
0,00 |
0,00 |
22.328,00 |
34.972,00 |
36.341,00 |
|
|
1. Long-term bills of exchange payable:
|
0,00 |
0,00 |
0,00 |
0,00 |
0,00 |
|
|
2. Other creditors: |
0,00 |
0,00 |
0,00 |
0,00 |
0,00 |
|
|
3. Long term guarantees and deposits
received: |
0,00 |
0,00 |
0,00 |
0,00 |
0,00 |
|
|
4. Long term payables to public bodies:
|
0,00 |
0,00 |
22.328,00 |
34.972,00 |
36.341,00 |
|
|
V. Unpaid portion of equity investment: |
0,00 |
0,00 |
0,00 |
0,00 |
0,00 |
|
|
1. Group companies: |
0,00 |
0,00 |
0,00 |
0,00 |
0,00 |
|
|
2. Associated companies: |
0,00 |
0,00 |
0,00 |
0,00 |
0,00 |
|
|
3. Third parties: |
0,00 |
0,00 |
0,00 |
0,00 |
0,00 |
|
|
VI. Long term trade creditors: |
0,00 |
0,00 |
0,00 |
0,00 |
0,00 |
|
|
E)
SHORT TERM CREDITORS: |
7.785.277,00 |
7.799.938,00 |
7.230.871,00 |
6.558.274,00 |
5.146.853,00 |
|
|
I. Issued debentures and other marketable securities: |
0,00 |
0,00 |
0,00 |
0,00 |
0,00 |
|
|
1. Non-convertible debentures: |
0,00 |
0,00 |
0,00 |
0,00 |
0,00 |
|
|
2. Convertible debentures: |
0,00 |
0,00 |
0,00 |
0,00 |
0,00 |
|
|
3. Other debt securities: |
0,00 |
0,00 |
0,00 |
0,00 |
0,00 |
|
|
4. Accrued interest on debentures and
other debt securities: |
0,00 |
0,00 |
0,00 |
0,00 |
0,00 |
|
|
II. Amounts owed to credit institutions: |
3.363.000,00 |
2.564.862,00 |
2.494.121,00 |
2.311.895,00 |
2.100.134,00 |
|
|
1. Loans and other liabilities: |
3.363.000,00 |
2.564.862,00 |
2.494.121,00 |
2.311.895,00 |
2.100.134,00 |
|
|
2. Accrued interest on liabilities with
credit institutions: |
0,00 |
0,00 |
0,00 |
0,00 |
0,00 |
|
|
3. Short-term liabilities from capital
leases: |
0,00 |
0,00 |
0,00 |
0,00 |
0,00 |
|
|
III. Short-term amounts owed to group and associated companies:
|
21.288,00 |
14.291,00 |
0,00 |
1.375,00 |
33.330,00 |
|
|
1. Amounts owed to group companies: |
21.288,00 |
14.291,00 |
0,00 |
1.375,00 |
33.330,00 |
|
|
2. Amounts owed to associated companies:
|
0,00 |
0,00 |
0,00 |
0,00 |
0,00 |
|
|
IV. Trade creditors: |
3.754.829,00 |
4.551.938,00 |
4.230.262,00 |
3.764.763,00 |
2.573.466,00 |
|
|
1. Advanced payments from customers:
|
715,00 |
78,00 |
0,00 |
1.651,00 |
347,00 |
|
|
2. Amounts owed for purchases of goods or
services: |
3.754.114,00 |
4.551.859,00 |
4.230.262,00 |
3.763.112,00 |
2.573.119,00 |
|
|
3. Debts represented by notes payable:
|
0,00 |
0,00 |
0,00 |
0,00 |
0,00 |
|
|
V. Other creditors: |
646.160,00 |
668.847,00 |
506.488,00 |
480.241,00 |
439.922,00 |
|
|
1. Public bodies: |
131.833,00 |
128.963,00 |
128.837,00 |
106.823,00 |
100.796,00 |
|
|
2. Bills of exchange payable: |
0,00 |
0,00 |
0,00 |
0,00 |
0,00 |
|
|
3. Miscellaneous debts: |
121.363,00 |
132.921,00 |
749,00 |
12.374,00 |
25.221,00 |
|
|
4. Wages and salaries payable: |
392.964,00 |
406.963,00 |
376.902,00 |
361.043,00 |
313.904,00 |
|
|
5. Guarantees and deposits received at
short term: |
0,00 |
0,00 |
0,00 |
0,00 |
0,00 |
|
|
VI. Provisions: |
0,00 |
0,00 |
0,00 |
0,00 |
0,00 |
|
|
VII. Prepayments and accrued income: |
0,00 |
0,00 |
0,00 |
0,00 |
0,00 |
|
|
F)
SHORT-TERM PROVISIONS FOR LIABILITIES AND CHARGES: |
0,00 |
0,00 |
19.130,00 |
0,00 |
0,00 |
|
|
GENERAL
TOTAL (A + B + C + D + E + F): |
12.760.399,00 |
12.847.752,00 |
12.371.126,00 |
11.835.072,00 |
10.752.561,00 |
|
MERCANTILE
REGISTRY.
|
|
EQUIVALENCIA |
EQUIVALENCIA |
EQUIVALENCIA |
EQUIVALENCIA |
EQUIVALENCIA |
|
|
DEBIT |
2013 |
2012 |
2011 |
2010 |
2009 |
|
|
A)
CHARGES (A.1 to A.15): |
17.732.071,00 |
17.120.717,00 |
15.837.559,00 |
15.007.678,00 |
13.682.821,00 |
|
|
A.1. Stock reduction of both manufactured
goods and the ones in process: |
0,00 |
157.844,00 |
0,00 |
148.093,00 |
31.831,00 |
|
|
A.2. Supplies: |
10.374.547,00 |
9.901.877,00 |
8.930.513,00 |
8.212.864,00 |
7.222.278,00 |
|
|
a) Stock consumption:
|
5.453.750,00 |
2.946.451,00 |
2.615.665,00 |
3.012.839,00 |
2.663.695,00 |
|
|
b) Consumption of raw
materials and miscellaneous consumable ones: |
4.919.736,00 |
6.954.286,00 |
6.313.779,00 |
5.198.039,00 |
4.557.966,00 |
|
|
c) Miscellaneous
external expenditure: |
1.062,00 |
1.140,00 |
1.069,00 |
1.986,00 |
617,00 |
|
|
A.3. Staff costs: |
3.305.430,00 |
3.118.676,00 |
3.026.964,00 |
2.895.368,00 |
2.786.873,00 |
|
|
a) Wages, salaries et
al.: |
2.520.862,00 |
2.423.107,00 |
2.362.936,00 |
2.245.184,00 |
2.125.784,00 |
|
|
b) Social security
costs: |
784.568,00 |
695.570,00 |
664.028,00 |
650.184,00 |
661.089,00 |
|
|
A.4. Depreciation expense: |
329.615,00 |
300.289,00 |
372.872,00 |
446.337,00 |
686.389,00 |
|
|
A.5. Variation of trade provisions and
losses of unrecovered receivables: |
1.715,00 |
35.001,00 |
76.703,00 |
423.224,00 |
236.550,00 |
|
|
a) Stock provision
variation: |
1.681,00 |
-26.802,00 |
17.386,00 |
13.649,00 |
200.471,00 |
|
|
b) Variation in
provision and bad debt losses: |
35,00 |
61.803,00 |
59.317,00 |
409.575,00 |
36.079,00 |
|
|
c) Variation of other
trade provisions: |
0,00 |
0,00 |
0,00 |
0,00 |
0,00 |
|
|
A.6. Other operating charges: |
3.411.060,00 |
3.180.047,00 |
3.041.490,00 |
2.507.098,00 |
2.245.599,00 |
|
|
a) External services:
|
3.269.609,00 |
3.042.870,00 |
2.889.869,00 |
2.331.294,00 |
2.107.959,00 |
|
|
b) Taxes: |
141.451,00 |
137.177,00 |
151.621,00 |
175.804,00 |
137.640,00 |
|
|
c) Other operating
expenses: |
0,00 |
0,00 |
0,00 |
0,00 |
0,00 |
|
|
d) Allocation to
revision fund: |
0,00 |
0,00 |
0,00 |
0,00 |
0,00 |
|
|
A.I. OPERATING BENEFITS
(B.1+B.2+B.3+B.4-A.1-A.2-A.3-A.4-A.5-A.6): |
1.031.556,00 |
1.001.045,00 |
818.194,00 |
785.106,00 |
343.902,00 |
|
|
A.7. Financial and similar charges: |
248.149,00 |
362.252,00 |
396.527,00 |
376.063,00 |
382.597,00 |
|
|
a) Due to liabilities
with companies of the group: |
0,00 |
12.601,00 |
16.954,00 |
20.000,00 |
0,00 |
|
|
b) Due to liabilities
with associated companies: |
0,00 |
0,00 |
0,00 |
0,00 |
0,00 |
|
|
c) Due to other
debts.: |
248.149,00 |
349.651,00 |
379.573,00 |
356.063,00 |
382.597,00 |
|
|
d) Losses from
financial investments: |
0,00 |
0,00 |
0,00 |
0,00 |
0,00 |
|
|
A.8. Changes in financial investment
provisions: |
0,00 |
0,00 |
0,00 |
0,00 |
0,00 |
|
|
A.9. Exchange losses: |
100.135,00 |
53.859,00 |
0,00 |
0,00 |
87.685,00 |
|
|
A.II. NET FINANCIAL INCOME (B.5+B.6+B.7+B.8-A.7-A.8-A.9):
|
0,00 |
0,00 |
0,00 |
0,00 |
0,00 |
|
|
A.III. PROFIT FROM ORDINARY ACTIVITIES (A.I+A.II-B.I-B.II):
|
701.726,00 |
612.352,00 |
590.395,00 |
415.534,00 |
0,00 |
|
|
A.10. Changes in provisions for
intangible, tangible and securities portfolio: |
0,00 |
0,00 |
0,00 |
0,00 |
0,00 |
|
|
A.11. Losses from tangible and intangible
fixed assets and securities portfolio: |
0,00 |
19.871,00 |
2.086,00 |
0,00 |
0,00 |
|
|
A.12. Losses from transactions with own
shares and debentures: |
0,00 |
0,00 |
0,00 |
0,00 |
0,00 |
|
|
A.13. Extraordinary expenses: |
0,00 |
0,00 |
3.047,00 |
0,00 |
4.388,00 |
|
|
A.14. Expenses and losses of former
financial years: |
0,00 |
0,00 |
0,00 |
0,00 |
0,00 |
|
|
A.IV. EXTRAORDINARY PROFIT
(B.9+B.10+B.11+B.12+B.13-A.10-A.11-A.12-A.13-A.14): |
312,00 |
0,00 |
0,00 |
2.880,00 |
0,00 |
|
|
A.V. PROFIT BEFORE TAXES (A.III+A.IV-B.III-B.IV): |
702.038,00 |
611.527,00 |
585.262,00 |
418.414,00 |
0,00 |
|
|
A.15. Corporation tax: |
-38.581,00 |
-9.000,00 |
-12.644,00 |
-1.369,00 |
-1.369,00 |
|
|
A.16. Miscellaneous taxes: |
0,00 |
0,00 |
0,00 |
0,00 |
0,00 |
|
|
A.VI. FINANCIAL YEAR RESULTS (PROFIT) (A.V-A.15-A.16): |
740.619,00 |
620.527,00 |
597.905,00 |
419.783,00 |
0,00 |
|
MERCANTILE
REGISTRY.
|
|
EQUIVALENCIA |
EQUIVALENCIA |
EQUIVALENCIA |
EQUIVALENCIA |
EQUIVALENCIA |
|
|
CREDIT |
2013 |
2012 |
2011 |
2010 |
2009 |
|
|
B)
INCOME ( B.1 to B.13): |
18.472.690,00 |
17.741.244,00 |
16.435.464,00 |
15.427.461,00 |
13.555.373,00 |
|
|
B.1. Net total sales: |
18.208.940,00 |
17.674.443,00 |
15.961.567,00 |
15.418.090,00 |
13.553.422,00 |
|
|
a) Sales: |
18.494.532,00 |
17.943.375,00 |
16.183.412,00 |
15.654.823,00 |
13.806.010,00 |
|
|
b) Rendering of
services: |
52.775,00 |
59.351,00 |
74.239,00 |
49.679,00 |
0,00 |
|
|
Returns and Rappel on
sales: |
-338.367,00 |
-328.283,00 |
-296.083,00 |
-286.413,00 |
-252.588,00 |
|
|
B.2. Stock increase of manufactured goods
and products in process: |
66.595,00 |
0,00 |
286.870,00 |
0,00 |
0,00 |
|
|
B.3. Works performed by the company for
fixed assets: |
0,00 |
0,00 |
0,00 |
0,00 |
0,00 |
|
|
B.4. Miscellaneous operating income:
|
178.389,00 |
20.337,00 |
18.299,00 |
0,00 |
0,00 |
|
|
a) Auxiliary income
and other from current management: |
178.389,00 |
20.337,00 |
18.299,00 |
0,00 |
0,00 |
|
|
b) Grants: |
0,00 |
0,00 |
0,00 |
0,00 |
0,00 |
|
|
c) Liabilities and
charges provisions surplus: |
0,00 |
0,00 |
0,00 |
0,00 |
0,00 |
|
|
B.I. PÉRDIDAS DE EXPLOTACIÓN
(A.1+A.2+A.3+A.4+A.5-A.6-B.1-B.2-B.3-B.4): |
0,00 |
0,00 |
0,00 |
0,00 |
0,00 |
|
|
B.5. Income from equity investment: |
0,00 |
0,00 |
148.810,00 |
0,00 |
0,00 |
|
|
a) In companies of
the group: |
0,00 |
0,00 |
148.810,00 |
0,00 |
0,00 |
|
|
b) In associated
companies: |
0,00 |
0,00 |
0,00 |
0,00 |
0,00 |
|
|
c) Third parties:
|
0,00 |
0,00 |
0,00 |
0,00 |
0,00 |
|
|
B.6. Income from other marketable
securities and long-term receivables: |
0,00 |
0,00 |
0,00 |
0,00 |
0,00 |
|
|
a) From companies of
the group: |
0,00 |
0,00 |
0,00 |
0,00 |
0,00 |
|
|
b) From associated
companies: |
0,00 |
0,00 |
0,00 |
0,00 |
0,00 |
|
|
c) From companies out
of the group: |
0,00 |
0,00 |
0,00 |
0,00 |
0,00 |
|
|
B.7. Miscellaneous interests or similar
income: |
18.454,00 |
27.418,00 |
675,00 |
51,00 |
1.950,00 |
|
|
a) From companies of
the group: |
17.931,00 |
22.432,00 |
0,00 |
0,00 |
0,00 |
|
|
b) From associated
companies: |
0,00 |
0,00 |
0,00 |
0,00 |
0,00 |
|
|
c) Miscellaneous
interests: |
523,00 |
4.986,00 |
675,00 |
51,00 |
1.950,00 |
|
|
d) Profit on financial
investment: |
0,00 |
0,00 |
0,00 |
0,00 |
0,00 |
|
|
B.8. Exchange positive differences: |
0,00 |
0,00 |
19.243,00 |
6.439,00 |
0,00 |
|
|
B.II. NEGATIVE FINANCIAL RESULTS (A.7+A.8+A.9-B.5-B.6-B.7-B.8):
|
329.830,00 |
388.693,00 |
227.799,00 |
369.573,00 |
468.332,00 |
|
|
B.III. LOSSES ON ORDINARY ACTIVITIES ( B.I + B.II - A.I - A.II
): |
0,00 |
0,00 |
0,00 |
0,00 |
124.430,00 |
|
|
B.9.Profit on disposal of both tangible and
intangible fixed assets and securities portfolio: |
0,00 |
0,00 |
0,00 |
0,00 |
0,00 |
|
|
B.10. Profit on transactions with own
shares and debentures: |
0,00 |
0,00 |
0,00 |
0,00 |
0,00 |
|
|
B.11. Capital grants transferred to profit
and loss: |
0,00 |
0,00 |
0,00 |
0,00 |
0,00 |
|
|
B.12. Extraordinary income: |
312,00 |
19.046,00 |
0,00 |
2.880,00 |
0,00 |
|
|
B.13. Income and profit of former financial
years: |
0,00 |
0,00 |
0,00 |
0,00 |
0,00 |
|
|
B.IV. NEGATIVE EXTRAORDINARY RESULTS
(A.10+A.11+A.12+A.13+A.14-B.9-B.10-B.11-B.12-B.13): |
0,00 |
826,00 |
5.133,00 |
0,00 |
4.388,00 |
|
|
B.V. LOSSES BEFORE TAXES (B.III+B.IV-A.III-A.IV): |
0,00 |
0,00 |
0,00 |
0,00 |
128.817,00 |
|
|
B.VI. RESULT OF THE PERIOD (LOSSES) (B.V+A.15+A.16): |
0,00 |
0,00 |
0,00 |
0,00 |
127.448,00 |
|
MERCANTILE
REGISTRY.
CASHFLOW STATEMENT
Model: Normal
>
Source of information: Data contained in this section is taken from the
information declared in the Annual Accounts submitted to the Trade Register.
|
|
2013 |
2012 |
2011 |
2010 |
2009 |
|
|
1.
Fiscal year result before taxes.: 61100 |
702.038,00 |
611.527,00 |
585.262,00 |
418.414,00 |
-128.817,00 |
|
|
2.
Results adjustments.: 61200 |
659.446,00 |
708.853,00 |
602.757,00 |
1.244.437,00 |
1.196.176,00 |
|
|
a) Fixed Assets Amortization (+).: 61201 |
329.615,00 |
300.289,00 |
372.872,00 |
446.337,00 |
686.389,00 |
|
|
b) Obsolescence Allowances (+/-). : 61202 |
0,00 |
0,00 |
0,00 |
21.833,00 |
41.456,00 |
|
|
c) Variation in Provision (+/-). : 61203 |
0,00 |
0,00 |
0,00 |
409.575,00 |
0,00 |
|
|
e) Results on disposal of fixed assets (+/-). : 61205 |
0,00 |
19.871,00 |
2.086,00 |
0,00 |
0,00 |
|
|
g) Financial income (-).: 61207 |
-18.454,00 |
-27.418,00 |
-149.485,00 |
-51,00 |
-1.950,00 |
|
|
h) Financial Expenses (+). : 61208 |
248.149,00 |
362.252,00 |
396.527,00 |
376.063,00 |
382.597,00 |
|
|
i) Exchange differences (+/-). : 61209 |
100.135,00 |
53.859,00 |
-19.243,00 |
-6.439,00 |
87.685,00 |
|
|
k) Other income and expense (-/+). : 61211 |
0,00 |
0,00 |
0,00 |
-2.880,00 |
0,00 |
|
|
3.
Changes in current capital equity.: 61300 |
-1.175.839,00 |
-299.763,00 |
-430.484,00 |
-469.956,00 |
272.865,00 |
|
|
a) Stock (+/-).: 61301 |
-1.002.650,00 |
124.689,00 |
-727.075,00 |
-621.499,00 |
891.214,00 |
|
|
d) Debtors and other accounts receivable (+/-). : 61302 |
628.052,00 |
-771.475,00 |
-224.536,00 |
-935.219,00 |
435.405,00 |
|
|
c) Other current assets (+/-). : 61303 |
0,00 |
0,00 |
0,00 |
30.000,00 |
32.463,00 |
|
|
d) Creditors and other accounts payable (+/-). : 61304 |
-801.241,00 |
366.153,00 |
501.997,00 |
1.055.682,00 |
-1.002.507,00 |
|
|
e) Other current liabilities (+/-).: 61305 |
0,00 |
-19.130,00 |
19.130,00 |
1.079,00 |
-83.709,00 |
|
|
4.
Other cash flows for operating activities.: 61400 |
-229.695,00 |
-334.834,00 |
-247.043,00 |
-376.012,00 |
0,00 |
|
|
a) Interest payments (-). : 61401 |
-248.149,00 |
-362.252,00 |
-396.528,00 |
-376.063,00 |
0,00 |
|
|
b) Dividend payment collection (+). : 61402 |
0,00 |
0,00 |
148.810,00 |
0,00 |
0,00 |
|
|
c) Interest collection (+). : 61403 |
18.454,00 |
27.418,00 |
675,00 |
51,00 |
0,00 |
|
|
5.
Operating activity cash flows (1 + 2 + 3 + 4) : 61500 |
-44.051,00 |
685.783,00 |
510.492,00 |
816.883,00 |
1.340.224,00 |
|
|
6.
Payments for investment (-).: 62100 |
-108.190,00 |
-169.413,00 |
-111.721,00 |
-26.294,00 |
-233.692,00 |
|
|
b) Intangible fixed assets. : 62102 |
-16.982,00 |
-36.500,00 |
0,00 |
0,00 |
-1.061,00 |
|
|
c) Fixed assets. : 62103 |
-89.675,00 |
-132.913,00 |
-80.420,00 |
-20.532,00 |
-196.631,00 |
|
|
e) Other financial assets. : 62105 |
-1.533,00 |
0,00 |
-31.301,00 |
-5.761,00 |
0,00 |
|
|
h) Other assets. : 62108 |
0,00 |
0,00 |
0,00 |
0,00 |
-36.000,00 |
|
|
7.
Divestment payment collection (+). : 62200 |
140.115,00 |
200.115,00 |
0,00 |
0,00 |
0,00 |
|
|
a) Companies of the group and affiliates. : 62201 |
140.115,00 |
140.115,00 |
0,00 |
0,00 |
0,00 |
|
|
e) Other financial assets. : 62205 |
0,00 |
60.000,00 |
0,00 |
0,00 |
0,00 |
|
|
8.
Investment activity cash flows (6 + 7) minus Amortization: 62300 |
31.925,00 |
30.703,00 |
-111.721,00 |
-26.294,00 |
-233.692,00 |
|
|
9.
Payment collection and payments for equity instruments. : 63100 |
0,00 |
0,00 |
0,00 |
0,00 |
-236.972,00 |
|
|
a) Issuance of equity instruments (+). : 63101 |
0,00 |
0,00 |
0,00 |
0,00 |
52.099,00 |
|
|
c) Acquisition of own equity instruments (-). : 63103 |
0,00 |
0,00 |
0,00 |
0,00 |
-236.972,00 |
|
|
10.
Payment collection and payments for financial liabilities instruments.:
63200 |
-26.732,00 |
-490.924,00 |
-570.334,00 |
-557.477,00 |
-703.758,00 |
|
|
a) Issuance : 63201 |
0,00 |
262.173,00 |
-570.334,00 |
5.710.177,00 |
2.000.000,00 |
|
|
2. Debts incurred with credit institutions (+). : 63203 |
0,00 |
130.000,00 |
-558.709,00 |
5.710.177,00 |
2.000.000,00 |
|
|
5. Other debts (+). : 63206 |
0,00 |
132.173,00 |
-11.625,00 |
0,00 |
0,00 |
|
|
b) Repayment and amortization of : 63207 |
-26.732,00 |
-753.096,00 |
0,00 |
-6.267.655,00 |
-2.703.758,00 |
|
|
2. Debts incurred with credit institutions (-).: 63209 |
-15.174,00 |
-753.096,00 |
0,00 |
-6.267.655,00 |
-2.598.135,00 |
|
|
5. Other debts (-). : 63212 |
-11.558,00 |
0,00 |
0,00 |
0,00 |
-105.623,00 |
|
|
11.
Payments from dividends and remunerations from other assets instruments. :
63300 |
0,00 |
0,00 |
0,00 |
0,00 |
0,00 |
|
|
12.
Cash flows for financing activities (9+10+11).: 63400 |
-26.732,00 |
-490.924,00 |
-570.334,00 |
-557.477,00 |
-940.730,00 |
|
|
D)
EFFECT OF EXCHANGE RATE CHANGES: 64000 |
-100.135,00 |
-53.859,00 |
0,00 |
0,00 |
0,00 |
|
|
E)
NET INCREASE/DECREASE OF CASH OR EQUIVALENT ASSETS (+/-5+/-8+/12+/-D) :
65000 |
-138.992,00 |
171.703,00 |
-171.563,00 |
233.112,00 |
165.803,00 |
|
|
Cash or equivalent assets as of beginning of the fiscal year.:
65100 |
568.233,00 |
396.530,00 |
568.093,00 |
334.981,00 |
169.178,00 |
|
|
Cash or equivalent assets as of end of the fiscal year.:
65200 |
429.241,00 |
568.233,00 |
396.530,00 |
568.093,00 |
334.981,00 |
|
FINANCIAL DIAGNOSIS
>
Economic-Financial Comparative Analysis
Data used in the following ratios and indicators is taken from the
Annual Accounts submitted by the company to the TRADE REGISTER.
>
Comparison within the Sector
|
Cash
Flow |
2013 |
2012 |
Variación
2013 - 2012 |
|
|||
|
|
Empresa |
Sector |
Empresa |
Sector |
Empresa |
Sector |
|
|
Cash
Flow over Sales: |
-0,01
% |
0,02
% |
0,01
% |
0,01
% |
-178,57
% |
192,58
% |
|
|
EBITDA
over Sales: |
7,48
% |
10,33
% |
7,36
% |
9,25
% |
1,53
% |
11,68
% |
|
|
Cash
Flow Yield: |
-0,01
% |
0,01
% |
0,01
% |
0,00
% |
-181,50
% |
|
|
|
Profitability |
2013 |
2012 |
Variación
2013 - 2012 |
|
|||
|
|
Empresa |
Sector |
Empresa |
Sector |
Empresa |
Sector |
|
|
Operating
economic profitability: |
8,58
% |
6,69
% |
8,20
% |
5,25
% |
4,69
% |
27,33
% |
|
|
Total
economic profitability: |
7,45
% |
3,62
% |
7,58
% |
2,50
% |
-1,75
% |
45,16
% |
|
|
Financial
profitability: |
18,24
% |
4,34
% |
18,69
% |
1,32
% |
-2,41
% |
228,52
% |
|
|
Margin:
|
5,61
% |
6,10
% |
5,54
% |
4,87
% |
1,18
% |
25,15
% |
|
|
Mark-up:
|
3,82
% |
4,07
% |
3,35
% |
1,59
% |
13,98
% |
155,69
% |
|
|
Solvency |
2013 |
2012 |
Variación
2013 - 2012 |
|
|||
|
|
Empresa |
Sector |
Empresa |
Sector |
Empresa |
Sector |
|
|
Liquidity:
|
0,06 |
0,14 |
0,07 |
0,12 |
-24,32 |
20,27 |
|
|
Acid
Test: |
0,58 |
0,85 |
0,68 |
0,85 |
-14,28 |
0,46 |
|
|
Working
Capital / Investment: |
0,10 |
0,02 |
0,08 |
0,03 |
24,07 |
-21,55 |
|
|
Solvency:
|
1,18 |
1,17 |
1,14 |
1,17 |
3,28 |
-0,76 |
|
|
Indebtedness |
2013 |
2012 |
Variación
2013 - 2012 |
|
|||
|
|
Empresa |
Sector |
Empresa |
Sector |
Empresa |
Sector |
|
|
Indebtedness
level: |
2,14 |
1,42 |
2,87 |
1,63 |
-25,34 |
-12,71 |
|
|
Borrowing
Composition: |
0,12 |
1,02 |
0,22 |
1,03 |
-46,98 |
-1,15 |
|
|
Repayment
Ability: |
-62,59 |
55,13 |
55,49 |
175,08 |
-212,80 |
-68,51 |
|
|
Warranty:
|
1,47 |
1,71 |
1,35 |
1,62 |
8,77 |
5,72 |
|
|
Generated
resources / Total creditors: |
0,12 |
0,08 |
0,09 |
0,07 |
31,31 |
23,25 |
|
|
Efficiency |
2013 |
2012 |
Variación
2013 - 2012 |
|
|||
|
|
Empresa |
Sector |
Empresa |
Sector |
Empresa |
Sector |
|
|
Productivity:
|
1,41 |
1,84 |
1,42 |
1,73 |
-0,39 |
6,48 |
|
|
Turnover
of Collection Rights : |
4,63 |
5,15 |
3,84 |
4,81 |
20,33 |
7,02 |
|
|
Turnover
of Payment Entitlements: |
3,22 |
3,71 |
2,54 |
3,52 |
26,82 |
5,42 |
|
|
Stock
rotation: |
3,80 |
7,85 |
4,68 |
6,54 |
-18,85 |
20,03 |
|
|
Assets
turnover: |
1,53 |
1,10 |
1,48 |
1,08 |
3,47 |
1,74 |
|
|
Borrowing
Cost: |
2,85 |
2,85 |
3,80 |
2,95 |
-24,98 |
-3,49 |
|
>
Trend of indicators under the General Accounting Plan of 2007 (2013, 2012,
2011, 2010, 2009)
|
Cash
Flow |
2013 |
2012 |
2011 |
2010 |
2009 |
|
|
Cash
Flow over Sales: |
-0,01
% |
0,01
% |
-0,01
% |
1,51
% |
1,22
% |
|
|
EBITDA
over Sales: |
7,48
% |
7,36
% |
7,46
% |
7,99
% |
7,60
% |
|
|
Cash
Flow Yield: |
-0,01
% |
0,01
% |
-0,01
% |
1,97
% |
1,54
% |
|
|
Profitability |
2013 |
2012 |
2011 |
2010 |
2009 |
|
|
Operating
economic profitability: |
8,58
% |
8,20
% |
7,23
% |
6,92
% |
3,36
% |
|
|
Total
economic profitability: |
7,45
% |
7,58
% |
7,94
% |
6,71
% |
2,36
% |
|
|
Financial
profitability: |
18,24
% |
18,69
% |
22,33
% |
20,19
% |
-7,68
% |
|
|
Margin:
|
5,61
% |
5,54
% |
5,11
% |
5,09
% |
2,54
% |
|
|
Mark-up:
|
3,82
% |
3,35
% |
3,68
% |
2,70
% |
-0,92
% |
|
|
Solvency |
2013 |
2012 |
2011 |
2010 |
2009 |
|
|
Liquidity:
|
0,06 |
0,07 |
0,05 |
0,09 |
0,07 |
|
|
Acid
Test: |
0,58 |
0,68 |
0,61 |
0,72 |
0,75 |
|
|
Working
Capital / Investment: |
0,10 |
0,08 |
0,07 |
0,10 |
0,10 |
|
|
Solvency:
|
1,18 |
1,14 |
1,12 |
1,18 |
1,21 |
|
|
Indebtedness |
2013 |
2012 |
2011 |
2010 |
2009 |
|
|
Indebtedness
level: |
2,14 |
2,87 |
3,61 |
4,69 |
5,48 |
|
|
Borrowing
Composition: |
0,12 |
0,22 |
0,34 |
0,49 |
0,77 |
|
|
Repayment
Ability: |
-62,59 |
55,49 |
-56,39 |
5,87 |
8,52 |
|
|
Warranty:
|
1,47 |
1,35 |
1,28 |
1,21 |
1,18 |
|
|
Generated
resources / Total creditors: |
0,12 |
0,09 |
0,10 |
0,09 |
0,08 |
|
|
Efficiency |
2013 |
2012 |
2011 |
2010 |
2009 |
|
|
Productivity:
|
1,41 |
1,42 |
1,39 |
1,43 |
1,37 |
|
|
Turnover
of Collection Rights : |
4,63 |
3,84 |
4,17 |
3,72 |
3,93 |
|
|
Turnover
of Payment Entitlements: |
3,22 |
2,54 |
2,60 |
2,60 |
3,20 |
|
|
Stock
rotation: |
3,80 |
4,68 |
4,11 |
4,94 |
5,59 |
|
|
Assets
turnover: |
1,53 |
1,48 |
1,42 |
1,36 |
1,32 |
|
|
Borrowing
Cost: |
2,85 |
3,80 |
4,10 |
3,85 |
4,21 |
|
COMPARATIVE SECTORIAL BALANCE
Sector-based
Comparison under the rules of the New General Accounting Plan.
|
|
Variación
- |
|
|
|
Empresa |
Sector |
|
|
Variación
- |
|
|
|
Empresa |
Sector |
|
|
Variación
- |
|
|
|
Empresa |
Sector |
|
Public Tenders and Works Won
|
No Public Tenders assigned to the name of the company.
Detail of Subsidies appearing in
Balances Memories
|
|
Entity |
MINISTERIO
DE INDUSTRIA Y ENERGIA - MINISTERIO DE CIENCIA Y TECNOLOGIA |
|
Subsidy
Concept |
Subvenciones
de capital. |
|
Status |
CONCEDIDA |
|
Amount
Granted |
47.874,65 |
|
Notes |
El
importe reflejado es el imputado a resultados. Varias subvenciones. |
|
Entity |
MINISTERIO
DE INDUSTRIA Y ENERGIA - MINISTERIO DE CIENCIA Y TECNOLOGIA |
|
Subsidy
Concept |
Subvenciones
de capital |
|
Status |
CONCEDIDA |
|
Amount
Granted |
49.587,00 |
|
Notes |
Dentro
de estas subvenciones se incluyen las concedidas por parte del Ministerio de
Industria y Energía para financiar la mejora de la planta depuradora que la sociedad
tiene en Palafolls. así como una subvención concedida por parte del
Ministerio de Ciencia y Tecnología para financiar la implantación de un
proceso de nanofiltración para la obtención de blanqueadores ópticos, y la
nueva subvención del Ministerio de Ciencia y Tecnología para financiar la
implantación de un software informático que permita un control de
mantenimiento preventivo. El importe reflejado corresponde al traspasado a
resultados del ejercicio, quedando pendiente de imputar al cierre 130.033,00
euros. Adiciones durante el ejercicio: 21.330,00 euros. |
|
Entity |
MINISTERIO
DE INDUSTRIA Y ENERGIA |
|
Subsidy
Concept |
SUBVENCION
DE CAPITAL |
|
Amount
Granted |
44.255,00 |
|
Notes |
PARA
FINANCIAR LA MEJORA DE LA PLANTA DEPURADORA QUE LA SOCIEDAD TIENE EN
PALAFOLLS. EL IMPORTE REFLEJADO ES EL QUE PERTENECE AL IMPUTADO A RESULTADOS. |
Research Summary
|
|
The firm was established in 1996, and continues the business started by the families Rovira, Bachs and Maciá back in 1925. It is engaged in the manufacture and sale of chemicals and develops its activity both nationally and internationally. There is no evidence of any default in the sources consulted, although according to the last figures filed at the Trade Registry, it can be noticed that despite the results of the fiscal year are positive(740,619 Euro/s), there are still losses from past fiscal years (-2,339,849 Euro/s). Its own funds are positive in 4, 060,785 Euros. Although it is considered apt to keep being related to usual risk operations, it is advisable to monitore its comercial evolution in an on-going basis. |
Sources
|
Registry
of Commerce's Official Gazette. Own and external data bases Company
References |
FOREIGN EXCHANGE RATES
|
Currency |
Unit
|
Indian Rupees |
|
US Dollar |
1 |
Rs.61.88 |
|
UK Pound |
1 |
Rs.96.90 |
|
Euro |
1 |
Rs.76.29 |
INFORMATION DETAILS
|
Analysis Done by
: |
SUB |
|
|
|
|
Report Prepared
by : |
MNL |
RATING EXPLANATIONS
|
RATING |
STATUS |
PROPOSED CREDIT LINE |
|
|
>86 |
Aaa |
Possesses an extremely sound financial base with the strongest capability
for timely payment of interest and principal sums |
Unlimited |
|
71-85 |
Aa |
Possesses adequate working capital. No caution needed for credit
transaction. It has above average (strong) capability for payment of interest
and principal sums |
Large |
|
56-70 |
A |
Financial & operational base are regarded healthy. General
unfavourable factors will not cause fatal effect. Satisfactory capability for
payment of interest and principal sums |
Fairly Large |
|
41-55 |
Ba |
Overall operation is considered normal. Capable to meet normal
commitments. |
Satisfactory |
|
26-40 |
B |
Capability to overcome financial difficulties seems comparatively
below average. |
Small |
|
11-25 |
Ca |
Adverse factors are apparent. Repayment of interest and principal sums
in default or expected to be in default upon maturity |
Limited with
full security |
|
<10 |
C |
Absolute credit risk exists. Caution needed to be exercised |
Credit not
recommended |
|
-- |
NB |
New Business |
-- |
This score serves as a reference to assess
SC’s credit risk and to set the amount of credit to be extended. It is
calculated from a composite of weighted scores obtained from each of the major
sections of this report. The assessed factors and their relative weights (as
indicated through %) are as follows:
Financial
condition (40%) Ownership
background (20%) Payment
record (10%)
Credit history
(10%) Market trend (10%) Operational size
(10%)
This report is issued at your request without any
risk and responsibility on the part of MIRA INFORM PRIVATE LIMITED (MIPL)
or its officials.