MIRA INFORM REPORT
|
Report Date : |
24.12.2014 |
IDENTIFICATION DETAILS
|
Name : |
CASTLE AGROINDUSTRIAL SA |
|
|
|
|
Registered Office : |
C/ Plata, 33 -C - Parcela 64-B. Pol. Industrial. - |
|
|
|
|
Country : |
|
|
|
|
|
Financials (as on) : |
2013 |
|
|
|
|
Date of Incorporation : |
17.06.1988 |
|
|
|
|
Legal Form : |
Public Limited Company |
|
|
|
|
Line of Business : |
Engaged in trade and distribution of Agricultural,
Industrial and Forestry Machinery. Subject product
ranges includes: Agricultural And
Forestry · Agricultural Axles · Tires And Wheels · Suspensions · Rotation Systems · Supports · Power · Farm Equipment · Accessories Body · Electrical Accessories Components
Aperos · Components For Seed · Components For Growers · Components For Chisel · Component Gradas · Component Arados Speed · Axes · Tires · Enganches · Supports Hydraulic · Cylinder · Cylinder Components · Pumps And Accessories · Gear Pumps And Motors · Orbitroles And Piston Engines · Valve Plate (Ng6, Ng10) · Filters And Accessories · Measurement And Safety Components · Pipes And Connections · Power Units · Truck Components Overhead · Addresses Hydrostatic And Accessories · Directional Valve And Handlers · Hydraulic Valve Miscellaneous |
|
|
|
|
No of Employees : |
14 (2014) |
RATING & COMMENTS
|
MIRA’s Rating : |
Ba |
|
RATING |
STATUS |
PROPOSED CREDIT LINE |
|
|
41-55 |
Ba |
Overall operation is considered normal. Capable to meet normal commitments. |
Satisfactory |
|
Status : |
Satisfactory |
|
Payment Behaviour : |
No Complaints |
|
Litigation : |
Clear |
NOTES :
Any query related to this report can be made
on e-mail : infodept@mirainform.com
while quoting report number, name and date.
ECGC Country Risk Classification List – September 30, 2014
|
Country Name |
Previous Rating (30.06.2014) |
Current Rating (30.09.2014) |
|
|
a2 |
a2 |
|
Risk Category |
ECGC Classification |
|
Insignificant |
A1 |
|
Low |
A2 |
|
Moderate |
B1 |
|
High |
B2 |
|
Very High |
C1 |
|
Restricted |
C2 |
|
Off-credit |
D |
|
|
|
|
Source : CIA |
EXECUTIVE SUMMARY
|
Name: |
CASTLE
AGROINDUSTRIAL SA |
|
NIF
/ Fiscal code: |
A47086152 |
|
Trade
Name |
CASTLE |
|
Status: |
ACTIVE |
|
Incorporation
Date: |
17/06/1988 |
|
Register
Data |
Register
Section 8 Sheet 1707 |
|
Last
Publication in BORME: |
12/09/2014
[Miscellaneous Concepts] |
|
Last
Published Account Deposit: |
2013 |
|
Share
Capital: |
90.000 |
|
|
|
|
Localization: |
C/
PLATA, 33 -C - PARCELA 64-B. POL. INDUSTRIAL. - |
|
Telephone
- Fax - Email
– Website: |
Ph.:.
983 217 326 Email.
pedidos@castleagroindustrial.com
Website.
www.castleagroindustrial.com/
|
|
|
|
|
Activity: |
|
|
NACE: |
4661
- Wholesale of agricultural machinery, equipment and supplies |
|
Registered
Trademarks: |
|
|
Audited
/ Opinion: |
No |
|
Tenders
and Awards: |
0
for a total cost of 0 |
|
Subsidies: |
1
for a total cost of 3000 |
|
Quality
Certificate: |
No |
|
|
|
|
Risk: |
|
|
|
The
capacity to meet payment obligations shows no difficulties at present,
although this may not last for long. |
|
|
|
Number |
Amount
(€) |
Most
Recent Entry |
|
Insolvency
Proceedings, Bankruptcy and Suspension of Payments |
|
Unpublished |
--- |
--- |
|
Defaults
on debt with Financial Institutions and Large Companies |
|
None |
--- |
--- |
|
Judicial
Claims (Notices, Executive Proceedings, Attachments, Auctions, Bad Debt) |
|
None |
0 |
--- |
|
Proceedings
heard by the |
|
Unpublished |
0 |
--- |
|
Proceedings
heard by the |
|
Unpublished |
0 |
--- |
|
Partners: |
||
|
JOSE
LUIS HERRADOR GALAN |
|
|
|
JOSE
LUIS MIÑO MARTIN |
|
|
|
Shares: |
0 |
|
|
Other
Links: |
1 |
|
|
No.
of Active Corporate Bodies: |
|
|
|
Guarantees: |
|
|
Properties
Registered: |
Company
NO, Administrator NO |
|
Financing
/ Guarantee Sources : |
Sources
YES, Guarantees NO |
|
|
|
|
|
|
INVESTIGATION SUMMARY
|
|
|
Company
dedicated to the trade and distribution of agricultural, industrial and
forestry machinery. Its annual sales during the year 2013 increased by 10.79%
over the previous year 2012. |
|
|
Identification
|
|
|
Social
Denomination: |
CASTLE AGROINDUSTRIAL SA |
|
Trade
Name: |
CASTLE |
|
NIF
/ Fiscal code: |
A47086152 |
|
Corporate
Status: |
ACTIVE |
|
Start
of activity: |
1988 |
|
Registered
Office: |
C/ PLATA, 33 -C - PARCELA
64-B. POL. INDUSTRIAL. |
|
Locality: |
|
|
Province: |
|
|
Postal
Code: |
47012 |
|
Telephone: |
983 217 326 |
|
Fax: |
983 210 144 |
|
Website: |
|
|
Email: |
|
Activity
|
|
|
NACE: |
4661 |
|
CNAE
Obtaining Source: |
4661 |
|
Additional
Information: |
It is dedicated to the trade
and distribution of agricultural, industrial and forestry machinery. |
|
Import
/ export: |
IMPORTS / EXPORTS |
|
Future
Perspective: |
Product / service
improvement |
|
Industry
situation: |
Maturity |
Agricultural and
Forestry
· Agricultural Axles
· Tires And Wheels
· Suspensions
· Rotation Systems
· Supports
· Power
· Farm Equipment
· Accessories Body
· Electrical Accessories
Components Aperos
· Components For Seed
· Components For Growers
· Components For Chisel
· Component Gradas
· Component Arados
Speed
· Axes
· Tires
· Enganches
· Supports
Hydraulic
· Cylinder
· Cylinder Components
· Pumps And Accessories
· Gear Pumps And Motors
· Orbitroles And Piston Engines
· Valve Plate (Ng6, Ng10)
· Filters And Accessories
· Measurement And Safety Components
· Pipes And Connections
· Power Units
· Truck Components Overhead
· Addresses Hydrostatic And Accessories
· Directional Valve And Handlers
Hydraulic Valve Miscellaneous
Number of Employees
|
|
|
Year |
No. of employees |
|
|
|
|
|
2014 |
14 |
|
|
|
|
Chronological Summary
|
|||
|
|
|
|
|
|
|
Year |
Act |
|
|
|
1990 |
Accounts deposit (ejer.
1989) Appointments/ Re-elections (1) |
|
|
|
1991 |
Accounts deposit (ejer.
1990) |
|
|
|
1992 |
Adaptation to Law (1) Appointments/
Re-elections (1) Dividends Payment (1) |
|
|
|
1993 |
Accounts deposit (ejer.
1992) Change of Social address (1) |
|
|
|
1994 |
Accounts deposit (ejer.
1993) |
|
|
|
1995 |
Accounts deposit (ejer.
1994) |
|
|
|
1996 |
Accounts deposit (ejer.
1995) |
|
|
|
1997 |
Accounts deposit (ejer.
1996) Appointments/ Re-elections (1) |
|
|
|
1998 |
Accounts deposit (ejer.
1997) |
|
|
|
1999 |
Accounts deposit (ejer.
1998) Appointments/ Re-elections (1) |
|
|
|
2000 |
Accounts deposit (ejer.
1999) |
|
|
|
2001 |
Accounts deposit (ejer.
2000) |
|
|
|
2002 |
Accounts deposit (ejer.
2001) |
|
|
|
2003 |
Accounts deposit (ejer.
2002) Appointments/ Re-elections (1) |
|
|
|
2004 |
Accounts deposit (ejer.
2003) |
|
|
|
2005 |
Accounts deposit (ejer.
2004) |
|
|
|
2007 |
Accounts deposit (ejer.
2005, 2006) |
|
|
|
2008 |
Accounts deposit (ejer.
2007) Appointments/ Re-elections (1) |
|
|
|
2009 |
Accounts deposit (ejer.
2008) |
|
|
|
2010 |
Accounts deposit (ejer.
2009) |
|
|
|
2011 |
Accounts deposit (ejer.
2010) |
|
|
|
2012 |
Accounts deposit (ejer.
2011) |
|
|
|
2013 |
Accounts deposit (ejer. 2012)
Appointments/ Re-elections (1) |
|
|
|
2014 |
Accounts deposit (ejer.
2013) Capital Reduction (1) Change of Social address (1) Other Concepts/
Events (2) |
|
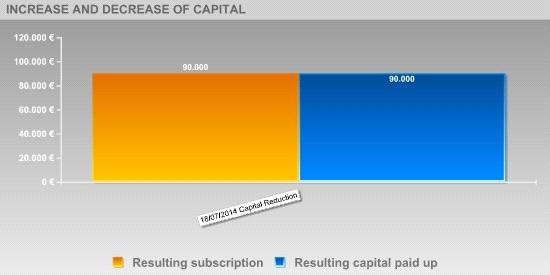
Breakdown of Owners' Equity
|
|
|
Registered
Capital: |
90.000 |
|
Paid
up capital: |
90.000 |
|
Updated Evolution of the Subscribed and Paid-in Capital
|
|||||
|
|
|
|
|
|
|
|
|
|||||
|
|
|
|
|
|
|
|
Publishing Date |
Registration Type |
Capital Subscribed |
Paid up capital |
Underwritten result |
Disbursed Result |
|
18/05/1992 |
Capital call payment |
--- |
29.930 |
--- |
--- |
|
18/07/2014 |
Capital Reduction |
-152 |
-152 |
90.000 |
90.000 |
Active Social Bodies
|
|
Post published |
Social Body's Name |
Appointment Date |
Other Positions in this
Company |
|
JOINT ADMINISTRATOR |
HERRADOR GALAN JOSE LUIS |
13/03/2013 |
7 |
|
|
MIÑO MARTIN JOSE LUIS |
13/03/2013 |
7 |
|
JOINT ATTORNEY |
HERRADOR GALAN JOSE LUIS |
17/07/1999 |
7 |
|
|
MIÑO MARTIN JOSE LUIS |
17/07/1999 |
7 |
Historical Social Bodies
|
||||
|
|
|
|||
|
Social Body's Name |
Post published |
End Date |
Other Positions in this
Company |
|
|
HERRADOR GALAN JOSE LUIS |
JOINT ADMINISTRATOR |
31/10/1997 |
7 |
|
|
|
JOINT ADMINISTRATOR |
09/01/2003 |
|
|
|
|
JOINT ADMINISTRATOR |
30/01/2008 |
|
|
|
|
JOINT ADMINISTRATOR |
13/03/2013 |
|
|
|
|
PROXY |
17/07/1999 |
|
|
|
MIÑO MARTIN JOSE LUIS |
PROXY |
17/07/1999 |
7 |
|
|
|
JOINT ADMINISTRATOR |
09/01/2003 |
|
|
|
|
JOINT ADMINISTRATOR |
30/01/2008 |
|
|
|
|
JOINT ADMINISTRATOR |
13/03/2013 |
|
|
|
|
JOINT ADMINISTRATOR |
31/10/1997 |
|
|
Executive board
|
Post |
NIF |
Name |
|
ADMINISTRATOR |
|
JOSE LUIS HERRADOR GALAN |
|
ADMINISTRATOR |
|
JOSE LUIS MIÑO MARTIN |
|
FINANCIAL DIRECTOR |
|
PEDRO JUAN MANUEL
RODRIGUEZ |
|
MANAGING DIRECTOR |
|
JOSE LUIS HERRADOR GALAN |
Defaults, Legal Claims and
Insolvency Proceedings
|
Section enabling assessment of the degree of compliance of the company queried with its payment obligations. It provides information on the existence and nature of all stages of Insolvency and Legal Proceedings published with reference to the Company in the country's various Official Bulletins and national newspapers, as well
Defaults Registered in the main national credit bureaus (ASNEF Industrial and RAI ).
> Summary
Chronological summary
|
|
|
Number
of Publications |
Amount
(_) |
Start
date |
End
date |
|
Insolvency
Proceedings, Bankruptcy and Suspension of Payments |
|
Unpublished |
--- |
--- |
--- |
|
Request/Declaration |
|
0 |
--- |
date |
|
|
Proceedings |
|
--- |
--- |
|
--- |
|
Resolution |
|
--- |
--- |
|
--- |
|
Defaults
on debt with Financial Institutions and Large Companies |
Bank and Commercial Delinquency |
None |
0 |
|
|
|
Status:
Friendly |
|
--- |
|
|
|
|
Status:
Pre-Litigation |
|
--- |
|
|
|
|
Status:
Litigation |
|
--- |
|
|
|
|
Status:
Non-performing |
|
--- |
|
|
|
|
Status:
insolvency proceedings, bankruptcy and suspension of payments |
|
--- |
|
|
|
|
Other
status |
|
--- |
|
|
|
|
Legal
and Administrative Proceedings |
|
Unpublished |
--- |
|
|
|
Notices
of defaults and enforcement |
|
--- |
--- |
|
--- |
|
Seizures |
|
--- |
--- |
|
--- |
|
Auctions |
|
--- |
--- |
|
--- |
|
Declarations
of insolvency and bad debt |
|
--- |
--- |
|
--- |
|
Proceedings
heard by the |
|
Unpublished |
--- |
|
|
|
Proceedings
heard by the |
|
Unpublished |
--- |
|
|
Probability of default
|
> Estimated Probability
of Default for the next 12 months: 2.621 %
> Latest Scoring Changes:
|
Sector
in which comparison is carried out: 466 Wholesale
of other machinery, equipment and supplies |
|
|
Relative
Position:
|
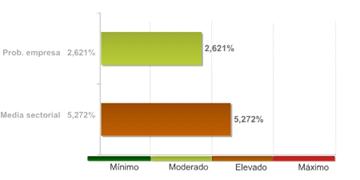
The
company's comparative analysis with the rest of the companies that comprise the
sector, shows the company holds a better position with regard to the
probability of non-compliance.
The
54.00% of the companies of the sector CASTLE AGROINDUSTRIAL SA belongs to show a
higher probability of non-compliance.
The
probability of the company's non-compliance with its payment obligations within
deadlines estimated by our qualifications models is 2.621%.
In
the event they fail to comply with the payment, the seriousness of the loss
will depend on factors such as the promptness of the commencement of the
charging management, the existence of executive documents which match the
credit or the existence of guarantees and free debt assets under the name of
the debtor. Therefore, the probability of non-compliance should not be solely
interpreted as the total loss of the owed amount.
|
LEGAL CLAIMS
|
|
|
|
|
|
Summary
of Judicial Claims |
|
|
|
|
|
|
|
|
||
|
|
|
No se han publicado |
|
|
|
|
No se han publicado |
|
|
|
|
||
|
|
|
No se han publicado |
|
|
|
|
No se han publicado |
|
|
|
|
No se han publicado |
|
|
|
|
No se han publicado |
|
|
|
|
||
|
|
|
No se han publicado |
|
|
|
|
No se han publicado |
|
|
|
|
||
|
|
|
No se han publicado |
|
Suppliers
|
Name |
|
ADR |
|
BELLOTA |
|
BERMA |
|
ALLIANCE |
|
MICHELIN |
|
COMER INDUSTRIES |
|
DANFOSS |
Link List
|
IS RELATED WITH: |
1 Entities |
|
SHAREHOLDERS: |
2 Entities |
> Shareholders
|
Relationship |
Entity |
Province |
Shareholding stake |
|
SHAREHOLDERS |
JOSE LUIS HERRADOR GALAN |
|
|
|
|
JOSE LUIS MIÑO MARTIN |
|
|
> Other
relationships
|
Relationship |
Entity |
Province |
Shareholding stake |
|
IS RELATED WITH |
CLEMENTE RUEDA Y ASOCIADOS
SL |
VALLADOLID |
|
Turnover
|
|
|
Total
Sales 2013 |
3.799.166,56 |
Financial Accounts and Balance
Sheets
|
|
|
|
|
Financial Years Presented
|
Ejercicio |
Tipo
de Cuentas Anuales |
Fecha
Presentacion |
|
2013 |
Normales |
September
2014 |
|
2012 |
Normales |
October
2013 |
|
2011 |
Normales |
September
2012 |
|
2010 |
Normales |
October
2011 |
|
2009 |
Normales |
October
2010 |
|
2008 |
Normales |
November
2009 |
|
2007 |
Normales |
October
2008 |
|
2006 |
Normales |
November
2007 |
|
2005 |
Normales |
December
2006 |
|
2004 |
Normales |
November
2005 |
|
2003 |
Normales |
October
2004 |
|
2002 |
Normales |
September
2003 |
|
2001 |
Normales |
October
2002 |
|
2000 |
Normales |
September
2001 |
|
1999 |
Normales |
July
2000 |
|
1998 |
Normales |
July
1999 |
|
1997 |
Normales |
July
1998 |
|
1996 |
Normales |
July
1997 |
|
1995 |
Normales |
September
1996 |
|
1994 |
Normales |
September
1995 |
|
1993 |
Normales |
September
1994 |
|
1992 |
Normales |
September
1993 |
|
1990 |
Normales |
September
1991 |
|
1989 |
Normales |
September
1990 |
The
data in the report regarding the last Company Accounts submitted by the company
is taken from the TRADE REGISTER serving the region in which the company's
address is located 31/12/2013
>
Balance en formato Abreviado de acuerdo al Nuevo Plan General Contable
2007
Information corresponding to the fiscal year 2013 2012 2011 2010 2009 is taken from information submitted to the TRADE REGISTER. Data corresponding to fiscal years before 2013 2012 2011 2010 2009 has been compiled based on the equivalence criteria stipulated in Act JUS/206/2009. Where the provisions of the Act did not establish relevant equivalence criteria.
|
|
ORIGINAL |
ORIGINAL |
ORIGINAL |
ORIGINAL |
ORIGINAL |
|
|
Assets |
2013 |
2012 |
2011 |
2010 |
2009 |
|
|
A)
NON-CURRENT ASSETS: 11000 |
253.566,00 |
279.440,00 |
314.640,00 |
397.344,00 |
492.092,00 |
|
|
I. Intangible fixed assets : 11100 |
34.808,00 |
9.229,00 |
27.845,00 |
49.195,00 |
71.878,00 |
|
|
II. Tangible fixed assets : 11200 |
206.668,00 |
258.121,00 |
274.706,00 |
336.060,00 |
405.802,00 |
|
|
III. Real estate investment: 11300 |
0,00 |
0,00 |
0,00 |
0,00 |
0,00 |
|
|
IV. Long-term investments in Group companies and associates :
11400 |
0,00 |
0,00 |
0,00 |
0,00 |
0,00 |
|
|
V. Long-term financial investments: 11500 |
12.090,00 |
12.090,00 |
12.090,00 |
12.090,00 |
14.412,00 |
|
|
VI. Assets for deferred tax : 11600 |
0,00 |
0,00 |
0,00 |
0,00 |
0,00 |
|
|
VII. Non-current trade debtors : 11700 |
0,00 |
0,00 |
0,00 |
0,00 |
0,00 |
|
|
B)
CURRENT ASSETS: 12000 |
2.317.439,00 |
2.746.517,00 |
3.207.968,00 |
2.577.090,00 |
2.546.080,00 |
|
|
I. Non-current assets held for sale : 12100 |
0,00 |
0,00 |
0,00 |
0,00 |
0,00 |
|
|
II. Stocks: 12200 |
1.690.136,00 |
1.818.097,00 |
1.830.329,00 |
1.602.717,00 |
1.468.538,00 |
|
|
III. Trade debtors and others receivable accounts: 12300 |
622.891,00 |
509.370,00 |
696.037,00 |
570.992,00 |
593.619,00 |
|
|
1.- Customers for sales and provisions of
services : 12380 |
622.891,00 |
509.370,00 |
696.037,00 |
570.992,00 |
570.141,00 |
|
|
a) Long-term
receivables from sales and services supplied : 12381 |
0,00 |
0,00 |
0,00 |
570.992,00 |
570.141,00 |
|
|
b) Customers for
sales and provisions of services : 12382 |
622.891,00 |
509.370,00 |
696.037,00 |
0,00 |
0,00 |
|
|
2.- Called up share capital : 12370 |
0,00 |
0,00 |
0,00 |
0,00 |
0,00 |
|
|
3.- Other accounts receivable :
12390 |
0,00 |
0,00 |
0,00 |
0,00 |
23.478,00 |
|
|
IV. Short-term investments in Group companies and associates:
12400 |
0,00 |
0,00 |
0,00 |
0,00 |
0,00 |
|
|
V. Short-term financial investments : 12500 |
0,00 |
0,00 |
0,00 |
0,00 |
39.487,00 |
|
|
VI. Short-term accruals: 12600 |
0,00 |
0,00 |
0,00 |
0,00 |
0,00 |
|
|
VII. Cash and other equivalent liquid assets : 12700 |
4.411,00 |
419.050,00 |
681.601,00 |
403.381,00 |
444.435,00 |
|
|
TOTAL
ASSETS (A + B) : 10000 |
2.571.005,00 |
3.025.957,00 |
3.522.608,00 |
2.974.434,00 |
3.038.172,00 |
|
|
|
ORIGINAL |
ORIGINAL |
ORIGINAL |
ORIGINAL |
ORIGINAL |
|
|
Liabilities
and Net Worth |
2013 |
2012 |
2011 |
2010 |
2009 |
|
|
A)
NET WORTH: 20000 |
1.238.903,00 |
1.200.189,00 |
1.185.360,00 |
907.038,00 |
845.416,00 |
|
|
A1) Shareholders' equity : 21000 |
1.238.903,00 |
1.200.189,00 |
1.182.360,00 |
901.038,00 |
836.416,00 |
|
|
I. Capital: 21100 |
90.152,00 |
90.152,00 |
90.152,00 |
90.152,00 |
90.152,00 |
|
|
1.- Registered
capital: 21110 |
90.152,00 |
90.152,00 |
90.152,00 |
90.152,00 |
90.152,00 |
|
|
2.- (Uncalled
capital) : 21120 |
0,00 |
0,00 |
0,00 |
0,00 |
0,00 |
|
|
II. Share premium: 21200 |
0,00 |
0,00 |
0,00 |
0,00 |
0,00 |
|
|
III. Reserves: 21300 |
1.034.243,00 |
956.624,00 |
790.945,00 |
746.264,00 |
713.195,00 |
|
|
IV. (Common stock equity): 21400 |
0,00 |
0,00 |
0,00 |
0,00 |
0,00 |
|
|
V. Profit or loss brought forward:
21500 |
0,00 |
0,00 |
0,00 |
0,00 |
0,00 |
|
|
VI. Other shareholders'
contributions: 21600 |
0,00 |
0,00 |
0,00 |
0,00 |
0,00 |
|
|
VII. Result of the period: 21700 |
114.509,00 |
153.413,00 |
301.263,00 |
64.621,00 |
33.070,00 |
|
|
VIII. (Interim dividend): 21800 |
0,00 |
0,00 |
0,00 |
0,00 |
0,00 |
|
|
IX. Other net worth instruments:
21900 |
0,00 |
0,00 |
0,00 |
0,00 |
0,00 |
|
|
A-2) Adjustments due to changes in value: 22000 |
0,00 |
0,00 |
0,00 |
0,00 |
0,00 |
|
|
A-3) Received subsidies, donations and legacies: 23000 |
0,00 |
0,00 |
3.000,00 |
6.000,00 |
9.000,00 |
|
|
B)
NON-CURRENT LIABILITIES: 31000 |
4.313,00 |
20.947,00 |
17.874,00 |
43.485,00 |
74.581,00 |
|
|
I. Long-term provisions: 31100 |
0,00 |
0,00 |
0,00 |
0,00 |
0,00 |
|
|
II. Long-term creditors : 31200 |
4.313,00 |
20.947,00 |
17.874,00 |
43.485,00 |
74.581,00 |
|
|
1.- Amounts owed to credit institutions:
31220 |
4.313,00 |
20.947,00 |
0,00 |
0,00 |
0,00 |
|
|
2.- Creditors from financial leasing :
31230 |
0,00 |
0,00 |
17.874,00 |
43.485,00 |
74.581,00 |
|
|
3.- Other long-term creditors :
31290 |
0,00 |
0,00 |
0,00 |
0,00 |
0,00 |
|
|
III. Long-term debts with Group companies and associates:
31300 |
0,00 |
0,00 |
0,00 |
0,00 |
0,00 |
|
|
IV. Liabilities for deferred tax: 31400 |
0,00 |
0,00 |
0,00 |
0,00 |
0,00 |
|
|
V. Long-term accruals: 31500 |
0,00 |
0,00 |
0,00 |
0,00 |
0,00 |
|
|
VI. Non-current trade creditors : 31600 |
0,00 |
0,00 |
0,00 |
0,00 |
0,00 |
|
|
VII. Special long-term debts : 31700 |
0,00 |
0,00 |
0,00 |
0,00 |
0,00 |
|
|
C)
CURRENT LIABILITIES : 32000 |
1.327.789,00 |
1.804.821,00 |
2.319.375,00 |
2.023.911,00 |
2.118.174,00 |
|
|
I. Liabilities linked to non-current assets held for sale :
32100 |
0,00 |
0,00 |
0,00 |
0,00 |
0,00 |
|
|
II. Short-term provisions: 32200 |
0,00 |
0,00 |
0,00 |
0,00 |
0,00 |
|
|
III. Short-term creditors : 32300 |
662.188,00 |
1.373.040,00 |
1.501.529,00 |
1.404.539,00 |
1.542.072,00 |
|
|
1.- Amounts owed to credit institutions:
32320 |
642.960,00 |
1.256.348,00 |
1.472.963,00 |
1.314.064,00 |
1.493.832,00 |
|
|
2.- Creditors from financial leasing :
32330 |
0,00 |
17.807,00 |
25.487,00 |
31.055,00 |
42.839,00 |
|
|
3.- Other short-term creditors :
32390 |
19.227,00 |
98.884,00 |
3.079,00 |
59.420,00 |
5.401,00 |
|
|
IV. Short-term debts with Group companies and associates:
32400 |
0,00 |
0,00 |
0,00 |
0,00 |
0,00 |
|
|
V. Trade creditors and other accounts payable: 32500 |
665.601,00 |
431.782,00 |
817.846,00 |
619.372,00 |
576.103,00 |
|
|
1.- Suppliers: 32580 |
437.958,00 |
265.440,00 |
553.986,00 |
455.094,00 |
396.210,00 |
|
|
a) Long-term debts :
32581 |
0,00 |
0,00 |
553.986,00 |
455.094,00 |
396.210,00 |
|
|
b) Short-term debts :
32582 |
437.958,00 |
265.440,00 |
0,00 |
0,00 |
0,00 |
|
|
2.- Other creditors : 32590 |
227.643,00 |
166.342,00 |
263.859,00 |
164.278,00 |
179.893,00 |
|
|
VI. Short-term accruals: 32600 |
0,00 |
0,00 |
0,00 |
0,00 |
0,00 |
|
|
VII. Special short-term debts : 32700 |
0,00 |
0,00 |
0,00 |
0,00 |
0,00 |
|
|
TOTAL
NET WORTH AND LIABILITIES (A + B + C) : 30000 |
2.571.005,00 |
3.025.957,00 |
3.522.608,00 |
2.974.434,00 |
3.038.172,00 |
|
|
|
ORIGINAL |
ORIGINAL |
ORIGINAL |
ORIGINAL |
ORIGINAL |
|
|
Profit
and Loss |
2013 |
2012 |
2011 |
2010 |
2009 |
|
|
1. Net turnover: 40100 |
3.799.167,00 |
3.429.087,00 |
4.082.681,00 |
3.476.902,00 |
3.562.625,00 |
|
|
2. Changes in stocks of finished goods and work in progress:
40200 |
0,00 |
0,00 |
0,00 |
0,00 |
0,00 |
|
|
3. Works carried out by the company for its assets: 40300 |
0,00 |
0,00 |
0,00 |
0,00 |
0,00 |
|
|
4. Supplies : 40400 |
-2.671.741,00 |
-2.280.717,00 |
-2.724.683,00 |
-2.297.265,00 |
-2.345.419,00 |
|
|
5. Other operating income: 40500 |
79.350,00 |
79.625,00 |
90.423,00 |
94.925,00 |
83.387,00 |
|
|
6. Personnel costs: 40600 |
-533.724,00 |
-529.435,00 |
-498.935,00 |
-500.654,00 |
-543.660,00 |
|
|
7. Other operating costs: 40700 |
-389.752,00 |
-339.431,00 |
-376.022,00 |
-494.996,00 |
-501.910,00 |
|
|
8. Amortisation of fixed assets: 40800 |
-70.631,00 |
-96.511,00 |
-94.950,00 |
-100.178,00 |
-107.137,00 |
|
|
9. Allocation of subsidies of non-financial fixed assets and
other: 40900 |
0,00 |
3.000,00 |
3.000,00 |
3.000,00 |
3.000,00 |
|
|
10. Excess provisions : 41000 |
0,00 |
0,00 |
0,00 |
0,00 |
0,00 |
|
|
11. Impairment and result of transfers of fixed assets:
41100 |
-115,00 |
296,00 |
5.920,00 |
0,00 |
0,00 |
|
|
12. Negative difference in combined businesses: 41200 |
0,00 |
0,00 |
0,00 |
0,00 |
0,00 |
|
|
13. Other results : 41300 |
0,00 |
-3.000,00 |
0,00 |
0,00 |
0,00 |
|
|
A)
OPERATING INCOME (1 + 2 + 3 + 4 + 5 + 6 + 7 + 8 + 9 + 10 + 11 + 12 + 13) :
49100 |
212.554,00 |
262.915,00 |
487.434,00 |
181.734,00 |
150.886,00 |
|
|
14. Financial income : 41400 |
96,00 |
81,00 |
331,00 |
1.987,00 |
4.451,00 |
|
|
a) Allocation of financial subsidies,
donations and legacies: 41430 |
0,00 |
0,00 |
0,00 |
0,00 |
0,00 |
|
|
b) Other financial income: 41490 |
96,00 |
81,00 |
331,00 |
1.987,00 |
4.451,00 |
|
|
15. Financial expenditure: 41500 |
-59.718,00 |
-58.445,00 |
-78.818,00 |
-97.560,00 |
-111.244,00 |
|
|
16. Changes in fair value of financial instruments :
41600 |
0,00 |
0,00 |
0,00 |
0,00 |
0,00 |
|
|
17. Exchange rate differences : 41700 |
-253,00 |
0,00 |
0,00 |
0,00 |
0,00 |
|
|
18. Impairment and result for transfers of financial
instruments: 41800 |
0,00 |
0,00 |
0,00 |
0,00 |
0,00 |
|
|
19. Other financial income and expenditure: 42100 |
0,00 |
0,00 |
0,00 |
0,00 |
0,00 |
|
|
a) Incorporation of financial expenditure
to assets: 42110 |
0,00 |
0,00 |
0,00 |
0,00 |
0,00 |
|
|
b) Financial income from arrangement with
creditors: 42120 |
0,00 |
0,00 |
0,00 |
0,00 |
0,00 |
|
|
c) Other income and expenditure:
42130 |
0,00 |
0,00 |
0,00 |
0,00 |
0,00 |
|
|
B)
FINANCIAL REVENUE (14 + 15 + 16 + 17 + 18 + 19) : 49200 |
-59.875,00 |
-58.364,00 |
-78.488,00 |
-95.573,00 |
-106.793,00 |
|
|
C)
NET RESULT BEFORE TAXES (A + B) : 49300 |
152.678,00 |
204.551,00 |
408.947,00 |
86.162,00 |
44.093,00 |
|
|
20. Income taxes: 41900 |
-38.170,00 |
-51.138,00 |
-107.684,00 |
-21.540,00 |
-11.023,00 |
|
|
D)
RESULT OF THE PERIOD (C + 20) : 49500 |
114.509,00 |
153.413,00 |
301.263,00 |
64.621,00 |
33.070,00 |
|
>
Normal Balance Sheet under the rules of the 1990 General Accounting Plan
(repealed since 1st January of 2008)
Information corresponding to the fiscal year 2013 2012 2011 2010 2009 has been compiled based on the equivalence criteria stipulated in Act JUS/206/2009. Where the provisions of the Act did not establish relevant equivalence criteria.
|
|
EQUIVALENCIA |
EQUIVALENCIA |
EQUIVALENCIA |
EQUIVALENCIA |
EQUIVALENCIA |
|
|
ASSETS |
2013 |
2012 |
2011 |
2010 |
2009 |
|
|
A)
SHAREHOLDERS (PARTNERS) BY UNCALLED SUSCRIBED CAPITAL: |
0,00 |
0,00 |
0,00 |
0,00 |
0,00 |
|
|
B)
FIXED ASSETS: |
253.566,00 |
279.440,00 |
314.640,00 |
397.344,00 |
492.092,00 |
|
|
I. Formation expenses: |
0,00 |
0,00 |
0,00 |
0,00 |
0,00 |
|
|
II. Intangible fixed assets: |
34.808,00 |
9.229,00 |
27.845,00 |
49.195,00 |
71.878,00 |
|
|
III. Tangible fixed assets: |
206.668,00 |
258.121,00 |
274.706,00 |
336.060,00 |
405.802,00 |
|
|
IV. Financial investments: |
12.090,00 |
12.090,00 |
12.090,00 |
12.090,00 |
14.412,00 |
|
|
V. Own shares: |
0,00 |
0,00 |
0,00 |
0,00 |
0,00 |
|
|
VI. Long-term trade receivables: |
0,00 |
0,00 |
0,00 |
0,00 |
0,00 |
|
|
C)
Deferred expenses: |
0,00 |
0,00 |
0,00 |
0,00 |
0,00 |
|
|
D)
CURRENT ASSETS: |
2.317.439,00 |
2.746.517,00 |
3.207.968,00 |
2.577.090,00 |
2.546.080,00 |
|
|
I. Called-up share capital (not paid): |
0,00 |
0,00 |
0,00 |
0,00 |
0,00 |
|
|
II. Stocks: |
1.690.136,00 |
1.818.097,00 |
1.830.329,00 |
1.602.717,00 |
1.468.538,00 |
|
|
III. Debtors: |
622.891,00 |
509.370,00 |
696.037,00 |
570.992,00 |
593.619,00 |
|
|
IV. Short-term investments: |
0,00 |
0,00 |
0,00 |
0,00 |
39.487,00 |
|
|
V. Short-term treasury shares: |
0,00 |
0,00 |
0,00 |
0,00 |
0,00 |
|
|
VI. Cash at bank and in hand: |
4.411,00 |
419.050,00 |
681.601,00 |
403.381,00 |
444.435,00 |
|
|
VII. Prepayments and accrued income: |
0,00 |
0,00 |
0,00 |
0,00 |
0,00 |
|
|
GENERAL
TOTAL (A + B + C + D): |
2.571.005,00 |
3.025.957,00 |
3.522.608,00 |
2.974.434,00 |
3.038.172,00 |
|
MERCANTILE
REGISTRY.
|
|
EQUIVALENCIA |
EQUIVALENCIA |
EQUIVALENCIA |
EQUIVALENCIA |
EQUIVALENCIA |
|
|
LIABILITIES |
2013 |
2012 |
2011 |
2010 |
2009 |
|
|
A)
EQUITY: |
1.238.903,00 |
1.200.189,00 |
1.182.360,00 |
901.038,00 |
836.416,00 |
|
|
I. Subscribed capital: |
90.152,00 |
90.152,00 |
90.152,00 |
90.152,00 |
90.152,00 |
|
|
II. Share premium: |
0,00 |
0,00 |
0,00 |
0,00 |
0,00 |
|
|
III. Revaluation reserves: |
0,00 |
0,00 |
0,00 |
0,00 |
0,00 |
|
|
IV. Reserves: |
1.034.243,00 |
956.624,00 |
790.945,00 |
746.264,00 |
713.195,00 |
|
|
a) Differences for capital adjustment to
euros: |
0,00 |
0,00 |
0,00 |
0,00 |
0,00 |
|
|
b) Remaining Reserves: |
1.034.243,00 |
956.624,00 |
790.945,00 |
746.264,00 |
713.195,00 |
|
|
V. Profit or loss brought forward: |
0,00 |
0,00 |
0,00 |
0,00 |
0,00 |
|
|
VI. Profit or loss for the financial year: |
114.509,00 |
153.413,00 |
301.263,00 |
64.621,00 |
33.070,00 |
|
|
VII. Interim dividend paid: |
0,00 |
0,00 |
0,00 |
0,00 |
0,00 |
|
|
VIII. Own shares for capital reduction: |
0,00 |
0,00 |
0,00 |
0,00 |
0,00 |
|
|
B)
Deferred income: |
0,00 |
0,00 |
3.000,00 |
6.000,00 |
9.000,00 |
|
|
C)
PROVISIONS FOR LIABILITIES AND CHARGES: |
0,00 |
0,00 |
0,00 |
0,00 |
0,00 |
|
|
D)
LONG TERM LIABILITIES: |
4.313,00 |
20.947,00 |
17.874,00 |
43.485,00 |
74.581,00 |
|
|
E)
SHORT TERM CREDITORS: |
1.327.789,00 |
1.804.821,00 |
2.319.375,00 |
2.023.911,00 |
2.118.174,00 |
|
|
F)
SHORT-TERM PROVISIONS FOR LIABILITIES AND CHARGES: |
0,00 |
0,00 |
0,00 |
0,00 |
0,00 |
|
|
GENERAL
TOTAL (A + B + C + D + E + F): |
2.571.005,00 |
3.025.957,00 |
3.522.608,00 |
2.974.434,00 |
3.038.172,00 |
|
MERCANTILE
REGISTRY.
|
|
EQUIVALENCIA |
EQUIVALENCIA |
EQUIVALENCIA |
EQUIVALENCIA |
EQUIVALENCIA |
|
|
DEBIT |
2013 |
2012 |
2011 |
2010 |
2009 |
|
|
A)
CHARGES (A.1 to A.15): |
3.764.103,00 |
3.358.677,00 |
3.881.092,00 |
3.512.193,00 |
3.620.393,00 |
|
|
A.1. Operating consumption: |
2.671.741,00 |
2.280.717,00 |
2.724.683,00 |
2.297.265,00 |
2.345.419,00 |
|
|
A.2. Staff Costs: |
533.724,00 |
529.435,00 |
498.935,00 |
500.654,00 |
543.660,00 |
|
|
a) Wages, salaries et
al.: |
443.508,00 |
439.944,00 |
414.599,00 |
416.028,00 |
451.764,00 |
|
|
b) Social security
costs: |
90.216,00 |
89.491,00 |
84.336,00 |
84.626,00 |
91.895,00 |
|
|
A.3. Depreciation expense: |
70.631,00 |
96.511,00 |
94.950,00 |
100.178,00 |
107.137,00 |
|
|
A.4. Variation of trade provisions and
losses of unrecovered receivables: |
0,00 |
0,00 |
0,00 |
0,00 |
0,00 |
|
|
A.5. Other operating charges: |
389.752,00 |
339.431,00 |
376.022,00 |
494.996,00 |
501.910,00 |
|
|
A.I. OPERATING BENEFITS (B.1-A.1-A.2-A.3-A.4-A.5): |
212.669,00 |
262.619,00 |
478.514,00 |
178.734,00 |
147.886,00 |
|
|
A.6. Financial and similar charges: |
59.718,00 |
58.445,00 |
78.818,00 |
97.560,00 |
111.244,00 |
|
|
a) Due to liabilities
with companies of the group: |
0,00 |
0,00 |
0,00 |
0,00 |
0,00 |
|
|
b) Due to liabilities
with associated companies: |
0,00 |
0,00 |
0,00 |
0,00 |
0,00 |
|
|
c) Due to other
debts: |
59.718,00 |
58.445,00 |
78.818,00 |
97.560,00 |
111.244,00 |
|
|
d) Losses from
financial investments: |
0,00 |
0,00 |
0,00 |
0,00 |
0,00 |
|
|
A.7. Financial investment provision change:
|
0,00 |
0,00 |
0,00 |
0,00 |
0,00 |
|
|
A.8. Exchange losses: |
253,00 |
0,00 |
0,00 |
0,00 |
0,00 |
|
|
A.II. POSITIVE FINANCIAL RESULTS (B.2+B.3-A.6-A.7-A.8): |
0,00 |
0,00 |
0,00 |
0,00 |
0,00 |
|
|
A.III. PROFIT FROM ORDINARY ACTIVITIES (A.I+A.II-B.I-B.II):
|
152.793,00 |
204.255,00 |
400.026,00 |
83.162,00 |
41.093,00 |
|
|
A.9. Changes in provisions for intangible,
tangible and securities portfolio: |
0,00 |
0,00 |
0,00 |
0,00 |
0,00 |
|
|
A.10. Losses from tangible and intangible
fixed assets and portfolio: |
115,00 |
0,00 |
0,00 |
0,00 |
0,00 |
|
|
A.11. Losses from transactions with own
shares and debentures: |
0,00 |
0,00 |
0,00 |
0,00 |
0,00 |
|
|
A.12. Extraordinary expenses: |
0,00 |
3.000,00 |
0,00 |
0,00 |
0,00 |
|
|
A.13. Prior year expenses and losses:
|
0,00 |
0,00 |
0,00 |
0,00 |
0,00 |
|
|
A.IV. EXTRAORDINARY PROFIT
(B.4+B.5+B.6+B.7+B.8-A.9-A.10-A.11-A.12-A.13): |
0,00 |
296,00 |
8.920,00 |
3.000,00 |
3.000,00 |
|
|
A.V. PROFIT BEFORE TAXES (A.III+A.IV-B.III-B.IV): |
152.678,00 |
204.551,00 |
408.947,00 |
86.162,00 |
44.093,00 |
|
|
A.14. Corporation Tax: |
38.170,00 |
51.138,00 |
107.684,00 |
21.540,00 |
11.023,00 |
|
|
A.15. Miscellaneous taxes: |
0,00 |
0,00 |
0,00 |
0,00 |
0,00 |
|
|
A.VI. FINANCIAL YEAR RESULT (PROFIT) (A.V-A.14-A.15): |
114.509,00 |
153.413,00 |
301.263,00 |
64.621,00 |
33.070,00 |
|
MERCANTILE
REGISTRY.
|
|
EQUIVALENCIA |
EQUIVALENCIA |
EQUIVALENCIA |
EQUIVALENCIA |
EQUIVALENCIA |
|
|
CREDIT |
2013 |
2012 |
2011 |
2010 |
2009 |
|
|
B)
INCOME ( B.1 to B.8): |
3.878.612,00 |
3.512.090,00 |
4.182.355,00 |
3.576.814,00 |
3.653.462,00 |
|
|
B.1. Operating income: |
3.878.516,00 |
3.508.713,00 |
4.173.104,00 |
3.571.827,00 |
3.646.011,00 |
|
|
a) Net total sales:
|
3.799.167,00 |
3.429.087,00 |
4.082.681,00 |
3.476.902,00 |
3.562.625,00 |
|
|
b) Miscellaneous
operating income: |
79.350,00 |
79.625,00 |
90.423,00 |
94.925,00 |
83.387,00 |
|
|
B.I. PÉRDIDAS DE EXPLOTACIÓN (A.1+A.2+A.3+A.4+A.5-B.1 ): |
0,00 |
0,00 |
0,00 |
0,00 |
0,00 |
|
|
B.2. Financial income: |
96,00 |
81,00 |
331,00 |
1.987,00 |
4.451,00 |
|
|
a) Companies of the
group: |
0,00 |
0,00 |
0,00 |
0,00 |
0,00 |
|
|
b) In associated
companies: |
0,00 |
0,00 |
0,00 |
0,00 |
0,00 |
|
|
c) Miscellaneous:
|
96,00 |
81,00 |
331,00 |
1.987,00 |
4.451,00 |
|
|
d) Profit on
financial investment: |
0,00 |
0,00 |
0,00 |
0,00 |
0,00 |
|
|
B.3. Exchange gains: |
0,00 |
0,00 |
0,00 |
0,00 |
0,00 |
|
|
B.II. NEGATIVE FINANCIAL RESULTS (A.6+A.7+A.8-B.2-B.3): |
59.875,00 |
58.364,00 |
78.488,00 |
95.573,00 |
106.793,00 |
|
|
B.III. LOSSES ON ORDINARY ACTIVITIES ( B.I + B.II - A.I - A.II
): |
0,00 |
0,00 |
0,00 |
0,00 |
0,00 |
|
|
B.4. Profit on disposal of both tangible
and intangible fixed assets and securities portfolio: |
0,00 |
296,00 |
5.920,00 |
0,00 |
0,00 |
|
|
B.5. Profit on transactions with own
shares and debentures: |
0,00 |
0,00 |
0,00 |
0,00 |
0,00 |
|
|
B.6. Capital grants transferred to profit
and loss: |
0,00 |
3.000,00 |
3.000,00 |
3.000,00 |
3.000,00 |
|
|
B.7. Extraordinary income: |
0,00 |
0,00 |
0,00 |
0,00 |
0,00 |
|
|
B.8. Income and profit of former financial
years: |
0,00 |
0,00 |
0,00 |
0,00 |
0,00 |
|
|
B.IV. NEGATIVE EXTRAORDINARY RESULTS
(A.9+A.10+A.11+A.12+A.13-B.4-B.5-B.6-B.7-B.8): |
115,00 |
0,00 |
0,00 |
0,00 |
0,00 |
|
|
B.V. LOSSES BEFORE TAXES (B.III+B.IV-A.III-A.IV): |
0,00 |
0,00 |
0,00 |
0,00 |
0,00 |
|
|
B.VI. FINANCIAL YEAR RESULTS (LOSSES) (B.V+A.14+A.15): |
0,00 |
0,00 |
0,00 |
0,00 |
0,00 |
|
MERCANTILE
REGISTRY.
CASHFLOW STATEMENT
Model: Normal
>
Source of information: Data contained in this section is taken from the
information declared in the Annual Accounts submitted to the Trade Register.
|
|
2013 |
2012 |
2011 |
2010 |
2009 |
|
|
1.
Fiscal year result before taxes.: 61100 |
152.678,00 |
204.551,00 |
408.947,00 |
86.162,00 |
44.093,00 |
|
|
2.
Results adjustments.: 61200 |
130.254,00 |
154.874,00 |
173.437,00 |
195.751,00 |
213.930,00 |
|
|
a) Fixed Assets Amortization (+).: 61201 |
70.631,00 |
96.511,00 |
94.950,00 |
100.178,00 |
107.137,00 |
|
|
g) Financial income (-).: 61207 |
-96,00 |
-81,00 |
-331,00 |
-1.987,00 |
-4.451,00 |
|
|
h) Financial Expenses (+). : 61208 |
59.718,00 |
58.445,00 |
78.818,00 |
97.560,00 |
111.244,00 |
|
|
3.
Changes in current capital equity.: 61300 |
210.089,00 |
-238.302,00 |
-261.869,00 |
-50.335,00 |
627.154,00 |
|
|
a) Stock (+/-).: 61301 |
127.961,00 |
12.233,00 |
-227.613,00 |
-134.178,00 |
857.058,00 |
|
|
d) Debtors and other accounts receivable (+/-). : 61302 |
-113.521,00 |
186.667,00 |
-125.045,00 |
22.627,00 |
102.856,00 |
|
|
c) Other current assets (+/-). : 61303 |
0,00 |
0,00 |
0,00 |
39.487,00 |
31.608,00 |
|
|
d) Creditors and other accounts payable (+/-). : 61304 |
195.650,00 |
-437.202,00 |
90.789,00 |
21.730,00 |
-364.367,00 |
|
|
4.
Other cash flows for operating activities.: 61400 |
-59.623,00 |
-58.364,00 |
-78.488,00 |
-95.573,00 |
-106.793,00 |
|
|
a) Interest payments (-). : 61401 |
-59.718,00 |
-58.445,00 |
-78.818,00 |
-97.560,00 |
-111.244,00 |
|
|
c) Interest collection (+). : 61403 |
96,00 |
81,00 |
331,00 |
1.987,00 |
4.451,00 |
|
|
5.
Operating activity cash flows (1 + 2 + 3 + 4) : 61500 |
433.399,00 |
62.760,00 |
242.028,00 |
136.005,00 |
778.384,00 |
|
|
6.
Payments for investment (-).: 62100 |
-25.579,00 |
0,00 |
0,00 |
0,00 |
-10.681,00 |
|
|
b) Intangible fixed assets. : 62102 |
-25.579,00 |
0,00 |
0,00 |
0,00 |
0,00 |
|
|
c) Fixed assets. : 62103 |
0,00 |
0,00 |
0,00 |
0,00 |
-10.681,00 |
|
|
7.
Divestment payment collection (+). : 62200 |
51.453,00 |
35.200,00 |
82.704,00 |
94.748,00 |
33.022,00 |
|
|
b) Intangible fixed assets. : 62202 |
0,00 |
18.616,00 |
21.350,00 |
22.683,00 |
30.022,00 |
|
|
c) Fixed assets. : 62203 |
51.453,00 |
16.584,00 |
61.354,00 |
69.742,00 |
0,00 |
|
|
e) Other financial assets. : 62205 |
0,00 |
0,00 |
0,00 |
2.323,00 |
3.000,00 |
|
|
8.
Investment activity cash flows (6 + 7) minus Amortization: 62300 |
-44.757,00 |
-61.310,00 |
-12.246,00 |
-5.430,00 |
-84.796,00 |
|
|
9.
Payment collection and payments for equity instruments. : 63100 |
-75.795,00 |
-138.584,00 |
-22.941,00 |
-3.000,00 |
-77.166,00 |
|
|
b) Amortization of assets instruments (-). : 63102 |
-75.795,00 |
-135.584,00 |
-19.941,00 |
0,00 |
-74.166,00 |
|
|
e) Grants, donations and bequests received (+). : 63105 |
0,00 |
-3.000,00 |
-3.000,00 |
-3.000,00 |
-3.000,00 |
|
|
10.
Payment collection and payments for financial liabilities instruments.:
63200 |
-727.486,00 |
-125.416,00 |
71.379,00 |
-168.628,00 |
-392.284,00 |
|
|
a) Issuance : 63201 |
0,00 |
116.752,00 |
158.899,00 |
54.020,00 |
1.923,00 |
|
|
2. Debts incurred with credit institutions (+). : 63203 |
0,00 |
20.947,00 |
158.899,00 |
0,00 |
0,00 |
|
|
4. Special characteristic debts (+). : 63205 |
0,00 |
0,00 |
0,00 |
0,00 |
1.923,00 |
|
|
5. Other debts (+). : 63206 |
0,00 |
95.805,00 |
0,00 |
54.020,00 |
0,00 |
|
|
b) Repayment and amortization of : 63207 |
-727.486,00 |
-242.168,00 |
-87.520,00 |
-222.648,00 |
-394.207,00 |
|
|
2. Debts incurred with credit institutions (-).: 63209 |
-630.022,00 |
-216.615,00 |
0,00 |
-179.768,00 |
-392.894,00 |
|
|
4. Special characteristic debts (-). : 63211 |
-17.807,00 |
-25.554,00 |
-31.179,00 |
-42.880,00 |
0,00 |
|
|
5. Other debts (-). : 63212 |
-79.657,00 |
0,00 |
-56.341,00 |
0,00 |
-1.313,00 |
|
|
11.
Payments from dividends and remunerations from other assets instruments. :
63300 |
0,00 |
0,00 |
0,00 |
0,00 |
0,00 |
|
|
12.
Cash flows for financing activities (9+10+11).: 63400 |
-803.281,00 |
-264.000,00 |
48.438,00 |
-171.628,00 |
-469.449,00 |
|
|
D)
EFFECT OF EXCHANGE RATE CHANGES: 64000 |
0,00 |
0,00 |
0,00 |
0,00 |
0,00 |
|
|
E)
NET INCREASE/DECREASE OF CASH OR EQUIVALENT ASSETS (+/-5+/-8+/12+/-D) :
65000 |
-414.639,00 |
-262.551,00 |
278.220,00 |
-41.054,00 |
224.139,00 |
|
|
Cash or equivalent assets as of beginning of the fiscal year.:
65100 |
419.050,00 |
681.601,00 |
403.381,00 |
444.435,00 |
220.296,00 |
|
|
Cash or equivalent assets as of end of the fiscal year.:
65200 |
4.411,00 |
419.050,00 |
681.601,00 |
403.381,00 |
444.435,00 |
|
FINANCIAL DIAGNOSIS
> Economic-Financial Comparative Analysis
Data used in the following ratios and indicators is taken from the
Annual Accounts submitted by the company to the TRADE REGISTER.
>
Comparison within the Sector
|
Cash
Flow |
2013 |
2012 |
Variación
2013 - 2012 |
|
|||
|
|
Empresa |
Sector |
Empresa |
Sector |
Empresa |
Sector |
|
|
Cash
Flow over Sales: |
-0,11
% |
0,00
% |
-0,08
% |
0,17
% |
-42,54
% |
-102,48
% |
|
|
EBITDA
over Sales: |
7,46
% |
5,70
% |
10,47
% |
7,58
% |
-28,80
% |
-24,77
% |
|
|
Cash
Flow Yield: |
-0,16
% |
0,00
% |
-0,09
% |
0,04
% |
-85,87
% |
-102,97
% |
|
|
Profitability |
2013 |
2012 |
Variación
2013 - 2012 |
|
|||
|
|
Empresa |
Sector |
Empresa |
Sector |
Empresa |
Sector |
|
|
Operating
economic profitability: |
8,31
% |
-0,16
% |
8,82
% |
0,51
% |
-5,86
% |
-131,88
% |
|
|
Total
economic profitability: |
8,26
% |
0,16
% |
8,69
% |
-0,03
% |
-4,95
% |
692,22
% |
|
|
Financial
profitability: |
9,24
% |
-2,74
% |
12,78
% |
-3,94
% |
-27,69
% |
30,56
% |
|
|
Margin:
|
5,48
% |
-0,29
% |
7,58
% |
0,94
% |
-27,69
% |
-130,84
% |
|
|
Mark-up:
|
3,94
% |
-5,06
% |
5,92
% |
-6,14
% |
-33,45
% |
17,56
% |
|
|
Solvency |
2013 |
2012 |
Variación
2013 - 2012 |
|
|||
|
|
Empresa |
Sector |
Empresa |
Sector |
Empresa |
Sector |
|
|
Liquidity:
|
0,00 |
0,15 |
0,23 |
0,16 |
-98,57 |
-4,78 |
|
|
Acid
Test: |
0,47 |
0,91 |
0,51 |
0,86 |
-8,16 |
5,24 |
|
|
Working
Capital / Investment: |
0,38 |
0,09 |
0,31 |
0,08 |
23,69 |
7,49 |
|
|
Solvency:
|
1,75 |
1,40 |
1,52 |
1,43 |
14,69 |
-1,77 |
|
|
Indebtedness |
2013 |
2012 |
Variación
2013 - 2012 |
|
|||
|
|
Empresa |
Sector |
Empresa |
Sector |
Empresa |
Sector |
|
|
Indebtedness
level: |
1,08 |
1,08 |
1,52 |
1,07 |
-29,32 |
0,79 |
|
|
Borrowing
Composition: |
0,00 |
0,98 |
0,01 |
1,22 |
-72,01 |
-19,67 |
|
|
Repayment
Ability: |
-3,21 |
-479,03 |
-6,95 |
14,17 |
53,80 |
-3.480,76 |
|
|
Warranty:
|
1,93 |
1,93 |
1,66 |
1,94 |
16,45 |
-0,34 |
|
|
Generated
resources / Total creditors: |
0,14 |
0,02 |
0,14 |
0,01 |
1,53 |
38,74 |
|
|
Efficiency |
2013 |
2012 |
Variación
2013 - 2012 |
|
|||
|
|
Empresa |
Sector |
Empresa |
Sector |
Empresa |
Sector |
|
|
Productivity:
|
1,53 |
1,26 |
1,68 |
1,30 |
-8,79 |
-3,47 |
|
|
Turnover
of Collection Rights : |
6,23 |
3,68 |
6,89 |
3,64 |
-9,61 |
1,10 |
|
|
Turnover
of Payment Entitlements: |
4,60 |
2,46 |
6,07 |
2,35 |
-24,20 |
4,50 |
|
|
Stock
rotation: |
2,17 |
2,55 |
1,79 |
2,20 |
21,48 |
15,95 |
|
|
Assets
turnover: |
1,52 |
0,56 |
1,16 |
0,55 |
30,19 |
3,37 |
|
|
Borrowing
Cost: |
4,48 |
2,80 |
3,20 |
2,83 |
40,05 |
-0,98 |
|
>
Trend of indicators under the General Accounting Plan of 2007 (2013, 2012,
2011, 2010, 2009)
|
Cash
Flow |
2013 |
2012 |
2011 |
2010 |
2009 |
|
|
Cash
Flow over Sales: |
-0,11
% |
-0,08
% |
0,07
% |
-0,01
% |
0,06
% |
|
|
EBITDA
over Sales: |
7,46
% |
10,47
% |
14,05
% |
8,02
% |
7,16
% |
|
|
Cash
Flow Yield: |
-0,16
% |
-0,09
% |
0,08
% |
-0,01
% |
0,07
% |
|
|
Profitability |
2013 |
2012 |
2011 |
2010 |
2009 |
|
|
Operating
economic profitability: |
8,31
% |
8,82
% |
13,88
% |
6,13
% |
5,06
% |
|
|
Total
economic profitability: |
8,26
% |
8,69
% |
13,85
% |
6,18
% |
5,11
% |
|
|
Financial
profitability: |
9,24
% |
12,78
% |
25,48
% |
7,17
% |
3,95
% |
|
|
Margin:
|
5,48
% |
7,58
% |
11,68
% |
5,09
% |
4,14
% |
|
|
Mark-up:
|
3,94
% |
5,92
% |
9,80
% |
2,41
% |
1,21
% |
|
|
Solvency |
2013 |
2012 |
2011 |
2010 |
2009 |
|
|
Liquidity:
|
0,00 |
0,23 |
0,29 |
0,20 |
0,21 |
|
|
Acid
Test: |
0,47 |
0,51 |
0,59 |
0,48 |
0,51 |
|
|
Working
Capital / Investment: |
0,38 |
0,31 |
0,25 |
0,19 |
0,14 |
|
|
Solvency:
|
1,75 |
1,52 |
1,38 |
1,27 |
1,20 |
|
|
Indebtedness |
2013 |
2012 |
2011 |
2010 |
2009 |
|
|
Indebtedness
level: |
1,08 |
1,52 |
1,97 |
2,28 |
2,59 |
|
|
Borrowing
Composition: |
0,00 |
0,01 |
0,01 |
0,02 |
0,04 |
|
|
Repayment
Ability: |
-3,21 |
-6,95 |
8,40 |
-50,36 |
9,78 |
|
|
Warranty:
|
1,93 |
1,66 |
1,51 |
1,44 |
1,39 |
|
|
Generated
resources / Total creditors: |
0,14 |
0,14 |
0,17 |
0,08 |
0,06 |
|
|
Efficiency |
2013 |
2012 |
2011 |
2010 |
2009 |
|
|
Productivity:
|
1,53 |
1,68 |
2,15 |
1,56 |
1,47 |
|
|
Turnover
of Collection Rights : |
6,23 |
6,89 |
6,00 |
6,26 |
6,14 |
|
|
Turnover
of Payment Entitlements: |
4,60 |
6,07 |
3,79 |
4,51 |
4,94 |
|
|
Stock
rotation: |
2,17 |
1,79 |
2,02 |
2,12 |
2,38 |
|
|
Assets
turnover: |
1,52 |
1,16 |
1,19 |
1,21 |
1,22 |
|
|
Borrowing
Cost: |
4,48 |
3,20 |
3,37 |
4,72 |
5,07 |
|
COMPARATIVE SECTORIAL BALANCE
Sector-based
Comparison under the rules of the New General Accounting Plan.
|
|
Variación
- |
|
|
|
Empresa |
Sector |
|
|
Variación
- |
|
|
|
Empresa |
Sector |
|
|
Variación
- |
|
|
|
Empresa |
Sector |
News
|
Public Tenders and Works Won |
|
|
|
|
No Public Tenders assigned to the name of the company.
Detail of Subsidies appearing in
Balances Memories
|
|
Entity |
ORGANISMO
NO ESPECIFICADO |
|
Status |
CONCEDIDA |
|
Amount
Granted |
3.000,00 |
|
Notes |
El
importe reflejado corresponde al imputado a la cuenta de pérdidas y ganancias,
quedando un saldo pendiente de imputar de 6.000 euros. |
Research Summary
|
|
Company
dedicated to the trade and distribution of agricultural, industrial and
forestry machinery. Its annual sales during the year 2013 increased by 10.79%
over the previous year 2012. |
Sources
|
|
Registry
of Commerce's Official Gazette. Own and external data bases Company
References |
FOREIGN EXCHANGE RATES
|
Currency |
Unit
|
Indian Rupees |
|
US Dollar |
1 |
Rs.63.45 |
|
UK Pound |
1 |
Rs.98.88 |
|
Euro |
1 |
Rs.77.62 |
INFORMATION DETAILS
|
Analysis Done by
: |
SUB |
|
|
|
|
Report Prepared
by : |
MNL |
RATING EXPLANATIONS
|
RATING |
STATUS |
PROPOSED CREDIT LINE |
|
|
>86 |
Aaa |
Possesses an extremely sound financial base with the strongest
capability for timely payment of interest and principal sums |
Unlimited |
|
71-85 |
Aa |
Possesses adequate working capital. No caution needed for credit
transaction. It has above average (strong) capability for payment of interest
and principal sums |
Large |
|
56-70 |
A |
Financial & operational base are regarded healthy. General
unfavourable factors will not cause fatal effect. Satisfactory capability for
payment of interest and principal sums |
Fairly Large |
|
41-55 |
Ba |
Overall operation is considered normal. Capable to meet normal
commitments. |
Satisfactory |
|
26-40 |
B |
Capability to overcome financial difficulties seems comparatively below
average. |
Small |
|
11-25 |
Ca |
Adverse factors are apparent. Repayment of interest and principal sums
in default or expected to be in default upon maturity |
Limited with
full security |
|
<10 |
C |
Absolute credit risk exists. Caution needed to be exercised |
Credit not
recommended |
|
-- |
NB |
New Business |
-- |
This score serves as a reference to assess
SC’s credit risk and to set the amount of credit to be extended. It is
calculated from a composite of weighted scores obtained from each of the major
sections of this report. The assessed factors and their relative weights (as
indicated through %) are as follows:
Financial
condition (40%) Ownership
background (20%) Payment
record (10%)
Credit history
(10%) Market trend (10%) Operational size
(10%)
This report is issued at your request without any
risk and responsibility on the part of MIRA INFORM PRIVATE LIMITED (MIPL)
or its officials.