MIRA INFORM REPORT
|
Report Date : |
24.12.2014 |
IDENTIFICATION DETAILS
|
Name : |
MERKAL CALZADOS SL |
|
|
|
|
Registered Office : |
Calle Pau Claris, Nº 132, 7ª Planta - |
|
|
|
|
Country : |
|
|
|
|
|
Financials (as on) : |
31.12.2013 |
|
|
|
|
Date of Incorporation : |
08.08.2003 |
|
|
|
|
Legal Form : |
Private Company |
|
|
|
|
Line of Business : |
Retail sale of footwear and leather goods in specialised
stores |
|
|
|
|
No. of Employees : |
500 |
RATING & COMMENTS
|
MIRA’s Rating : |
NB |
|
RATING |
STATUS |
PROPOSED CREDIT LINE |
|
|
|
-- |
NB |
New Business |
-- |
|
|
Status : |
New Business |
|
Payment Behaviour : |
Unknown |
|
Litigation : |
Clear |
NOTES :
Any query related to this report can be made
on e-mail : infodept@mirainform.com
while quoting report number, name and date.
ECGC Country Risk Classification List – September 30, 2014
|
Country Name |
Previous Rating (30.06.2014) |
Current Rating (30.09.2014) |
|
|
A2 |
A2 |
|
Risk Category |
ECGC
Classification |
|
Insignificant |
A1 |
|
Low |
A2 |
|
Moderate |
B1 |
|
High |
B2 |
|
Very High |
C1 |
|
Restricted |
C2 |
|
Off-credit |
D |
|
Source
: CIA |
Company name and address
|
Name: |
MERKAL CALZADOS SL |
|
NIF / Fiscal code: |
B63266969 |
|
Trade Name |
MERKAL |
|
Status: |
ACTIVE |
|
Incorporation Date: |
08/08/2003 |
|
Register Data |
Register Section 8 Sheet 267443 |
|
Last Publication in BORME: |
19/05/2014 [Appointments] |
|
Last Published Account Deposit: |
2013 |
|
Share Capital: |
1.901.906 |
|
|
|
|
Localization: |
CALLE |
|
Telephone - Fax - Email - Website: |
Ph.:. 932 697 700�� Email. contactoweb@merkal.com�� Website. www.merkal.com |
|
Number of Branches |
27 |
|
|
|
|
Activity: |
|
|
NACE: |
4772 - Retail sale of footwear and leather goods in specialised stores |
|
Registered Trademarks: |
|
|
Audited / Opinion: |
Si / |
|
Tenders and Awards: |
0 for a total cost of 0 |
|
Subsidies: |
0 for a total cost of 0 |
|
Quality Certificate: |
No |
|
|
|
Defaults, Legal Claims and Insolvency Proceedings
|
|
|
Number |
Amount (€) |
Most Recent Entry |
|
Insolvency Proceedings, Bankruptcy and Suspension of Payments |
|
Unpublished |
--- |
--- |
|
Defaults on debt with Financial Institutions and Large Companies |
|
None |
--- |
--- |
|
Judicial Claims (Notices, Executive Proceedings, Attachments, Auctions, Bad Debt) |
|
None |
0 |
--- |
|
Proceedings heard by the |
|
Unpublished |
0 |
--- |
|
Proceedings heard by the |
|
Unpublished |
0 |
--- |
|
Partners |
|
VIVARTE MODA SA |
100 % |
|
|
Shares: |
1 |
|
|
Other Links: |
3 |
|
|
No. of Active Corporate Bodies: |
CHIEF EXECUTIVE OFFICER 1 |
|
|
Ratios |
2013 |
2012 |
Change |
|
|
Nº of employees: |
500 |
|
|
|
|
|
|
|
Guarantees: |
|
|
Properties Registered: |
Company NO, Administrator NO |
|
Financing / Guarantee Sources : |
Sources NO, Guarantees YES |
INVESTIGATION SUMMARY
|
|
|
The firm was founded in 2003. It has 230 stores in España,
South of France and |
|
|
Interviewed Person: |
|
Identification
|
|
|
Social Denomination: |
MERKAL CALZADOS SL |
|
Trade Name: |
MERKAL |
|
NIF / Fiscal code: |
B63266969 |
|
Corporate Status: |
ACTIVE |
|
Start of activity: |
2003 |
|
Registered Office: |
CALLE PAU CLARIS, Nº 132, 7ª PLANTA |
|
Locality: |
BARCELONA |
|
Province: |
BARCELONA |
|
Postal Code: |
08009 |
|
Telephone: |
932 697 700 |
|
Fax: |
932 697 701 |
|
Website: |
www.merkal.com |
|
Email: |
contactoweb@merkal.com |
|
Interviewed Person: |
La presente información ha sido obtenida a través de fuentes indirectas, ante la negativa por parte de los responsables de la sociedad de prestar cualquier tipo de colaboración para la confección del presente trabajo. |
Branch Offices
|
|
Address |
Postal Code |
City |
Province |
|
AVENI DOCTOR JIMENEZ DIAZ 19 |
03005 |
ALICANTE/ALACANT |
ALICANTE |
|
Vic, 1 |
08550 |
BALENYA |
BARCELONA |
|
Progrés, 14 |
08904 |
HOSPITALET DE LLOBREGAT (L') |
BARCELONA |
|
Santa Eulàlia, 13 |
08902 |
HOSPITALET DE LLOBREGAT (L') |
BARCELONA |
|
Av. Mestre Montaner, 56 |
08700 |
IGUALADA |
BARCELONA |
|
María Aurelia Capmany, S/N |
08243 |
MANRESA |
BARCELONA |
|
Balançó i Boter, S/N |
08302 |
MATARO |
BARCELONA |
|
Santiago Rusiñol, 46 |
08304 |
MATARO |
BARCELONA |
|
Verdi, 2 |
08110 |
MONTCADA I REIXAC |
BARCELONA |
|
Av. Riu Mogent, S/N |
08170 |
MONTORNES DEL VALLES |
BARCELONA |
|
Av. Estatut, 14 |
08191 |
RUBI |
BARCELONA |
|
Ramón Viñas, 29 |
08930 |
SANT ADRIA DE BESOS |
BARCELONA |
|
Navas de Tolosa, 161 |
08224 |
TERRASSA |
BARCELONA |
|
Cayetano Polo (Polito), S/N |
10004 |
CACERES |
CACERES |
|
COSTA VELLA 91 |
15890 |
SANTIAGO DE COMPOSTELA |
LA CORUÑA |
|
Pedro Antonio de Alarcón, 36 |
18002 |
GRANADA |
GRANADA |
|
Secundino Esnaola / Sekundino Esnaola Kalea, 18 |
20001 |
DONOSTIA-SAN SEBASTIAN |
GUIPUZCOA |
|
Av. Torres Quevedo, 1 |
28980 |
PARLA |
MADRID |
|
María Montessori, 1 |
28521 |
RIVAS-VACIAMADRID |
MADRID |
|
Av. Brasilia, 5 |
34004 |
PALENCIA |
PALENCIA |
|
Libertad, S/N |
38296 |
SAN CRISTOBAL DE LA LAGUNA |
SANTA CRUZ DE TENERIFE |
|
Molinos de Gofio (Pol. Ind. San Jerónimo), 2 |
38312 |
OROTAVA (LA) |
SANTA CRUZ DE TENERIFE |
|
Ctra. Santa Bàrbara, KM 1 |
43870 |
AMPOSTA |
TARRAGONA |
|
Sant Isidre, 179 |
43540 |
SANT CARLES DE LA RAPITA |
TARRAGONA |
|
Av. Jaume Carner, 58 |
43700 |
VENDRELL (EL) |
TARRAGONA |
|
Transport (Pol. Ind. Benieto), 7 |
46702 |
GANDIA |
VALENCIA |
|
Francia (Pol. Ind. El Trillar), 9-10 |
50600 |
EJEA DE LOS CABALLEROS |
ZARAGOZA |
Activity
|
|
|
NACE: |
4772 |
|
Additional Information: |
Retail sale of footwear. |
|
Franchise: |
No |
|
Import / export: |
IMPORT / EXPORTS |
|
Future Perspective: |
Consolidation |
|
Industry situation: |
Maturity |
Number of Employees
|
|
|
Year |
No. of employees |
Established |
Incidentals |
|
|
|
2013 |
500 |
|
|
|
Chronological Summary
|
|||
|
|
|
|
|
|
|
Year |
Act |
|
|
|
2003 |
Appointments/ Re-elections (1) Company Formation (1) Declaration of Sole Propietorship (1) Other Concepts/ Events (1) |
|
|
|
2004 |
Accounts deposit (ejer. 2003) Appointments/ Re-elections (4) Cessations/ Resignations/ Reversals (1) Change of Social address (1) Increase of Capital (1) |
|
|
|
2005 |
Accounts deposit (ejer. 2004) Appointments/ Re-elections (1) Cessations/ Resignations/ Reversals (1) |
|
|
|
2006 |
Appointments/ Re-elections (1) |
|
|
|
2007 |
Accounts deposit (ejer. 2005, 2006) Appointments/ Re-elections (2) Cessations/ Resignations/ Reversals (1) |
|
|
|
2008 |
Appointments/ Re-elections (1) Cessations/ Resignations/ Reversals (1) |
|
|
|
2009 |
Accounts deposit (ejer. 2007) Other Concepts/ Events (1) |
|
|
|
2010 |
Accounts deposit (ejer. 2008) Appointments/ Re-elections (1) Cessations/ Resignations/ Reversals (1) |
|
|
|
2011 |
Accounts deposit (ejer. 2009) Appointments/ Re-elections (2) Cessations/ Resignations/ Reversals (2) |
|
|
|
2012 |
Accounts deposit (ejer. 2010) Appointments/ Re-elections (1) Cessations/ Resignations/ Reversals (3) |
|
|
|
2013 |
Accounts deposit (ejer. 2011, 2012) Appointments/ Re-elections (2) Cessations/ Resignations/ Reversals (3) |
|
|
|
2014 |
Accounts deposit (ejer. 2013) Appointments/ Re-elections (2) Cessations/ Resignations/ Reversals (2) |
|
Breakdown of Owners' Equity
|
|
|
Registered Capital: |
1.901.906 |
|
Paid up capital: |
1.901.906 |
|
|
|||||
|
|
|
|
|
|
|
|
|
|||||
|
|
|
|
|
|
|
|
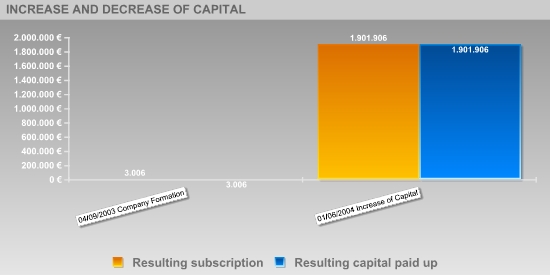
Publishing Date |
Registration Type |
Capital Subscribed |
Paid up capital |
Underwritten result |
Disbursed Result |
|
04/09/2003 |
Company Formation |
3.006 |
3.006 |
3.006 |
3.006 |
|
01/06/2004 |
Increase of Capital |
1.898.900 |
1.898.900 |
1.901.906 |
1.901.906 |
Active Social Bodies
|
|
Post published |
Social Body's Name |
Appointment Date |
Other Positions in this Company |
|
SINGLE PARTNER |
VIVARTE MODA SA |
04/09/2003 |
1 |
|
PRESIDENT |
DORRONSORRO DORRONSORRO JUAN MIGUEL |
20/10/2004 |
3 |
|
MEMBER OF THE BOARD |
DORRONSORRO DORRONSORRO JUAN MIGUEL |
20/10/2004 |
3 |
|
COMBINED PROXY |
ROMANO SANCHEZ SARA |
09/05/2014 |
1 |
|
JOINT ATTORNEY/COMBINED PROXY |
ISASA SARRALDE IÑIGO |
09/05/2014 |
2 |
|
PROXY |
GARRIGA CHABERT DAVID |
22/07/2011 |
1 |
|
|
BLANCO MUNIN FERNANDO |
07/09/2007 |
1 |
|
|
PASCUAL VASCO PATRICIA |
07/09/2007 |
1 |
|
|
RABADAN CANOVAS ANA BELEN |
07/09/2007 |
1 |
|
|
MERCADAL PALOMERA SANTIAGO |
19/05/2004 |
1 |
|
|
GARRAMIOLA PEREIRA CARLOS |
19/05/2004 |
1 |
|
|
CASTELLS BISBAL TERESA |
19/05/2004 |
1 |
|
|
HERMO BARBADILLO EULARI |
19/05/2004 |
1 |
|
|
MORENO ZAFORAS JAVIER |
19/05/2004 |
1 |
|
|
RUIZ BARBERO JENNY |
19/05/2004 |
1 |
|
|
GOMEZ PALLARES JORGE |
19/05/2004 |
1 |
|
|
UGALDE MADARIA RAFAEL |
19/05/2004 |
1 |
|
CHIEF EXECUTIVE OFFICER |
DORRONSORRO DORRONSORRO JUAN MIGUEL |
20/10/2004 |
3 |
|
SECRETARY |
VIVARTE SAS |
22/07/2011 |
2 |
|
REPRESENTATIVE |
PASCALE ANNICK AUDRAN ABDELLI |
28/04/2014 |
1 |
|
|
NICOLA TETI |
19/08/2013 |
1 |
|
ACCOUNTS' AUDITOR / HOLDER |
KPMG AUDITORES SL |
20/08/2010 |
1 |
Historical Social Bodies
|
|
Social Body's Name |
Post published |
End Date |
Other Positions in this Company |
|
ANTOINE METZGER |
REPRESENTATIVE |
22/07/2011 |
2 |
|
|
REPRESENTATIVE |
16/04/2012 |
|
|
ARRASTIO FERNANDEZ VIDAL |
PROXY |
03/08/2005 |
3 |
|
|
PROXY |
22/07/2011 |
|
|
|
PROXY |
22/07/2011 |
|
|
BENOIT LE MONIES DE SAGAZAN |
REPRESENTATIVE |
28/04/2014 |
1 |
|
CASTILLO RODRIGUEZ LUZ |
PROXY |
07/09/2007 |
1 |
|
CHRISTIAN NOUVION |
REPRESENTATIVE |
19/08/2013 |
1 |
|
CLAUDE BUFFARD |
REPRESENTATIVE |
19/08/2013 |
1 |
|
DELOITTE AND TOUCHE ESPAÑA SL |
ACCOUNTS' AUDITOR / HOLDER |
20/08/2010 |
1 |
|
DORRONSORO DORRONSORO JUAN MIGUEL |
PROXY |
03/08/2005 |
1 |
|
EUROPEENNE DE NEGOCE ANDRE SA |
MEMBER OF THE BOARD |
16/06/2008 |
2 |
|
|
SECRETARY |
22/07/2011 |
|
|
FERNANDEZ GARCIA ELENA |
PROXY |
20/02/2014 |
1 |
|
FINANCIERE AGORA SA |
MEMBER OF THE BOARD |
22/07/2011 |
2 |
|
|
SECRETARY |
16/06/2008 |
|
|
ISASA SARRALDE IÑIGO |
PROXY |
09/05/2014 |
2 |
|
JEAN MICHEL NOIR |
REPRESENTATIVE |
22/07/2011 |
1 |
|
LEUNDA DE SOSA AITOR |
PROXY |
03/08/2005 |
3 |
|
|
PROXY |
22/07/2011 |
|
|
|
PROXY |
22/07/2011 |
|
|
MATEO CARO JUAN ANTONIO |
PROXY |
20/02/2014 |
1 |
|
PHILIPPE MALDINI |
PROXY |
19/08/2013 |
1 |
|
RAZQUIN ORBEGOZO RAFAEL |
SINGLE ADMINISTRATOR |
20/10/2004 |
2 |
|
|
PROXY |
22/07/2011 |
|
|
SABATER RAGA CLARA |
PROXY |
22/07/2011 |
3 |
|
|
PROXY |
22/07/2011 |
|
|
|
PROXY |
19/10/2012 |
|
|
SANUY IGLESIAS MARIA ISABEL |
PROXY |
16/04/2012 |
1 |
|
VIVARTE SAS |
MEMBER OF THE BOARD |
22/07/2011 |
2 |
Defaults, Legal Claims and Insolvency Proceedings
|
Section enabling assessment of the degree of compliance of the company queried with its payment obligations. It provides information on the existence and nature of all stages of Insolvency and Legal Proceedings published with reference to the Company in the country's various Official Bulletins and national newspapers, as well Defaults Registered in the main national credit bureaus (ASNEF Industrial and RAI ).
Chronological summary
|
|
|
Number of Publications |
Amount (_) |
Start date |
End date |
|
Insolvency Proceedings, Bankruptcy and Suspension of Payments |
|
Unpublished |
--- |
--- |
--- |
|
Request/Declaration |
|
0 |
--- |
date |
|
|
Proceedings |
|
--- |
--- |
|
--- |
|
Resolution |
|
--- |
--- |
|
--- |
|
Defaults on debt with Financial Institutions and Large Companies |
Bank and Commercial Delinquency |
None |
0 |
|
|
|
Status: Friendly |
|
--- |
|
|
|
|
Status: Pre-Litigation |
|
--- |
|
|
|
|
Status: Litigation |
|
--- |
|
|
|
|
Status: Non-performing |
|
--- |
|
|
|
|
Status: insolvency proceedings, bankruptcy and suspension of payments |
|
--- |
|
|
|
|
Other status |
|
--- |
|
|
|
|
Legal and Administrative Proceedings |
|
Unpublished |
--- |
|
|
|
Notices of defaults and enforcement |
|
--- |
--- |
|
--- |
|
Seizures |
|
--- |
--- |
|
--- |
|
Auctions |
|
--- |
--- |
|
--- |
|
Declarations of insolvency and bad debt |
|
--- |
--- |
|
--- |
|
Proceedings heard by the Civil Court |
|
Unpublished |
--- |
|
|
|
Proceedings heard by the Labour Court |
|
Unpublished |
--- |
|
|
|
Positive Factors |
Adverse Factors |
|
No irregular payment performance has been detected based on information obtained from credit bureaus. It is one of the major domestic companies in terms of sales volume. MERKAL CALZADOS SL 's borrowing cost is appropriate according to its volume of external financing sources. The development of the structure of the debt during the last two years indicates a decrease of the debt with credit institutions and trade creditors in respect to all liabilities. The lower the level of debt, the lower the dependence on suppliers capital and the more guarantee will have its financial situation. Significant operating income. The Company has the necessary return on the investments for its main activity with respect to its assets. This return is lower than that of the financial year 2012 . |
|
Probability of default
|
> Estimated Probability of Default for the next 12 months: 0.245 %
|
Sector in which comparison is carried out: 477 Retail sale of other goods in specialised stores |
|
|
Relative Position:
|
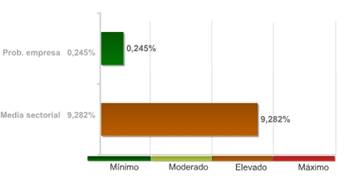
The company's comparative analysis with the rest of the companies that comprise the sector, shows the company holds a better position with regard to the probability of non-compliance.
The 99.00% of the companies of the sector MERKAL CALZADOS SL belongs to show a higher probability of non-compliance.
The probability of the company's non-compliance with its payment obligations within deadlines estimated by our qualifications models is 0.245%.
In the event they fail to comply with the payment, the seriousness of the loss will depend on factors such as the promptness of the commencement of the charging management, the existence of executive documents which match the credit or the existence of guarantees and free debt assets under the name of the debtor. Therefore, the probability of non-compliance should not be solely interpreted as the total loss of the owed amount.
LEGAL CLAIMS
|
|
Summary of Judicial Claims |
|
|
|
|
|
|
|
|
||
|
|
|
No se han publicado |
|
|
|
|
No se han publicado |
|
|
|
|
||
|
|
|
No se han publicado |
|
|
|
|
No se han publicado |
|
|
|
|
No se han publicado |
|
|
|
|
No se han publicado |
|
|
|
|
||
|
|
|
No se han publicado |
|
|
|
Proceedings by the old Civil Procedural Law 1.881 |
No se han publicado |
|
|
PROCEEDINGS BEFORE THE INDUSTRIAL TRIBUNAL |
|
||
|
|
Procedimientos ante Juzgados de lo Social |
No se han publicado |
|
Link List
|
|
BELONGS TO THE ADMINISTRATION BOARD OF: |
1 Entities |
|
IS RELATED WITH: |
1 Entities |
|
PARTICIPATES IN: |
1 Entities |
|
SHAREHOLDERS: |
1 Entities |
|
RESULT OF THE PARTIAL SPIN-OFF OF: |
1 Entities |
> Shareholders
|
Relationship |
Entity |
Province |
Shareholding stake |
|
SHAREHOLDERS |
VIVARTE MODA SA |
BARCELONA |
100 |
|
PARTICIPATES IN |
MKL PORTUGAL LDA |
|
100 |
> Other
relationships
|
Relationship |
Entity |
Province |
Shareholding stake |
|
IS RELATED WITH |
| | |
|
|
|
|
VIVARTE MODA SA |
BARCELONA |
|
|
RESULT OF THE PARTIAL SPIN-OFF OF |
ANBAO DISTRIBUCION SA. |
BARCELONA |
|
|
BELONGS TO THE ADMINISTRATION BOARD OF |
FOSCO ZAPATOS Y ACCESORIOS SA |
BARCELONA |
|
Turnover
|
|
|
Total Sales 2013 |
121.748.000 |
Financial Accounts and Balance Sheets
|
Financial Years Presented
|
Ejercicio |
Tipo de Cuentas Anuales |
Fecha Presentacion |
|
2013 |
Normales |
March 2014 |
|
2012 |
Normales |
October 2013 |
|
2011 |
Normales |
August 2013 |
|
2010 |
Normales |
March 2012 |
|
2009 |
Normales |
July 2011 |
|
2008 |
Normales |
August 2010 |
|
2007 |
Normales |
January 2009 |
|
2006 |
Normales |
August 2007 |
|
2005 |
Normales |
February 2007 |
|
2004 |
Normales |
March 2005 |
|
2003 |
Normales |
February 2004 |
The data in the report regarding the last Company Accounts submitted by the company is taken from the TRADE REGISTER serving the region in which the company's address is located 31/08/2013
> Balance en formato Normal de acuerdo al Nuevo Plan General Contable 2007
Information corresponding to the fiscal year 2013 2012 2011 2010 2009 is taken from information submitted to the TRADE REGISTER. Data corresponding to fiscal years before 2013 2012 2011 2010 2009 has been compiled based on the equivalence criteria stipulated in Act JUS/206/2009. Where the provisions of the Act did not establish relevant equivalence criteria, axesor created such criteria using its own methodology. To view details on the methodology.
|
|
ORIGINAL |
ORIGINAL |
ORIGINAL |
ORIGINAL |
ORIGINAL |
|
|
Assets |
2013 |
2012 |
2011 |
2010 |
2009 |
|
|
A) NON-CURRENT ASSETS: 11000 |
14.223.000,00 |
14.811.000,00 |
18.595.000,00 |
20.975.000,00 |
24.256.000,00 |
|
|
I. Intangible fixed assets : 11100 |
257.000,00 |
390.000,00 |
278.000,00 |
330.000,00 |
273.000,00 |
|
|
1. Development: 11110 |
0,00 |
0,00 |
0,00 |
0,00 |
0,00 |
|
|
2. Concessions: 11120 |
0,00 |
0,00 |
0,00 |
0,00 |
0,00 |
|
|
3. Patents, licencing, trade marks and similar: 11130 |
88.000,00 |
91.000,00 |
58.000,00 |
19.000,00 |
0,00 |
|
|
4. Goodwill: 11140 |
0,00 |
0,00 |
0,00 |
0,00 |
0,00 |
|
|
5. IT applications: 11150 |
99.000,00 |
204.000,00 |
85.000,00 |
146.000,00 |
78.000,00 |
|
|
6. Investigation: 11160 |
0,00 |
0,00 |
0,00 |
0,00 |
0,00 |
|
|
7. Intellectual property: 11180 |
0,00 |
0,00 |
0,00 |
0,00 |
0,00 |
|
|
8. Greenhouse gas emission allowance: 11190 |
0,00 |
0,00 |
0,00 |
0,00 |
0,00 |
|
|
9. Other intangible fixed assets. : 11170 |
70.000,00 |
95.000,00 |
135.000,00 |
165.000,00 |
195.000,00 |
|
|
II. Tangible fixed assets : 11200 |
8.364.000,00 |
10.045.000,00 |
13.024.000,00 |
15.889.000,00 |
18.780.000,00 |
|
|
1. Land and buildings: 11210 |
0,00 |
0,00 |
0,00 |
0,00 |
0,00 |
|
|
2. Technical installations and other tangible fixed assets: 11220 |
8.364.000,00 |
10.045.000,00 |
13.024.000,00 |
15.889.000,00 |
18.780.000,00 |
|
|
3. Tangible asset in progress and advances: 11230 |
0,00 |
0,00 |
0,00 |
0,00 |
0,00 |
|
|
III. Real estate investment: 11300 |
0,00 |
0,00 |
0,00 |
0,00 |
0,00 |
|
|
1. Land: 11310 |
0,00 |
0,00 |
0,00 |
0,00 |
0,00 |
|
|
2. Buildings: 11320 |
0,00 |
0,00 |
0,00 |
0,00 |
0,00 |
|
|
IV. Long-term investments in Group companies and associates : 11400 |
0,00 |
205.000,00 |
205.000,00 |
0,00 |
0,00 |
|
|
1. Equity instruments: 11410 |
0,00 |
205.000,00 |
205.000,00 |
0,00 |
0,00 |
|
|
2. Credits to businesses: 11420 |
0,00 |
0,00 |
0,00 |
0,00 |
0,00 |
|
|
3. Debt securities: 11430 |
0,00 |
0,00 |
0,00 |
0,00 |
0,00 |
|
|
4. Derivatives : 11440 |
0,00 |
0,00 |
0,00 |
0,00 |
0,00 |
|
|
5. Other financial assets : 11450 |
0,00 |
0,00 |
0,00 |
0,00 |
0,00 |
|
|
6. Other investments: 11460 |
0,00 |
0,00 |
0,00 |
0,00 |
0,00 |
|
|
V. Long-term financial investments: 11500 |
2.526.000,00 |
2.656.000,00 |
2.646.000,00 |
2.485.000,00 |
2.349.000,00 |
|
|
1. Equity instruments: 11510 |
0,00 |
0,00 |
0,00 |
0,00 |
0,00 |
|
|
2. Credits to third parties : 11520 |
0,00 |
0,00 |
0,00 |
0,00 |
0,00 |
|
|
3. Debt securities: 11530 |
0,00 |
0,00 |
0,00 |
0,00 |
0,00 |
|
|
4. Derivatives : 11540 |
0,00 |
0,00 |
0,00 |
0,00 |
0,00 |
|
|
5. Other financial assets : 11550 |
2.526.000,00 |
2.656.000,00 |
2.646.000,00 |
2.485.000,00 |
2.349.000,00 |
|
|
6. Other investments: 11560 |
0,00 |
0,00 |
0,00 |
0,00 |
0,00 |
|
|
VI. Assets for deferred tax : 11600 |
3.076.000,00 |
1.515.000,00 |
2.442.000,00 |
2.271.000,00 |
2.854.000,00 |
|
|
VII. Non-current trade debts : 11700 |
0,00 |
0,00 |
0,00 |
0,00 |
0,00 |
|
|
B) CURRENT ASSETS: 12000 |
60.506.000,00 |
58.699.000,00 |
66.487.000,00 |
58.100.000,00 |
47.386.000,00 |
|
|
I. Non-current assets held for sale : 12100 |
0,00 |
0,00 |
0,00 |
0,00 |
0,00 |
|
|
II. Stocks: 12200 |
33.743.000,00 |
35.018.000,00 |
37.006.000,00 |
34.081.000,00 |
32.590.000,00 |
|
|
1. Commercial: 12210 |
33.743.000,00 |
35.018.000,00 |
37.006.000,00 |
34.081.000,00 |
32.590.000,00 |
|
|
2. Primary material and other supplies: 12220 |
0,00 |
0,00 |
0,00 |
0,00 |
0,00 |
|
|
3. Work in progress: 12230 |
0,00 |
0,00 |
0,00 |
0,00 |
0,00 |
|
|
a) Of long-term production cycle : 12231 |
0,00 |
0,00 |
0,00 |
0,00 |
0,00 |
|
|
b) Of short-term production cycle : 12232 |
0,00 |
0,00 |
0,00 |
0,00 |
0,00 |
|
|
4. Finished goods: 12240 |
0,00 |
0,00 |
0,00 |
0,00 |
0,00 |
|
|
a) Of long-term production cycle : 12241 |
0,00 |
0,00 |
0,00 |
0,00 |
0,00 |
|
|
b) Of short-term production cycle : 12242 |
0,00 |
0,00 |
0,00 |
0,00 |
0,00 |
|
|
5. By-products, residues and recycled materials: 12250 |
0,00 |
0,00 |
0,00 |
0,00 |
0,00 |
|
|
6. Advances to suppliers: 12260 |
0,00 |
0,00 |
0,00 |
0,00 |
0,00 |
|
|
III. Trade debtors and others receivable accounts: 12300 |
42.000,00 |
406.000,00 |
622.000,00 |
0,00 |
8.000,00 |
|
|
1. Trade debtors / accounts receivable: 12310 |
0,00 |
0,00 |
0,00 |
0,00 |
0,00 |
|
|
a) Long-term receivables from sales and services supplied : 12311 |
0,00 |
0,00 |
0,00 |
0,00 |
0,00 |
|
|
b) Customers for sales and provisions of services : 12312 |
0,00 |
0,00 |
0,00 |
0,00 |
0,00 |
|
|
2. Customers, Group companies and associates : 12320 |
0,00 |
42.000,00 |
622.000,00 |
0,00 |
0,00 |
|
|
3. Other accounts receivable: 12330 |
37.000,00 |
51.000,00 |
0,00 |
0,00 |
8.000,00 |
|
|
4. Personnel: 12340 |
0,00 |
0,00 |
0,00 |
0,00 |
0,00 |
|
|
5. Assets for deferred tax: 12350 |
0,00 |
0,00 |
0,00 |
0,00 |
0,00 |
|
|
6. Other debtors, including tax and social security: 12360 |
5.000,00 |
313.000,00 |
0,00 |
0,00 |
0,00 |
|
|
7. Called up share capital: 12370 |
0,00 |
0,00 |
0,00 |
0,00 |
0,00 |
|
|
IV. Short-term investments in Group companies and associates: 12400 |
24.032.000,00 |
22.211.000,00 |
27.652.000,00 |
23.181.000,00 |
13.580.000,00 |
|
|
1. Equity instruments: 12410 |
0,00 |
0,00 |
0,00 |
0,00 |
0,00 |
|
|
2. Credits to businesses: 12420 |
24.032.000,00 |
22.211.000,00 |
27.652.000,00 |
23.181.000,00 |
13.580.000,00 |
|
|
3. Debt securities: 12430 |
0,00 |
0,00 |
0,00 |
0,00 |
0,00 |
|
|
4. Derivatives : 12440 |
0,00 |
0,00 |
0,00 |
0,00 |
0,00 |
|
|
5. Other financial assets : 12450 |
0,00 |
0,00 |
0,00 |
0,00 |
0,00 |
|
|
6. Other investments: 12460 |
0,00 |
0,00 |
0,00 |
0,00 |
0,00 |
|
|
V. Short-term financial investments : 12500 |
985.000,00 |
135.000,00 |
0,00 |
0,00 |
0,00 |
|
|
1. Equity instruments: 12510 |
985.000,00 |
0,00 |
0,00 |
0,00 |
0,00 |
|
|
2. Credits to businesses: 12520 |
0,00 |
0,00 |
0,00 |
0,00 |
0,00 |
|
|
3. Debt securities: 12530 |
0,00 |
0,00 |
0,00 |
0,00 |
0,00 |
|
|
4. Derivatives : 12540 |
0,00 |
0,00 |
0,00 |
0,00 |
0,00 |
|
|
5. Other financial assets : 12550 |
0,00 |
135.000,00 |
0,00 |
0,00 |
0,00 |
|
|
6. Other investments: 12560 |
0,00 |
0,00 |
0,00 |
0,00 |
0,00 |
|
|
VI. Short-term accruals: 12600 |
92.000,00 |
35.000,00 |
86.000,00 |
144.000,00 |
95.000,00 |
|
|
VII. Cash and other equivalent liquid assets : 12700 |
1.612.000,00 |
894.000,00 |
1.121.000,00 |
694.000,00 |
1.113.000,00 |
|
|
1. Treasury: 12710 |
1.612.000,00 |
894.000,00 |
1.121.000,00 |
694.000,00 |
1.113.000,00 |
|
|
2. Other equivalent liquid assets: 12720 |
0,00 |
0,00 |
0,00 |
0,00 |
0,00 |
|
|
TOTAL ASSETS (A + B) : 10000 |
74.729.000,00 |
73.510.000,00 |
85.082.000,00 |
79.075.000,00 |
71.642.000,00 |
|
|
|
ORIGINAL |
ORIGINAL |
ORIGINAL |
ORIGINAL |
ORIGINAL |
|
|
Liabilities and Net Worth |
2013 |
2012 |
2011 |
2010 |
2009 |
|
|
A) NET WORTH: 20000 |
36.532.000,00 |
34.200.000,00 |
39.265.000,00 |
34.000.000,00 |
28.655.000,00 |
|
|
A-1) Shareholders' equity: 21000 |
36.532.000,00 |
34.200.000,00 |
39.265.000,00 |
34.000.000,00 |
28.655.000,00 |
|
|
I. Capital: 21100 |
1.902.000,00 |
1.902.000,00 |
1.902.000,00 |
1.902.000,00 |
1.902.000,00 |
|
|
1. Registered capital : 21110 |
1.902.000,00 |
1.902.000,00 |
1.902.000,00 |
1.902.000,00 |
1.902.000,00 |
|
|
2. (Uncalled capital): 21120 |
0,00 |
0,00 |
0,00 |
0,00 |
0,00 |
|
|
II. Share premium: 21200 |
1.793.000,00 |
1.793.000,00 |
1.793.000,00 |
1.793.000,00 |
1.793.000,00 |
|
|
III. Reserves: 21300 |
30.505.000,00 |
27.570.000,00 |
30.305.000,00 |
22.460.000,00 |
17.874.000,00 |
|
|
1. Legal y estatutarias: 21310 |
380.000,00 |
380.000,00 |
380.000,00 |
380.000,00 |
380.000,00 |
|
|
2. Other reserves: 21320 |
30.125.000,00 |
27.190.000,00 |
29.925.000,00 |
22.080.000,00 |
17.494.000,00 |
|
|
3. Revaluation reserves: 21330 |
0,00 |
0,00 |
0,00 |
0,00 |
0,00 |
|
|
IV. (Common stock equity): 21400 |
0,00 |
0,00 |
0,00 |
0,00 |
0,00 |
|
|
V. Results from previous periods: 21500 |
0,00 |
0,00 |
0,00 |
0,00 |
0,00 |
|
|
1. Brought forward: 21510 |
0,00 |
0,00 |
0,00 |
0,00 |
0,00 |
|
|
2. (Negative results from previous periods): 21520 |
0,00 |
0,00 |
0,00 |
0,00 |
0,00 |
|
|
VI. Other shareholders' contributions: 21600 |
0,00 |
0,00 |
0,00 |
0,00 |
0,00 |
|
|
VII. Result of the period: 21700 |
2.332.000,00 |
2.935.000,00 |
5.265.000,00 |
7.845.000,00 |
7.086.000,00 |
|
|
VIII. (Interim dividend): 21800 |
0,00 |
0,00 |
0,00 |
0,00 |
0,00 |
|
|
IX. Other net worth instruments: 21900 |
0,00 |
0,00 |
0,00 |
0,00 |
0,00 |
|
|
A-2) Adjustments due to changes in value: 22000 |
0,00 |
0,00 |
0,00 |
0,00 |
0,00 |
|
|
I. Financial assets held for sale: 22100 |
0,00 |
0,00 |
0,00 |
0,00 |
0,00 |
|
|
II. Hedge operations: 22200 |
0,00 |
0,00 |
0,00 |
0,00 |
0,00 |
|
|
III. Linked non-current assets and liabilities held for sale : 22300 |
0,00 |
0,00 |
0,00 |
0,00 |
0,00 |
|
|
IV. Exchange rate difference: 22400 |
0,00 |
0,00 |
0,00 |
0,00 |
0,00 |
|
|
V. Other: 22500 |
0,00 |
0,00 |
0,00 |
0,00 |
0,00 |
|
|
A-3) Received subsidies, donations and legacies: 23000 |
0,00 |
0,00 |
0,00 |
0,00 |
0,00 |
|
|
B) NON-CURRENT LIABILITIES: 31000 |
779.000,00 |
754.000,00 |
242.000,00 |
214.000,00 |
33.000,00 |
|
|
I. Long-term provisions: 31100 |
777.000,00 |
752.000,00 |
240.000,00 |
212.000,00 |
31.000,00 |
|
|
1. Long-term employee benefits liability: 31110 |
126.000,00 |
101.000,00 |
40.000,00 |
32.000,00 |
31.000,00 |
|
|
2. Environmental actions: 31120 |
0,00 |
0,00 |
0,00 |
0,00 |
0,00 |
|
|
3. Restructuring provisions: 31130 |
0,00 |
0,00 |
20.000,00 |
0,00 |
0,00 |
|
|
4. Other provisions: 31140 |
651.000,00 |
651.000,00 |
180.000,00 |
180.000,00 |
0,00 |
|
|
II Long-term creditors: 31200 |
2.000,00 |
2.000,00 |
2.000,00 |
2.000,00 |
2.000,00 |
|
|
1. Liabilities and other securities: 31210 |
0,00 |
0,00 |
0,00 |
0,00 |
0,00 |
|
|
2. Amounts owed to credit institutions: 31220 |
0,00 |
0,00 |
0,00 |
0,00 |
0,00 |
|
|
3. Creditors from financial leasing: 31230 |
0,00 |
0,00 |
0,00 |
0,00 |
0,00 |
|
|
4. Derivatives : 31240 |
0,00 |
0,00 |
0,00 |
0,00 |
0,00 |
|
|
5. Other financial liabilities : 31250 |
2.000,00 |
2.000,00 |
2.000,00 |
2.000,00 |
2.000,00 |
|
|
III. Long-term debts with Group companies and associates: 31300 |
0,00 |
0,00 |
0,00 |
0,00 |
0,00 |
|
|
IV. Liabilities for deferred tax: 31400 |
0,00 |
0,00 |
0,00 |
0,00 |
0,00 |
|
|
V. Long-term accruals: 31500 |
0,00 |
0,00 |
0,00 |
0,00 |
0,00 |
|
|
VI. Non-current trade creditors : 31600 |
0,00 |
0,00 |
0,00 |
0,00 |
0,00 |
|
|
VII. Special long-term debts : 31700 |
0,00 |
0,00 |
0,00 |
0,00 |
0,00 |
|
|
C) CURRENT LIABILITIES : 32000 |
37.418.000,00 |
38.556.000,00 |
45.575.000,00 |
44.861.000,00 |
42.954.000,00 |
|
|
I. Liabilities linked to non-current assets held for sale: 32100 |
0,00 |
0,00 |
0,00 |
0,00 |
0,00 |
|
|
II. Short-term provisions: 32200 |
189.000,00 |
241.000,00 |
0,00 |
8.000,00 |
78.000,00 |
|
|
1. Provisions from greenhouse gas emission allowance: 32210 |
0,00 |
0,00 |
0,00 |
0,00 |
0,00 |
|
|
2. Other provisions: 32220 |
0,00 |
0,00 |
0,00 |
0,00 |
0,00 |
|
|
III. Short-term creditors : 32300 |
449.000,00 |
720.000,00 |
1.531.000,00 |
0,00 |
0,00 |
|
|
1. Liabilities and other securities: 32310 |
0,00 |
0,00 |
0,00 |
0,00 |
0,00 |
|
|
2. Amounts owed to credit institutions: 32320 |
0,00 |
0,00 |
0,00 |
0,00 |
0,00 |
|
|
3. Creditors from financial leasing: 32330 |
0,00 |
0,00 |
0,00 |
0,00 |
0,00 |
|
|
4. Derivatives : 32340 |
0,00 |
0,00 |
0,00 |
0,00 |
0,00 |
|
|
5. Other financial liabilities : 32350 |
449.000,00 |
720.000,00 |
1.531.000,00 |
0,00 |
0,00 |
|
|
IV. Short-term debts with Group companies and associates: 32400 |
1.713.000,00 |
3.000,00 |
2.487.000,00 |
1.435.000,00 |
3.010.000,00 |
|
|
V. Trade creditors and other accounts payable: 32500 |
34.942.000,00 |
37.475.000,00 |
41.557.000,00 |
43.418.000,00 |
39.866.000,00 |
|
|
1. Suppliers: 32510 |
14.659.000,00 |
19.938.000,00 |
20.084.000,00 |
22.854.000,00 |
21.901.000,00 |
|
|
a) Long-term debts : 32511 |
0,00 |
0,00 |
0,00 |
0,00 |
0,00 |
|
|
b) Short-term debts : 32512 |
14.659.000,00 |
19.938.000,00 |
20.084.000,00 |
22.854.000,00 |
21.901.000,00 |
|
|
2. Suppliers, Group companies and associates: 32520 |
8.617.000,00 |
8.147.000,00 |
11.507.000,00 |
10.191.000,00 |
9.187.000,00 |
|
|
3. Other creditors: 32530 |
7.451.000,00 |
6.413.000,00 |
6.801.000,00 |
7.914.000,00 |
6.778.000,00 |
|
|
4. Personnel (remuneration due): 32540 |
1.827.000,00 |
1.599.000,00 |
1.157.000,00 |
995.000,00 |
935.000,00 |
|
|
5. Liabilities for current tax: 32550 |
0,00 |
0,00 |
0,00 |
0,00 |
25.000,00 |
|
|
6. Other accounts payable to Public Administrations.: 32560 |
2.388.000,00 |
1.378.000,00 |
2.008.000,00 |
1.464.000,00 |
1.040.000,00 |
|
|
7. Advances from clients: 32570 |
0,00 |
0,00 |
0,00 |
0,00 |
0,00 |
|
|
VI. Short-term accruals: 32600 |
125.000,00 |
117.000,00 |
0,00 |
0,00 |
0,00 |
|
|
VII. Special short-term debts : 32700 |
0,00 |
0,00 |
0,00 |
0,00 |
0,00 |
|
|
TOTAL NET WORTH AND LIABILITIES (A + B + C) : 30000 |
74.729.000,00 |
73.510.000,00 |
85.082.000,00 |
79.075.000,00 |
71.642.000,00 |
|
|
|
ORIGINAL |
ORIGINAL |
ORIGINAL |
ORIGINAL |
ORIGINAL |
|
|
Profit and Loss |
2013 |
2012 |
2011 |
2010 |
2009 |
|
|
1. Net turnover: 40100 |
121.748.000,00 |
125.506.000,00 |
137.078.000,00 |
138.391.000,00 |
133.943.000,00 |
|
|
a) Sales: 40110 |
121.701.000,00 |
125.462.000,00 |
137.078.000,00 |
138.391.000,00 |
133.943.000,00 |
|
|
b) Rendering of services: 40120 |
47.000,00 |
44.000,00 |
0,00 |
0,00 |
0,00 |
|
|
c) Income of financial nature of holding companies: 40130 |
0,00 |
0,00 |
0,00 |
0,00 |
0,00 |
|
|
2. Changes in stocks of finished goods and work in progress: 40200 |
0,00 |
0,00 |
0,00 |
0,00 |
0,00 |
|
|
3. Works carried out by the company for its assets: 40300 |
0,00 |
0,00 |
0,00 |
0,00 |
0,00 |
|
|
4. Supplies : 40400 |
-61.597.000,00 |
-62.576.000,00 |
-69.828.000,00 |
-69.955.000,00 |
-68.379.000,00 |
|
|
a) Stock consumption: 40410 |
-61.666.000,00 |
-61.500.000,00 |
-69.123.000,00 |
-70.110.000,00 |
-67.728.000,00 |
|
|
b) Consumption of raw materials and miscellaneous consumable ones: 40420 |
-395.000,00 |
-598.000,00 |
-473.000,00 |
-484.000,00 |
-431.000,00 |
|
|
c) Works carried out by other companies: 40430 |
0,00 |
0,00 |
-82.000,00 |
-119.000,00 |
-68.000,00 |
|
|
d) Impairment of stock, primary material and other supplies: 40440 |
464.000,00 |
-478.000,00 |
-150.000,00 |
758.000,00 |
-152.000,00 |
|
|
5. Other operating income: 40500 |
0,00 |
0,00 |
0,00 |
0,00 |
0,00 |
|
|
a) Auxiliary income and other from current management: 40510 |
0,00 |
0,00 |
0,00 |
0,00 |
0,00 |
|
|
b) Operation subsidies included in the Period's result: 40520 |
0,00 |
0,00 |
0,00 |
0,00 |
0,00 |
|
|
6. Personnel costs: 40600 |
-20.793.000,00 |
-20.661.000,00 |
-20.727.000,00 |
-19.355.000,00 |
-18.649.000,00 |
|
|
a) Wages, salaries et al.: 40610 |
-15.794.000,00 |
-15.621.000,00 |
-15.718.000,00 |
-14.771.000,00 |
-14.277.000,00 |
|
|
b) Social security costs: 40620 |
-4.999.000,00 |
-5.040.000,00 |
-5.009.000,00 |
-4.584.000,00 |
-4.372.000,00 |
|
|
c) Provisions : 40630 |
0,00 |
0,00 |
0,00 |
0,00 |
0,00 |
|
|
7. Other operating costs: 40700 |
-30.251.000,00 |
-31.427.000,00 |
-31.642.000,00 |
-30.531.000,00 |
-28.706.000,00 |
|
|
a) External services: 40710 |
-29.668.000,00 |
-30.159.000,00 |
-30.966.000,00 |
-29.781.000,00 |
-28.215.000,00 |
|
|
b) Taxes: 40720 |
-621.000,00 |
-584.000,00 |
-687.000,00 |
-564.000,00 |
-471.000,00 |
|
|
c) Losses, impairments and variation in provisions from trade operations : 40730 |
42.000,00 |
-689.000,00 |
-7.000,00 |
-186.000,00 |
-30.000,00 |
|
|
d) Other current management expenditure : 40740 |
-4.000,00 |
5.000,00 |
18.000,00 |
0,00 |
10.000,00 |
|
|
e) Expenses due to greenhouse gas emissions: 40750 |
0,00 |
0,00 |
0,00 |
0,00 |
0,00 |
|
|
8. Amortisation of fixed assets: 40800 |
-4.558.000,00 |
-5.942.000,00 |
-6.951.000,00 |
-7.552.000,00 |
-7.745.000,00 |
|
|
9. Allocation of subsidies of non-financial fixed assets and other: 40900 |
0,00 |
0,00 |
0,00 |
0,00 |
0,00 |
|
|
10. Excess provisions : 41000 |
0,00 |
0,00 |
0,00 |
0,00 |
0,00 |
|
|
11. Impairment and result of transfers of fixed assets: 41100 |
-147.000,00 |
-315.000,00 |
-163.000,00 |
-3.000,00 |
-217.000,00 |
|
|
a) Impairment and losses : 41110 |
-94.000,00 |
-50.000,00 |
0,00 |
0,00 |
0,00 |
|
|
b) Results for transfers and other : 41120 |
-53.000,00 |
-265.000,00 |
-163.000,00 |
-3.000,00 |
-217.000,00 |
|
|
c) Impairment and profit due to disposals of assets of holding companies: 41130 |
0,00 |
0,00 |
0,00 |
0,00 |
0,00 |
|
|
12. Negative difference in combined businesses: 41200 |
0,00 |
0,00 |
0,00 |
0,00 |
0,00 |
|
|
13. Other results : 41300 |
-838.000,00 |
-495.000,00 |
-73.000,00 |
4.000,00 |
54.000,00 |
|
|
A.1) OPERATING INCOME (1 + 2 + 3 + 4 + 5 + 6 + 7 + 8 + 9 + 10 + 11 + 12 + 13) : 49100 |
3.564.000,00 |
4.090.000,00 |
7.694.000,00 |
10.999.000,00 |
10.301.000,00 |
|
|
14. Financial income : 41400 |
12.000,00 |
48.000,00 |
47.000,00 |
43.000,00 |
108.000,00 |
|
|
a) Of shares in equity instruments : 41410 |
0,00 |
0,00 |
0,00 |
0,00 |
0,00 |
|
|
a 1) In Group companies and associates: 41411 |
0,00 |
0,00 |
0,00 |
0,00 |
0,00 |
|
|
a 2) In third parties: 41412 |
0,00 |
0,00 |
0,00 |
0,00 |
0,00 |
|
|
b) From negotiable securities and other financial instruments : 41420 |
12.000,00 |
48.000,00 |
47.000,00 |
43.000,00 |
108.000,00 |
|
|
b 1) From Group companies and associates : 41421 |
11.000,00 |
46.000,00 |
45.000,00 |
41.000,00 |
108.000,00 |
|
|
b 2) From third parties : 41422 |
1.000,00 |
2.000,00 |
2.000,00 |
2.000,00 |
0,00 |
|
|
c) Allocation of financial subsidies, donations and legacies : 41430 |
0,00 |
0,00 |
0,00 |
0,00 |
0,00 |
|
|
15. Financial expenditure: 41500 |
-3.000,00 |
0,00 |
0,00 |
0,00 |
0,00 |
|
|
a) Amounts owed to Group companies and associates : 41510 |
0,00 |
0,00 |
0,00 |
0,00 |
0,00 |
|
|
b) For debts with third parties : 41520 |
-3.000,00 |
0,00 |
0,00 |
0,00 |
0,00 |
|
|
c) Stock renewal : 41530 |
0,00 |
0,00 |
0,00 |
0,00 |
0,00 |
|
|
16. Changes in fair value of financial instruments : 41600 |
0,00 |
0,00 |
0,00 |
0,00 |
0,00 |
|
|
a) Trading book and other : 41610 |
0,00 |
0,00 |
0,00 |
0,00 |
0,00 |
|
|
b) Allocation of financial assets held for sale to the result for the period: 41620 |
0,00 |
0,00 |
0,00 |
0,00 |
0,00 |
|
|
17. Exchange rate differences : 41700 |
0,00 |
-16.000,00 |
-200.000,00 |
-36.000,00 |
-10.000,00 |
|
|
18. Impairment and result for transfers of financial instruments: 41800 |
-205.000,00 |
0,00 |
0,00 |
0,00 |
0,00 |
|
|
a) Impairment and losses : 41810 |
0,00 |
0,00 |
0,00 |
0,00 |
0,00 |
|
|
b) Results for transfers and other : 41820 |
-205.000,00 |
0,00 |
0,00 |
0,00 |
0,00 |
|
|
19. Other financial income and expenditure: 42100 |
0,00 |
0,00 |
0,00 |
0,00 |
0,00 |
|
|
a) Incorporation of financial expenditure to assets: 42110 |
0,00 |
0,00 |
0,00 |
0,00 |
0,00 |
|
|
b) Financial income from arrangement with creditors: 42120 |
0,00 |
0,00 |
0,00 |
0,00 |
0,00 |
|
|
c) Other income and expenditure: 42130 |
0,00 |
0,00 |
0,00 |
0,00 |
0,00 |
|
|
A.2) FINANCIAL REVENUE (14+15+16+17+18+19) : 49200 |
-196.000,00 |
32.000,00 |
-153.000,00 |
7.000,00 |
98.000,00 |
|
|
A.3) NET RESULT BEFORE TAXES (A.1+A.2) : 49300 |
3.368.000,00 |
4.122.000,00 |
7.541.000,00 |
11.006.000,00 |
10.399.000,00 |
|
|
20. Income taxes: 41900 |
-1.036.000,00 |
-1.187.000,00 |
-2.276.000,00 |
-3.161.000,00 |
-3.313.000,00 |
|
|
A.4) PROFIT AFTER TAXES (A.3+20) : 49400 |
2.332.000,00 |
2.935.000,00 |
5.265.000,00 |
7.845.000,00 |
7.086.000,00 |
|
|
21. Result of the year coming from interrupted operations : 42000 |
0,00 |
0,00 |
0,00 |
0,00 |
0,00 |
|
|
A.5) RESULT OF THE PERIOD (A.4+21) : 49500 |
2.332.000,00 |
2.935.000,00 |
5.265.000,00 |
7.845.000,00 |
7.086.000,00 |
|
> Normal Balance Sheet under the rules of the 1990 General Accounting Plan (repealed since 1st January of 2008)
Information corresponding to the fiscal year 2013 2012 2011 2010 2009 has been compiled based on the equivalence criteria stipulated in Act JUS/206/2009. Where the provisions of the Act did not establish relevant equivalence criteria, Axesor created such criteria using its own methodology. To view details on the methodology 2013 2012 2011 2010 2009 is taken from information submitted to the TRADE REGISTER.
|
|
EQUIVALENCIA |
EQUIVALENCIA |
EQUIVALENCIA |
EQUIVALENCIA |
EQUIVALENCIA |
|
|
ASSETS |
2013 |
2012 |
2011 |
2010 |
2009 |
|
|
A) SHAREHOLDERS (PARTNERS) BY UNCALLED SUSCRIBED CAPITAL: |
0,00 |
0,00 |
0,00 |
0,00 |
0,00 |
|
|
B) FIXED ASSETS: |
11.147.000,00 |
13.296.000,00 |
16.153.000,00 |
18.704.000,00 |
21.402.000,00 |
|
|
I. Formation expenses: |
0,00 |
0,00 |
0,00 |
0,00 |
0,00 |
|
|
II. Intangible fixed assets: |
257.000,00 |
390.000,00 |
278.000,00 |
330.000,00 |
273.000,00 |
|
|
1. Research and development costs: |
0,00 |
0,00 |
0,00 |
0,00 |
0,00 |
|
|
2. Concessions, patents, licences, trademarks et al.: |
88.000,00 |
91.000,00 |
58.000,00 |
19.000,00 |
0,00 |
|
|
3. Goodwill: |
0,00 |
0,00 |
0,00 |
0,00 |
0,00 |
|
|
4. Key money paid for premises: |
70.000,00 |
95.000,00 |
135.000,00 |
165.000,00 |
195.000,00 |
|
|
5. Software: |
99.000,00 |
204.000,00 |
85.000,00 |
146.000,00 |
78.000,00 |
|
|
6. Assets under capital leases: |
0,00 |
0,00 |
0,00 |
0,00 |
0,00 |
|
|
7. Payments on account: |
0,00 |
0,00 |
0,00 |
0,00 |
0,00 |
|
|
8. Provisions: |
0,00 |
0,00 |
0,00 |
0,00 |
0,00 |
|
|
9. Accumulated depreciation: |
0,00 |
0,00 |
0,00 |
0,00 |
0,00 |
|
|
III. Tangible fixed assets: |
8.364.000,00 |
10.045.000,00 |
13.024.000,00 |
15.889.000,00 |
18.780.000,00 |
|
|
1. Land and construction: |
0,00 |
0,00 |
0,00 |
0,00 |
0,00 |
|
|
2. Technical installations and machinery: |
0,00 |
0,00 |
0,00 |
0,00 |
0,00 |
|
|
3. Other installations, tools and furniture: |
8.023.505,00 |
9.636.073,00 |
12.493.799,00 |
15.242.166,00 |
18.015.475,00 |
|
|
4. Payments on account and tangible fixed assets under construction: |
0,00 |
0,00 |
0,00 |
0,00 |
0,00 |
|
|
5. Other tangible assets: |
340.495,00 |
408.927,00 |
530.201,00 |
646.834,00 |
764.525,00 |
|
|
6. Provisions: |
0,00 |
0,00 |
0,00 |
0,00 |
0,00 |
|
|
7. Accumulated depreciation: |
0,00 |
0,00 |
0,00 |
0,00 |
0,00 |
|
|
IV. Financial investments: |
2.526.000,00 |
2.861.000,00 |
2.851.000,00 |
2.485.000,00 |
2.349.000,00 |
|
|
1. Equity investments in group companies: |
0,00 |
205.000,00 |
205.000,00 |
0,00 |
0,00 |
|
|
2. Receivables from group companies: |
0,00 |
0,00 |
0,00 |
0,00 |
0,00 |
|
|
3. Equity investment in associated companies: |
0,00 |
0,00 |
0,00 |
0,00 |
0,00 |
|
|
4. Credits to associated companies: |
0,00 |
0,00 |
0,00 |
0,00 |
0,00 |
|
|
5. Long-term securities portfolio: |
0,00 |
0,00 |
0,00 |
0,00 |
0,00 |
|
|
6. Other receivables: |
0,00 |
0,00 |
0,00 |
0,00 |
0,00 |
|
|
7. Long term guarantees and deposits: |
2.526.000,00 |
2.656.000,00 |
2.646.000,00 |
2.485.000,00 |
2.349.000,00 |
|
|
8. Provisions: |
0,00 |
0,00 |
0,00 |
0,00 |
0,00 |
|
|
9. Long-term receivables from public bodies: |
0,00 |
0,00 |
0,00 |
0,00 |
0,00 |
|
|
V. Own shares: |
0,00 |
0,00 |
0,00 |
0,00 |
0,00 |
|
|
VI. Long-term trade receivables: |
0,00 |
0,00 |
0,00 |
0,00 |
0,00 |
|
|
C) Deferred expenses: |
0,00 |
0,00 |
0,00 |
0,00 |
0,00 |
|
|
D) CURRENT ASSETS: |
63.582.000,00 |
60.214.000,00 |
68.929.000,00 |
60.371.000,00 |
50.240.000,00 |
|
|
I. Called-up share capital (not paid): |
0,00 |
0,00 |
0,00 |
0,00 |
0,00 |
|
|
II. Stocks: |
33.743.000,00 |
35.018.000,00 |
37.006.000,00 |
34.081.000,00 |
32.590.000,00 |
|
|
1. Goods for resale: |
33.743.000,00 |
35.018.000,00 |
37.006.000,00 |
34.081.000,00 |
32.590.000,00 |
|
|
2. Raw materials and other consumables: |
0,00 |
0,00 |
0,00 |
0,00 |
0,00 |
|
|
3. Goods in process and semifinished ones: |
0,00 |
0,00 |
0,00 |
0,00 |
0,00 |
|
|
4. Finished products: |
0,00 |
0,00 |
0,00 |
0,00 |
0,00 |
|
|
5. Byproducts, scrap and recovered materials: |
0,00 |
0,00 |
0,00 |
0,00 |
0,00 |
|
|
6. Payments on account: |
0,00 |
0,00 |
0,00 |
0,00 |
0,00 |
|
|
7. Provisions: |
0,00 |
0,00 |
0,00 |
0,00 |
0,00 |
|
|
III. Debtors: |
3.118.000,00 |
1.921.000,00 |
3.064.000,00 |
2.271.000,00 |
2.862.000,00 |
|
|
1. Trade debtors / accounts receivable: |
0,00 |
0,00 |
0,00 |
0,00 |
0,00 |
|
|
2. Accounts receivable, Group companies: |
0,00 |
42.000,00 |
622.000,00 |
0,00 |
0,00 |
|
|
3. Accounts receivable, associated companies: |
0,00 |
0,00 |
0,00 |
0,00 |
0,00 |
|
|
4. Other debtors: |
37.000,00 |
51.000,00 |
0,00 |
0,00 |
8.000,00 |
|
|
5. Staff: |
0,00 |
0,00 |
0,00 |
0,00 |
0,00 |
|
|
6. Public bodies: |
3.081.000,00 |
1.828.000,00 |
2.442.000,00 |
2.271.000,00 |
2.854.000,00 |
|
|
7. Provisions: |
0,00 |
0,00 |
0,00 |
0,00 |
0,00 |
|
|
IV. Short-term investments: |
25.017.000,00 |
22.346.000,00 |
27.652.000,00 |
23.181.000,00 |
13.580.000,00 |
|
|
1. Equity investments in group companies: |
0,00 |
0,00 |
0,00 |
0,00 |
0,00 |
|
|
2. Receivables from group companies: |
24.032.000,00 |
22.211.000,00 |
27.652.000,00 |
23.181.000,00 |
13.580.000,00 |
|
|
3. Equity investment in associated companies: |
0,00 |
0,00 |
0,00 |
0,00 |
0,00 |
|
|
4. Credits to associated companies: |
0,00 |
0,00 |
0,00 |
0,00 |
0,00 |
|
|
5. Short term securities portfolio: |
985.000,00 |
0,00 |
0,00 |
0,00 |
0,00 |
|
|
6. Other receivables: |
0,00 |
0,00 |
0,00 |
0,00 |
0,00 |
|
|
7. Shor term guarantees and deposits: |
0,00 |
135.000,00 |
0,00 |
0,00 |
0,00 |
|
|
8. Provisions: |
0,00 |
0,00 |
0,00 |
0,00 |
0,00 |
|
|
V. Short-term treasury shares: |
0,00 |
0,00 |
0,00 |
0,00 |
0,00 |
|
|
VI. Cash at bank and in hand: |
1.612.000,00 |
894.000,00 |
1.121.000,00 |
694.000,00 |
1.113.000,00 |
|
|
VII. Prepayments and accrued income: |
92.000,00 |
35.000,00 |
86.000,00 |
144.000,00 |
95.000,00 |
|
|
GENERAL TOTAL (A + B + C + D): |
74.729.000,00 |
73.510.000,00 |
85.082.000,00 |
79.075.000,00 |
71.642.000,00 |
|
MERCANTILE REGISTRY.
|
|
EQUIVALENCIA |
EQUIVALENCIA |
EQUIVALENCIA |
EQUIVALENCIA |
EQUIVALENCIA |
|
|
LIABILITIES |
2013 |
2012 |
2011 |
2010 |
2009 |
|
|
A) EQUITY: |
36.532.000,00 |
34.200.000,00 |
39.285.000,00 |
34.000.000,00 |
28.655.000,00 |
|
|
I. Subscribed capital: |
1.902.000,00 |
1.902.000,00 |
1.902.000,00 |
1.902.000,00 |
1.902.000,00 |
|
|
II. Share premium: |
1.793.000,00 |
1.793.000,00 |
1.793.000,00 |
1.793.000,00 |
1.793.000,00 |
|
|
III. Revaluation reserves: |
0,00 |
0,00 |
0,00 |
0,00 |
0,00 |
|
|
IV. Reserves: |
30.505.000,00 |
27.570.000,00 |
30.325.000,00 |
22.460.000,00 |
17.874.000,00 |
|
|
1. Legal reserve: |
380.000,00 |
380.000,00 |
380.000,00 |
380.000,00 |
380.000,00 |
|
|
2. Reserves for own shares: |
0,00 |
0,00 |
0,00 |
0,00 |
0,00 |
|
|
3. Reserves for shares of the controlling company: |
0,00 |
0,00 |
0,00 |
0,00 |
0,00 |
|
|
4. Statutory reserves: |
0,00 |
0,00 |
0,00 |
0,00 |
0,00 |
|
|
5. Miscellaneous reserves: |
30.125.000,00 |
27.190.000,00 |
29.945.000,00 |
22.080.000,00 |
17.494.000,00 |
|
|
Differences due to capital adjustement to euros: |
0,00 |
0,00 |
0,00 |
0,00 |
0,00 |
|
|
V. Profit or loss brought forward: |
0,00 |
0,00 |
0,00 |
0,00 |
0,00 |
|
|
1. Retained earnings: |
0,00 |
0,00 |
0,00 |
0,00 |
0,00 |
|
|
2. Prior year losses: |
0,00 |
0,00 |
0,00 |
0,00 |
0,00 |
|
|
3. Partners' contributions so as to compensate losses: |
0,00 |
0,00 |
0,00 |
0,00 |
0,00 |
|
|
VI. Profit or loss for the financial year: |
2.332.000,00 |
2.935.000,00 |
5.265.000,00 |
7.845.000,00 |
7.086.000,00 |
|
|
VII. Interim dividend paid: |
0,00 |
0,00 |
0,00 |
0,00 |
0,00 |
|
|
VIII. Own shares for capital reduction: |
0,00 |
0,00 |
0,00 |
0,00 |
0,00 |
|
|
B) Deferred income: |
0,00 |
0,00 |
0,00 |
0,00 |
0,00 |
|
|
1. Capital grants: |
0,00 |
0,00 |
0,00 |
0,00 |
0,00 |
|
|
2. Unrealised exchange gains: |
0,00 |
0,00 |
0,00 |
0,00 |
0,00 |
|
|
3. Other deferred income: |
0,00 |
0,00 |
0,00 |
0,00 |
0,00 |
|
|
4. Public revenues to distribute in several financial years: |
0,00 |
0,00 |
0,00 |
0,00 |
0,00 |
|
|
C) PROVISIONS FOR LIABILITIES AND CHARGES: |
777.000,00 |
752.000,00 |
220.000,00 |
212.000,00 |
31.000,00 |
|
|
1. Provisions for pension fund and other similar obligations: |
126.000,00 |
101.000,00 |
40.000,00 |
32.000,00 |
31.000,00 |
|
|
2. Provisions for taxes: |
0,00 |
0,00 |
0,00 |
0,00 |
0,00 |
|
|
3. Other provisions: |
651.000,00 |
651.000,00 |
180.000,00 |
180.000,00 |
0,00 |
|
|
4. Reversion fund: |
0,00 |
0,00 |
0,00 |
0,00 |
0,00 |
|
|
D) LONG TERM LIABILITIES: |
2.000,00 |
2.000,00 |
2.000,00 |
2.000,00 |
2.000,00 |
|
|
I. Issued debentures and other marketable securities: |
0,00 |
0,00 |
0,00 |
0,00 |
0,00 |
|
|
1. Non-convertible debentures: |
0,00 |
0,00 |
0,00 |
0,00 |
0,00 |
|
|
2. Convertible debentures: |
0,00 |
0,00 |
0,00 |
0,00 |
0,00 |
|
|
3. Other debt securities: |
0,00 |
0,00 |
0,00 |
0,00 |
0,00 |
|
|
II. Amounts owed to credit institutions: |
0,00 |
0,00 |
0,00 |
0,00 |
0,00 |
|
|
1. Loans and other liabilities: |
0,00 |
0,00 |
0,00 |
0,00 |
0,00 |
|
|
2. Long-term liabilities from capital leases: |
0,00 |
0,00 |
0,00 |
0,00 |
0,00 |
|
|
III. Debts with companies of the group and affiliated ones: |
0,00 |
0,00 |
0,00 |
0,00 |
0,00 |
|
|
1. Amounts owed to group companies: |
0,00 |
0,00 |
0,00 |
0,00 |
0,00 |
|
|
2. Amounts owed to associated companies: |
0,00 |
0,00 |
0,00 |
0,00 |
0,00 |
|
|
IV. Other creditors: |
2.000,00 |
2.000,00 |
2.000,00 |
2.000,00 |
2.000,00 |
|
|
1. Long-term bills of exchange payable: |
0,00 |
0,00 |
0,00 |
0,00 |
0,00 |
|
|
2. Other creditors: |
0,00 |
0,00 |
0,00 |
0,00 |
0,00 |
|
|
3. Long term guarantees and deposits received: |
2.000,00 |
2.000,00 |
2.000,00 |
2.000,00 |
2.000,00 |
|
|
4. Long term payables to public bodies: |
0,00 |
0,00 |
0,00 |
0,00 |
0,00 |
|
|
V. Unpaid portion of equity investment: |
0,00 |
0,00 |
0,00 |
0,00 |
0,00 |
|
|
1. Group companies: |
0,00 |
0,00 |
0,00 |
0,00 |
0,00 |
|
|
2. Associated companies: |
0,00 |
0,00 |
0,00 |
0,00 |
0,00 |
|
|
3. Third parties: |
0,00 |
0,00 |
0,00 |
0,00 |
0,00 |
|
|
VI. Long term trade creditors: |
0,00 |
0,00 |
0,00 |
0,00 |
0,00 |
|
|
E) SHORT TERM CREDITORS: |
37.229.000,00 |
38.315.000,00 |
45.575.000,00 |
44.853.000,00 |
42.876.000,00 |
|
|
I. Issued debentures and other marketable securities: |
0,00 |
0,00 |
0,00 |
0,00 |
0,00 |
|
|
1. Non-convertible debentures: |
0,00 |
0,00 |
0,00 |
0,00 |
0,00 |
|
|
2. Convertible debentures: |
0,00 |
0,00 |
0,00 |
0,00 |
0,00 |
|
|
3. Other debt securities: |
0,00 |
0,00 |
0,00 |
0,00 |
0,00 |
|
|
4. Accrued interest on debentures and other debt securities: |
0,00 |
0,00 |
0,00 |
0,00 |
0,00 |
|
|
II. Amounts owed to credit institutions: |
0,00 |
0,00 |
0,00 |
0,00 |
0,00 |
|
|
1. Loans and other liabilities: |
0,00 |
0,00 |
0,00 |
0,00 |
0,00 |
|
|
2. Accrued interest on liabilities with credit institutions: |
0,00 |
0,00 |
0,00 |
0,00 |
0,00 |
|
|
3. Short-term liabilities from capital leases: |
0,00 |
0,00 |
0,00 |
0,00 |
0,00 |
|
|
III. Short-term amounts owed to group and associated companies: |
10.330.000,00 |
8.150.000,00 |
13.994.000,00 |
11.626.000,00 |
12.197.000,00 |
|
|
1. Amounts owed to group companies: |
10.330.000,00 |
8.150.000,00 |
13.994.000,00 |
11.626.000,00 |
12.197.000,00 |
|
|
2. Amounts owed to associated companies: |
0,00 |
0,00 |
0,00 |
0,00 |
0,00 |
|
|
IV. Trade creditors: |
22.110.000,00 |
26.351.000,00 |
26.885.000,00 |
30.768.000,00 |
28.679.000,00 |
|
|
1. Advanced payments from customers: |
0,00 |
0,00 |
0,00 |
0,00 |
0,00 |
|
|
2. Amounts owed for purchases of goods or services: |
22.110.000,00 |
26.351.000,00 |
26.885.000,00 |
30.768.000,00 |
28.679.000,00 |
|
|
3. Debts represented by notes payable: |
0,00 |
0,00 |
0,00 |
0,00 |
0,00 |
|
|
V. Other creditors: |
4.664.000,00 |
3.697.000,00 |
4.696.000,00 |
2.459.000,00 |
2.000.000,00 |
|
|
1. Public bodies: |
2.388.000,00 |
1.378.000,00 |
2.008.000,00 |
1.464.000,00 |
1.065.000,00 |
|
|
2. Bills of exchange payable: |
0,00 |
0,00 |
0,00 |
0,00 |
0,00 |
|
|
3. Miscellaneous debts: |
449.000,00 |
720.000,00 |
1.531.000,00 |
0,00 |
0,00 |
|
|
4. Wages and salaries payable: |
1.827.000,00 |
1.599.000,00 |
1.157.000,00 |
995.000,00 |
935.000,00 |
|
|
5. Guarantees and deposits received at short term: |
0,00 |
0,00 |
0,00 |
0,00 |
0,00 |
|
|
VI. Provisions: |
0,00 |
0,00 |
0,00 |
0,00 |
0,00 |
|
|
VII. Prepayments and accrued income: |
125.000,00 |
117.000,00 |
0,00 |
0,00 |
0,00 |
|
|
F) SHORT-TERM PROVISIONS FOR LIABILITIES AND CHARGES: |
189.000,00 |
241.000,00 |
0,00 |
8.000,00 |
78.000,00 |
|
|
GENERAL TOTAL (A + B + C + D + E + F): |
74.729.000,00 |
73.510.000,00 |
85.082.000,00 |
79.075.000,00 |
71.642.000,00 |
|
MERCANTILE REGISTRY.
|
|
EQUIVALENCIA |
EQUIVALENCIA |
EQUIVALENCIA |
EQUIVALENCIA |
EQUIVALENCIA |
|
|
DEBIT |
2013 |
2012 |
2011 |
2010 |
2009 |
|
|
A) CHARGES (A.1 to A.15): |
119.428.000,00 |
122.619.000,00 |
131.860.000,00 |
130.593.000,00 |
127.019.000,00 |
|
|
A.1. Stock reduction of both manufactured goods and the ones in process: |
0,00 |
0,00 |
0,00 |
0,00 |
0,00 |
|
|
A.2. Supplies: |
62.061.000,00 |
62.098.000,00 |
69.678.000,00 |
70.713.000,00 |
68.227.000,00 |
|
|
a) Stock consumption: |
61.666.000,00 |
61.500.000,00 |
69.123.000,00 |
70.110.000,00 |
67.728.000,00 |
|
|
b) Consumption of raw materials and miscellaneous consumable ones: |
395.000,00 |
598.000,00 |
473.000,00 |
484.000,00 |
431.000,00 |
|
|
c) Miscellaneous external expenditure: |
0,00 |
0,00 |
82.000,00 |
119.000,00 |
68.000,00 |
|
|
A.3. Staff costs: |
20.793.000,00 |
20.661.000,00 |
20.727.000,00 |
19.355.000,00 |
18.649.000,00 |
|
|
a) Wages, salaries et al.: |
15.794.000,00 |
15.621.000,00 |
15.718.000,00 |
14.771.000,00 |
14.277.000,00 |
|
|
b) Social security costs: |
4.999.000,00 |
5.040.000,00 |
5.009.000,00 |
4.584.000,00 |
4.372.000,00 |
|
|
A.4. Depreciation expense: |
4.558.000,00 |
5.942.000,00 |
6.951.000,00 |
7.552.000,00 |
7.745.000,00 |
|
|
A.5. Variation of trade provisions and losses of unrecovered receivables: |
-506.000,00 |
1.167.000,00 |
157.000,00 |
-572.000,00 |
182.000,00 |
|
|
a) Stock provision variation: |
-464.000,00 |
478.000,00 |
150.000,00 |
-758.000,00 |
152.000,00 |
|
|
b) Variation in provision and bad debt losses: |
0,00 |
0,00 |
0,00 |
0,00 |
0,00 |
|
|
c) Variation of other trade provisions: |
-42.000,00 |
689.000,00 |
7.000,00 |
186.000,00 |
30.000,00 |
|
|
A.6. Other operating charges: |
30.293.000,00 |
30.738.000,00 |
31.635.000,00 |
30.345.000,00 |
28.676.000,00 |
|
|
a) External services: |
29.668.000,00 |
30.159.000,00 |
30.966.000,00 |
29.781.000,00 |
28.215.000,00 |
|
|
b) Taxes: |
621.000,00 |
584.000,00 |
687.000,00 |
564.000,00 |
471.000,00 |
|
|
c) Other operating expenses: |
4.000,00 |
-5.000,00 |
-18.000,00 |
0,00 |
-10.000,00 |
|
|
d) Allocation to revision fund: |
0,00 |
0,00 |
0,00 |
0,00 |
0,00 |
|
|
A.I. OPERATING BENEFITS (B.1+B.2+B.3+B.4-A.1-A.2-A.3-A.4-A.5-A.6): |
4.549.000,00 |
4.900.000,00 |
7.930.000,00 |
10.998.000,00 |
10.464.000,00 |
|
|
A.7. Financial and similar charges: |
208.000,00 |
0,00 |
0,00 |
0,00 |
0,00 |
|
|
a) Due to liabilities with companies of the group: |
0,00 |
0,00 |
0,00 |
0,00 |
0,00 |
|
|
b) Due to liabilities with associated companies: |
0,00 |
0,00 |
0,00 |
0,00 |
0,00 |
|
|
c) Due to other debts.: |
3.000,00 |
0,00 |
0,00 |
0,00 |
0,00 |
|
|
d) Losses from financial investments: |
205.000,00 |
0,00 |
0,00 |
0,00 |
0,00 |
|
|
A.8. Changes in financial investment provisions: |
0,00 |
0,00 |
0,00 |
0,00 |
0,00 |
|
|
A.9. Exchange losses: |
0,00 |
16.000,00 |
200.000,00 |
36.000,00 |
10.000,00 |
|
|
A.II. NET FINANCIAL INCOME (B.5+B.6+B.7+B.8-A.7-A.8-A.9): |
0,00 |
32.000,00 |
0,00 |
7.000,00 |
98.000,00 |
|
|
A.III. PROFIT FROM ORDINARY ACTIVITIES (A.I+A.II-B.I-B.II): |
4.353.000,00 |
4.932.000,00 |
7.777.000,00 |
11.005.000,00 |
10.562.000,00 |
|
|
A.10. Changes in provisions for intangible, tangible and securities portfolio: |
94.000,00 |
50.000,00 |
0,00 |
0,00 |
0,00 |
|
|
A.11. Losses from tangible and intangible fixed assets and securities portfolio: |
53.000,00 |
265.000,00 |
163.000,00 |
3.000,00 |
217.000,00 |
|
|
A.12. Losses from transactions with own shares and debentures: |
0,00 |
0,00 |
0,00 |
0,00 |
0,00 |
|
|
A.13. Extraordinary expenses: |
838.000,00 |
495.000,00 |
73.000,00 |
0,00 |
0,00 |
|
|
A.14. Expenses and losses of former financial years: |
0,00 |
0,00 |
0,00 |
0,00 |
0,00 |
|
|
A.IV. EXTRAORDINARY PROFIT (B.9+B.10+B.11+B.12+B.13-A.10-A.11-A.12-A.13-A.14): |
0,00 |
0,00 |
0,00 |
1.000,00 |
0,00 |
|
|
A.V. PROFIT BEFORE TAXES (A.III+A.IV-B.III-B.IV): |
3.368.000,00 |
4.122.000,00 |
7.541.000,00 |
11.006.000,00 |
10.399.000,00 |
|
|
A.15. Corporation tax: |
1.036.000,00 |
1.187.000,00 |
2.276.000,00 |
3.161.000,00 |
3.313.000,00 |
|
|
A.16. Miscellaneous taxes: |
0,00 |
0,00 |
0,00 |
0,00 |
0,00 |
|
|
A.VI. FINANCIAL YEAR RESULTS (PROFIT) (A.V-A.15-A.16): |
2.332.000,00 |
2.935.000,00 |
5.265.000,00 |
7.845.000,00 |
7.086.000,00 |
|
MERCANTILE REGISTRY.
|
|
EQUIVALENCIA |
EQUIVALENCIA |
EQUIVALENCIA |
EQUIVALENCIA |
EQUIVALENCIA |
|
|
CREDIT |
2013 |
2012 |
2011 |
2010 |
2009 |
|
|
B) INCOME ( B.1 to B.13): |
121.760.000,00 |
125.554.000,00 |
137.125.000,00 |
138.438.000,00 |
134.105.000,00 |
|
|
B.1. Net total sales: |
121.748.000,00 |
125.506.000,00 |
137.078.000,00 |
138.391.000,00 |
133.943.000,00 |
|
|
a) Sales: |
121.701.000,00 |
125.462.000,00 |
137.078.000,00 |
138.391.000,00 |
133.943.000,00 |
|
|
b) Rendering of services: |
47.000,00 |
44.000,00 |
0,00 |
0,00 |
0,00 |
|
|
Returns and Rappel on sales: |
0,00 |
0,00 |
0,00 |
0,00 |
0,00 |
|
|
B.2. Stock increase of manufactured goods and products in process: |
0,00 |
0,00 |
0,00 |
0,00 |
0,00 |
|
|
B.3. Works performed by the company for fixed assets: |
0,00 |
0,00 |
0,00 |
0,00 |
0,00 |
|
|
B.4. Miscellaneous operating income: |
0,00 |
0,00 |
0,00 |
0,00 |
0,00 |
|
|
a) Auxiliary income and other from current management: |
0,00 |
0,00 |
0,00 |
0,00 |
0,00 |
|
|
b) Grants: |
0,00 |
0,00 |
0,00 |
0,00 |
0,00 |
|
|
c) Liabilities and charges provisions surplus: |
0,00 |
0,00 |
0,00 |
0,00 |
0,00 |
|
|
B.I. PÉRDIDAS DE EXPLOTACIÓN (A.1+A.2+A.3+A.4+A.5-A.6-B.1-B.2-B.3-B.4): |
0,00 |
0,00 |
0,00 |
0,00 |
0,00 |
|
|
B.5. Income from equity investment: |
0,00 |
0,00 |
0,00 |
0,00 |
0,00 |
|
|
a) In companies of the group: |
0,00 |
0,00 |
0,00 |
0,00 |
0,00 |
|
|
b) In associated companies: |
0,00 |
0,00 |
0,00 |
0,00 |
0,00 |
|
|
c) Third parties: |
0,00 |
0,00 |
0,00 |
0,00 |
0,00 |
|
|
B.6. Income from other marketable securities and long-term receivables: |
0,00 |
0,00 |
0,00 |
0,00 |
0,00 |
|
|
a) From companies of the group: |
0,00 |
0,00 |
0,00 |
0,00 |
0,00 |
|
|
b) From associated companies: |
0,00 |
0,00 |
0,00 |
0,00 |
0,00 |
|
|
c) From companies out of the group: |
0,00 |
0,00 |
0,00 |
0,00 |
0,00 |
|
|
B.7. Miscellaneous interests or similar income: |
12.000,00 |
48.000,00 |
47.000,00 |
43.000,00 |
108.000,00 |
|
|
a) From companies of the group: |
11.000,00 |
46.000,00 |
45.000,00 |
41.000,00 |
108.000,00 |
|
|
b) From associated companies: |
0,00 |
0,00 |
0,00 |
0,00 |
0,00 |
|
|
c) Miscellaneous interests: |
1.000,00 |
2.000,00 |
2.000,00 |
2.000,00 |
0,00 |
|
|
d) Profit on financial investment: |
0,00 |
0,00 |
0,00 |
0,00 |
0,00 |
|
|
B.8. Exchange positive differences: |
0,00 |
0,00 |
0,00 |
0,00 |
0,00 |
|
|
B.II. NEGATIVE FINANCIAL RESULTS (A.7+A.8+A.9-B.5-B.6-B.7-B.8): |
196.000,00 |
0,00 |
153.000,00 |
0,00 |
0,00 |
|
|
B.III. LOSSES ON ORDINARY ACTIVITIES ( B.I + B.II - A.I - A.II ): |
0,00 |
0,00 |
0,00 |
0,00 |
0,00 |
|
|
B.9.Profit on disposal of both tangible and intangible fixed assets and securities portfolio: |
0,00 |
0,00 |
0,00 |
0,00 |
0,00 |
|
|
B.10. Profit on transactions with own shares and debentures: |
0,00 |
0,00 |
0,00 |
0,00 |
0,00 |
|
|
B.11. Capital grants transferred to profit and loss: |
0,00 |
0,00 |
0,00 |
0,00 |
0,00 |
|
|
B.12. Extraordinary income: |
0,00 |
0,00 |
0,00 |
4.000,00 |
54.000,00 |
|
|
B.13. Income and profit of former financial years: |
0,00 |
0,00 |
0,00 |
0,00 |
0,00 |
|
|
B.IV. NEGATIVE EXTRAORDINARY RESULTS (A.10+A.11+A.12+A.13+A.14-B.9-B.10-B.11-B.12-B.13): |
985.000,00 |
810.000,00 |
236.000,00 |
0,00 |
163.000,00 |
|
|
B.V. LOSSES BEFORE TAXES (B.III+B.IV-A.III-A.IV): |
0,00 |
0,00 |
0,00 |
0,00 |
0,00 |
|
|
B.VI. RESULT OF THE PERIOD (LOSSES) (B.V+A.15+A.16): |
0,00 |
0,00 |
0,00 |
0,00 |
0,00 |
|
MERCANTILE REGISTRY.
CASHFLOW STATEMENT
|
Model: Normal
> Source of information: Data contained in this section is taken from the information declared in the Annual Accounts submitted to the Trade Register.
|
|
2013 |
2012 |
2011 |
2010 |
2009 |
|
|
1. Fiscal year result before taxes.: 61100 |
3.368.000,00 |
4.122.000,00 |
7.541.000,00 |
11.006.000,00 |
10.399.000,00 |
|
|
2. Results adjustments.: 61200 |
4.365.000,00 |
7.456.000,00 |
7.437.000,00 |
6.867.000,00 |
8.104.000,00 |
|
|
a) Fixed Assets Amortization (+).: 61201 |
4.558.000,00 |
5.942.000,00 |
6.951.000,00 |
7.552.000,00 |
7.745.000,00 |
|
|
b) Obsolescence Allowances (+/-). : 61202 |
-207.000,00 |
528.000,00 |
150.000,00 |
-758.000,00 |
182.000,00 |
|
|
c) Variation in Provision (+/-). : 61203 |
-27.000,00 |
753.000,00 |
20.000,00 |
111.000,00 |
58.000,00 |
|
|
e) Results on disposal of fixed assets (+/-). : 61205 |
53.000,00 |
265.000,00 |
163.000,00 |
3.000,00 |
217.000,00 |
|
|
g) Financial income (-).: 61207 |
-12.000,00 |
-48.000,00 |
-47.000,00 |
-41.000,00 |
-108.000,00 |
|
|
i) Exchange differences (+/-). : 61209 |
0,00 |
16.000,00 |
200.000,00 |
0,00 |
10.000,00 |
|
|
3. Changes in current capital equity.: 61300 |
-749.000,00 |
2.941.000,00 |
-4.288.000,00 |
1.786.000,00 |
-1.399.000,00 |
|
|
a) Stock (+/-).: 61301 |
1.482.000,00 |
1.460.000,00 |
-3.075.000,00 |
-733.000,00 |
-2.004.000,00 |
|
|
d) Debtors and other accounts receivable (+/-). : 61302 |
-1.197.000,00 |
230.000,00 |
-2.896.000,00 |
591.000,00 |
155.000,00 |
|
|
c) Other current assets (+/-). : 61303 |
-57.000,00 |
5.236.000,00 |
58.000,00 |
-49.000,00 |
123.000,00 |
|
|
d) Creditors and other accounts payable (+/-). : 61304 |
-977.000,00 |
-3.985.000,00 |
1.625.000,00 |
1.977.000,00 |
327.000,00 |
|
|
4. Other cash flows for operating activities.: 61400 |
-1.024.000,00 |
-2.399.000,00 |
-2.229.000,00 |
-3.121.000,00 |
-3.074.000,00 |
|
|
c) Interest collection (+). : 61403 |
12.000,00 |
48.000,00 |
47.000,00 |
41.000,00 |
108.000,00 |
|
|
d) Income tax payment collection (payments) (+/-).: 61404 |
-1.036.000,00 |
-2.447.000,00 |
-2.276.000,00 |
-3.162.000,00 |
-3.182.000,00 |
|
|
5. Operating activity cash flows (1 + 2 + 3 + 4) : 61500 |
5.960.000,00 |
12.120.000,00 |
8.461.000,00 |
16.538.000,00 |
14.030.000,00 |
|
|
6. Payments for investment (-).: 62100 |
-5.242.000,00 |
-4.347.000,00 |
-8.034.000,00 |
-14.457.000,00 |
-11.431.000,00 |
|
|
a) Companies of the group and affiliates. : 62101 |
-1.616.000,00 |
0,00 |
-3.677.000,00 |
-9.601.000,00 |
-4.959.000,00 |
|
|
b) Intangible fixed assets. : 62102 |
-32.000,00 |
-269.000,00 |
-107.000,00 |
-180.000,00 |
-76.000,00 |
|
|
c) Fixed assets. : 62103 |
-2.874.000,00 |
-3.933.000,00 |
-4.089.000,00 |
-4.540.000,00 |
-6.384.000,00 |
|
|
e) Other financial assets. : 62105 |
-720.000,00 |
-145.000,00 |
-161.000,00 |
-136.000,00 |
-12.000,00 |
|
|
7. Divestment payment collection (+). : 62200 |
0,00 |
0,00 |
0,00 |
0,00 |
32.000,00 |
|
|
e) Other financial assets. : 62205 |
0,00 |
0,00 |
0,00 |
0,00 |
32.000,00 |
|
|
8. Investment activity cash flows (6 + 7) minus Amortization: 62300 |
-5.242.000,00 |
-4.347.000,00 |
-8.034.000,00 |
-14.457.000,00 |
-11.399.000,00 |
|
|
9. Payment collection and payments for equity instruments. : 63100 |
0,00 |
0,00 |
0,00 |
0,00 |
0,00 |
|
|
10. Payment collection and payments for financial liabilities instruments.: 63200 |
0,00 |
0,00 |
0,00 |
0,00 |
5.000,00 |
|
|
a) Issuance : 63201 |
0,00 |
0,00 |
0,00 |
0,00 |
5.000,00 |
|
|
5. Other debts (+). : 63206 |
0,00 |
0,00 |
0,00 |
0,00 |
5.000,00 |
|
|
11. Payments from dividends and remunerations from other assets instruments. : 63300 |
0,00 |
-8.000.000,00 |
0,00 |
-2.500.000,00 |
-2.500.000,00 |
|
|
a) Dividends (-).: 63301 |
0,00 |
-8.000.000,00 |
0,00 |
-2.500.000,00 |
-2.500.000,00 |
|
|
12. Cash flows for financing activities (9+10+11).: 63400 |
0,00 |
-8.000.000,00 |
0,00 |
-2.500.000,00 |
-2.495.000,00 |
|
|
D) EFFECT OF EXCHANGE RATE CHANGES: 64000 |
0,00 |
0,00 |
0,00 |
0,00 |
0,00 |
|
|
E) NET INCREASE/DECREASE OF CASH OR EQUIVALENT ASSETS (+/-5+/-8+/12+/-D) : 65000 |
718.000,00 |
-227.000,00 |
427.000,00 |
-419.000,00 |
136.000,00 |
|
|
Cash or equivalent assets as of beginning of the fiscal year.: 65100 |
894.000,00 |
1.121.000,00 |
694.000,00 |
1.113.000,00 |
977.000,00 |
|
|
Cash or equivalent assets as of end of the fiscal year.: 65200 |
1.612.000,00 |
894.000,00 |
1.121.000,00 |
694.000,00 |
1.113.000,00 |
|
FINANCIAL DIAGNOSIS
|
> Economic-Financial Comparative Analysis
Data used in the following ratios and indicators is taken from the Annual Accounts submitted by the company to the TRADE REGISTER.
> Comparison within the Sector
|
Cash Flow |
2013 |
2012 |
Variación 2013 - 2012 |
|
|||
|
|
Empresa |
Sector |
Empresa |
Sector |
Empresa |
Sector |
|
|
Cash Flow over Sales: |
0,01 % |
0,02 % |
0,00 % |
0,01 % |
|
172,15 % |
|
|
EBITDA over Sales: |
7,48 % |
10,22 % |
8,64 % |
9,24 % |
-13,41 % |
10,65 % |
|
|
Cash Flow Yield: |
0,01 % |
0,01 % |
0,00 % |
0,00 % |
|
|
|
|
Profitability |
2013 |
2012 |
Variación 2013 - 2012 |
|
|||
|
|
Empresa |
Sector |
Empresa |
Sector |
Empresa |
Sector |
|
|
Operating economic profitability: |
9,33 % |
6,60 % |
9,49 % |
5,23 % |
-1,72 % |
26,12 % |
|
|
Total economic profitability: |
4,51 % |
3,60 % |
5,61 % |
2,49 % |
-19,55 % |
44,48 % |
|
|
Financial profitability: |
6,38 % |
4,29 % |
8,58 % |
1,32 % |
-25,62 % |
226,00 % |
|
|
Margin: |
3,62 % |
6,01 % |
3,65 % |
4,85 % |
-1,03 % |
23,75 % |
|
|
Mark-up: |
3,45 % |
4,01 % |
3,68 % |
1,59 % |
-6,09 % |
152,10 % |
|
|
Solvency |
2013 |
2012 |
Variación 2013 - 2012 |
|
|||
|
|
Empresa |
Sector |
Empresa |
Sector |
Empresa |
Sector |
|
|
Liquidity: |
0,04 |
0,14 |
0,02 |
0,12 |
85,57 |
20,41 |
|
|
Acid Test: |
0,72 |
0,86 |
0,62 |
0,85 |
16,08 |
0,80 |
|
|
Working Capital / Investment: |
0,31 |
0,02 |
0,27 |
0,03 |
12,75 |
-15,15 |
|
|
Solvency: |
1,71 |
1,17 |
1,57 |
1,17 |
8,67 |
-0,32 |
|
|
Indebtedness |
2013 |
2012 |
Variación 2013 - 2012 |
|
|||
|
|
Empresa |
Sector |
Empresa |
Sector |
Empresa |
Sector |
|
|
Indebtedness level: |
1,00 |
1,42 |
1,10 |
1,63 |
-8,97 |
-12,68 |
|
|
Borrowing Composition: |
0,00 |
1,02 |
0,00 |
1,03 |
|
-1,28 |
|
|
Repayment Ability: |
51,85 |
60,77 |
-168,80 |
180,64 |
130,72 |
-66,36 |
|
|
Warranty: |
2,01 |
1,71 |
1,92 |
1,62 |
4,62 |
5,70 |
|
|
Generated resources / Total creditors: |
0,18 |
0,08 |
0,24 |
0,07 |
-27,05 |
22,73 |
|
|
Efficiency |
2013 |
2012 |
Variación 2013 - 2012 |
|
|||
|
|
Empresa |
Sector |
Empresa |
Sector |
Empresa |
Sector |
|
|
Productivity: |
1,44 |
1,82 |
1,52 |
1,73 |
-5,69 |
5,64 |
|
|
Turnover of Collection Rights : |
2.898,76 |
5,11 |
309,13 |
4,80 |
837,72 |
6,49 |
|
|
Turnover of Payment Entitlements: |
2,63 |
3,69 |
2,51 |
3,52 |
4,79 |
4,80 |
|
|
Stock rotation: |
3,47 |
7,81 |
3,44 |
6,53 |
0,85 |
19,62 |
|
|
Assets turnover: |
2,58 |
1,10 |
2,60 |
1,08 |
-0,70 |
1,92 |
|
|
Borrowing Cost: |
0,01 |
2,85 |
0,00 |
2,95 |
|
-3,61 |
|
> Trend of indicators under the General Accounting Plan of 2007 (2013, 2012, 2011, 2010, 2009)
|
Cash Flow |
2013 |
2012 |
2011 |
2010 |
2009 |
|
|
Cash Flow over Sales: |
0,01 % |
0,00 % |
0,00 % |
0,00 % |
0,10 % |
|
|
EBITDA over Sales: |
7,48 % |
8,64 % |
10,86 % |
13,40 % |
13,59 % |
|
|
Cash Flow Yield: |
0,01 % |
0,00 % |
0,01 % |
-0,01 % |
0,19 % |
|
|
Profitability |
2013 |
2012 |
2011 |
2010 |
2009 |
|
|
Operating economic profitability: |
9,33 % |
9,49 % |
14,23 % |
20,59 % |
18,39 % |
|
|
Total economic profitability: |
4,51 % |
5,61 % |
8,86 % |
13,92 % |
14,52 % |
|
|
Financial profitability: |
6,38 % |
8,58 % |
13,41 % |
23,07 % |
24,73 % |
|
|
Margin: |
3,62 % |
3,65 % |
5,67 % |
7,94 % |
7,65 % |
|
|
Mark-up: |
3,45 % |
3,68 % |
5,55 % |
7,95 % |
7,72 % |
|
|
Solvency |
2013 |
2012 |
2011 |
2010 |
2009 |
|
|
Liquidity: |
0,04 |
0,02 |
0,02 |
0,02 |
0,03 |
|
|
Acid Test: |
0,72 |
0,62 |
0,64 |
0,53 |
0,34 |
|
|
Working Capital / Investment: |
0,31 |
0,27 |
0,25 |
0,17 |
0,06 |
|
|
Solvency: |
1,71 |
1,57 |
1,51 |
1,35 |
1,17 |
|
|
Indebtedness |
2013 |
2012 |
2011 |
2010 |
2009 |
|
|
Indebtedness level: |
1,00 |
1,10 |
1,15 |
1,31 |
1,49 |
|
|
Borrowing Composition: |
0,00 |
0,00 |
0,00 |
0,00 |
0,00 |
|
|
Repayment Ability: |
51,85 |
-168,80 |
106,74 |
-107,05 |
2,32 |
|
|
Warranty: |
2,01 |
1,92 |
1,87 |
1,76 |
1,67 |
|
|
Generated resources / Total creditors: |
0,18 |
0,24 |
0,27 |
0,33 |
0,35 |
|
|
Efficiency |
2013 |
2012 |
2011 |
2010 |
2009 |
|
|
Productivity: |
1,44 |
1,52 |
1,72 |
1,96 |
1,98 |
|
|
Turnover of Collection Rights : |
2.898,76 |
309,13 |
220,38 |
|
16.742,88 |
|
|
Turnover of Payment Entitlements: |
2,63 |
2,51 |
2,44 |
2,31 |
2,44 |
|
|
Stock rotation: |
3,47 |
3,44 |
3,49 |
3,74 |
3,79 |
|
|
Assets turnover: |
2,58 |
2,60 |
2,51 |
2,59 |
2,40 |
|
|
Borrowing Cost: |
0,01 |
0,00 |
0,00 |
0,00 |
0,00 |
|
COMPARATIVE SECTORIAL BALANCE
|
Sector-based Comparison under the rules of the New General Accounting Plan.
|
|
Variación - |
|
|
|
Empresa |
Sector |
|
|
Variación - |
|
|
|
Empresa |
Sector |
|
|
Variación - |
|
|
|
Empresa |
Sector |
|
FINANZAS.COM |
15/02/2013 |
|
Economía. Merkal Calzados sobrepasa las 230 tiendas tras incorporarse a la oferta del parque comercial 'Camino Real' |
|
|
Companies related |
|
Public Tenders and Works Won
|
No Public Tenders assigned to the name of the company.
Research Summary
|
|
The firm was founded in 2003. It has 230 stores in España, South of France and Portugal. It is in the group "GRUPO VIVARTE", which is one of the most important groups and it has stores in more France, Spainy, Switzerland, with more of 4.000 stores and 24.000 employers. The company has important brands as: NAF NAF, CHEVIGNON, KOOKAÏ o CAROLL. In Spain is also representative with the Brand: FOSCO. In the sources consulted appears nothing against him. In light of the above we believe that he can continue operations relating to risk commensurate with its size. |
Sources
|
|
Registry of Commerce's Official Gazette. Own and external data bases Company References |
FOREIGN EXCHANGE RATES
|
Currency |
Unit
|
Indian Rupees |
|
US Dollar |
1 |
Rs.63.45 |
|
|
1 |
Rs.98.88 |
|
Euro |
1 |
Rs.77.62 |
INFORMATION DETAILS
|
Analysis Done by
: |
SUB |
|
|
|
|
Report Prepared
by : |
NIS |
RATING EXPLANATIONS
|
RATING |
STATUS |
PROPOSED CREDIT LINE |
|
|
|
>86 |
Aaa |
Possesses an extremely sound financial base with the strongest capability
for timely payment of interest and principal sums |
Unlimited |
|
|
71-85 |
Aa |
Possesses adequate working capital. No caution needed for credit
transaction. It has above average (strong) capability for payment of interest
and principal sums |
Large |
|
|
56-70 |
A |
Financial & operational base are regarded healthy. General
unfavourable factors will not cause fatal effect. Satisfactory capability for
payment of interest and principal sums |
Fairly Large |
|
|
41-55 |
Ba |
Overall operation
is considered normal. Capable to meet normal commitments. |
Satisfactory |
|
|
26-40 |
B |
Capability to overcome financial difficulties seems comparatively
below average. |
Small |
|
|
11-25 |
Ca |
Adverse factors are apparent. Repayment of interest and principal sums
in default or expected to be in default upon maturity |
Limited with
full security |
|
|
<10 |
C |
Absolute credit risk exists. Caution needed to be exercised |
Credit not
recommended |
|
|
-- |
NB |
New Business |
-- |
|
This score serves as a reference to assess
SC’s credit risk and to set the amount of credit to be extended. It is
calculated from a composite of weighted scores obtained from each of the major
sections of this report. The assessed factors and their relative weights (as
indicated through %) are as follows:
Financial
condition (40%) Ownership
background (20%) Payment
record (10%)
Credit history
(10%) Market trend (10%) Operational size
(10%)
This report is issued at your request without any
risk and responsibility on the part of MIRA INFORM PRIVATE LIMITED (MIPL)
or its officials.