MIRA INFORM REPORT
|
Report Date : |
27.12.2014 |
IDENTIFICATION DETAILS
|
Name : |
BERLIMED SA |
|
|
|
|
Registered Office : |
Calle Francisco Alonso S/N |
|
|
|
|
Country : |
|
|
|
|
|
Financials (as on) : |
2013 |
|
|
|
|
Date of Incorporation : |
06.10.1995 |
|
|
|
|
Legal Form : |
Public Company |
|
|
|
|
Line of Business : |
Wholesale of Pharmaceutical Goods. |
|
|
|
|
No. of Employee : |
Not Available |
RATING & COMMENTS
|
MIRA’s Rating : |
Ba |
|
RATING |
STATUS |
PROPOSED CREDIT LINE |
|
|
41-55 |
Ba |
Overall operation is considered normal. Capable to meet normal commitments. |
Satisfactory |
|
Status : |
Satisfactory |
|
Payment Behaviour : |
No Complaints |
|
Litigation : |
Clear |
NOTES :
Any query related to this report can be made
on e-mail : infodept@mirainform.com
while quoting report number, name and date.
ECGC Country Risk Classification List – September 30, 2014
|
Country Name |
Previous Rating (30.06.2014) |
Current Rating (30.09.2014) |
|
|
A2 |
A2 |
|
Risk Category |
ECGC Classification |
|
Insignificant |
A1 |
|
Low |
A2 |
|
Moderate |
B1 |
|
High |
B2 |
|
Very High |
C1 |
|
Restricted |
C2 |
|
Off-credit |
D |
|
Source
: CIA |
EXECUTIVE SUMMARY
|
|
Name: |
BERLIMED SA |
|
NIF / Fiscal code: |
A81254765 |
|
Status: |
ACTIVE |
|
Incorporation Date: |
06/10/1995 |
|
Register Data |
Register Section 8 Sheet 158384 |
|
Last Publication
in BORME: |
16/09/2014 [Reelections] |
|
Last Published Account Deposit: |
2013 |
|
Share Capital: |
17.489.452,24 |
|
|
|
|
Localization: |
CALLE FRANCISCO ALONSO S/N POL IND SANTA ROSA - ALCALA DE HENARES -
28806 - MADRID |
|
Telephone - Fax - Email - Website: |
Ph.:. 918 871 400 / 932 284 000 Email. carmen.pinilla@bayer.com
Website. www.berlimed.es |
|
|
|
|
Activity: |
|
|
NACE: |
4646 - Wholesale of pharmaceutical goods |
|
Registered Trademarks: |
|
|
Audited / Opinion: |
Si / |
|
Tenders and Awards: |
0 for a total cost of 0 |
|
Subsidies: |
0 for a total cost of 0 |
|
Quality Certificate: |
No |
|
|
|
|
Defaults, Legal
Claims and Insolvency Proceedings : |
|
|
|
|
|
|
|
Number |
Amount (€) |
Most Recent Entry |
|
Insolvency Proceedings, Bankruptcy and Suspension of Payments |
|
Unpublished |
--- |
--- |
|
Defaults on debt with Financial Institutions and Large Companies |
|
None |
--- |
--- |
|
Judicial Claims (Notices, Executive Proceedings, Attachments,
Auctions, Bad Debt) |
|
1 |
0 |
--- |
|
Proceedings heard by the Civil Court |
|
Unpublished |
0 |
--- |
|
Proceedings heard by the Labour Court |
|
Unpublished |
0 |
--- |
|
Partners: |
|
BAYER HISPANIA SL |
100 % |
|
|
JUSTE SAQF |
49 % |
|
|
SCHERING ESPAÑA SA |
51 % |
|
|
Shares: |
0 |
|
|
Other Links: |
2 |
|
|
No. of Active Corporate Bodies: |
|
|
|
Ratios |
2013 |
2012 |
Change |
|
|
|
|
|
Guarantees: |
|
|
Properties Registered: |
Company NO, Administrator NO |
|
Financing / Guarantee Sources : |
Sources YES, Guarantees YES |
|
|
|
|
|
|
|
INVESTIGATION
SUMMARY |
|
|
The company belongs to the Bayer Group. It was incorporated in 1995
and is engaged in the manufacture of pharmaceutical products. Its turnover
has been increased by 20,31 % in 2013 compared to 2012. It complies with its
payment obligations. |
|
Identification
|
|
|
Social
Denomination: |
BERLIMED SA |
|
NIF / Fiscal
code: |
A81254765 |
|
Corporate
Status: |
ACTIVE |
|
Start of
activity: |
1995 |
|
Registered
Office: |
CALLE FRANCISCO ALONSO S/N POL IND SANTA ROSA |
|
Locality: |
ALCALA DE HENARES |
|
Province: |
MADRID |
|
Postal Code: |
28806 |
|
Telephone: |
918 871 400 / 932 284 000 |
|
Fax: |
918 871 401 |
|
Website: |
www.berlimed.es |
|
Email: |
carmen.pinilla@bayer.com |
Activity
|
|
|
NACE: |
4646 |
|
CNAE Obtaining
Source: |
4646 |
|
Additional
Information: |
It is engaged in the manufacture of pharmaceutical products, including
solid forms in sachets, liquids and soft capsules. It belongs to Bayer
HealthCare, the pharmaceutical company of Bayer Group. It produces soft
gelatin capsules for the group and for other customers and about 25 million
units of liquid dosage forms for different companies in the Bayer Group. |
|
Import / export: |
EXPORTS |
|
Future
Perspective: |
Consolidation |
|
Industry
situation: |
Maturity |
Chronological Summary
|
|||
|
|
Year |
Act |
|
|
|
1995 |
Appointments/ Re-elections (2) Company Formation (1) |
|
|
|
1996 |
Accounts deposit (ejer. 1995) Change of Social Purpose (1) Dividends Payment
(1) Increase of Capital (1) Statutory Modifications (1) |
|
|
|
1997 |
Accounts deposit (ejer. 1996) Increase of Capital (2) |
|
|
|
1998 |
Accounts deposit (ejer. 1997) Appointments/ Re-elections (1)
Cessations/ Resignations/ Reversals (2) Increase of Capital (4) Statutory
Modifications (1) |
|
|
|
1999 |
Accounts deposit (ejer. 1998) Appointments/ Re-elections (2)
Cessations/ Resignations/ Reversals (2) |
|
|
|
2000 |
Accounts deposit (ejer. 1999 consolidated) Appointments/ Re-elections
(3) Cessations/ Resignations/ Reversals (2) Change of Social address (1) |
|
|
|
2001 |
Accounts deposit (ejer. 2000) Appointments/ Re-elections (1) Cessations/
Resignations/ Reversals (1) |
|
|
|
2002 |
Accounts deposit (ejer. 2001) |
|
|
|
2003 |
Accounts deposit (ejer. 2002) |
|
|
|
2004 |
Accounts deposit (ejer. 2003) Appointments/ Re-elections (1) |
|
|
|
2005 |
Accounts deposit (ejer. 2004) Appointments/ Re-elections (2)
Cessations/ Resignations/ Reversals (1) |
|
|
|
2006 |
Accounts deposit (ejer. 2005) Appointments/ Re-elections (3)
Cessations/ Resignations/ Reversals (2) |
|
|
|
2007 |
Accounts deposit (ejer. 2006) Appointments/ Re-elections (2)
Cessations/ Resignations/ Reversals (2) |
|
|
|
2008 |
Accounts deposit (ejer. 2007) Appointments/ Re-elections (3)
Cessations/ Resignations/ Reversals (4) |
|
|
|
2009 |
Accounts deposit (ejer. 2008) Appointments/ Re-elections (3)
Cessations/ Resignations/ Reversals (3) Statutory Modifications (1) |
|
|
|
2010 |
Accounts deposit (ejer. 2009) Appointments/ Re-elections (3)
Cessations/ Resignations/ Reversals (1) |
|
|
|
2011 |
Accounts deposit (ejer. 2010) Appointments/ Re-elections (6)
Cessations/ Resignations/ Reversals (2) Declaration of Sole Propietorship (1) |
|
|
|
2012 |
Accounts deposit (ejer. 2011) Appointments/ Re-elections (4) Cessations/
Resignations/ Reversals (3) |
|
|
|
2013 |
Accounts deposit (ejer. 2012) Appointments/ Re-elections (5)
Cessations/ Resignations/ Reversals (3) |
|
|
|
2014 |
Accounts deposit (ejer. 2013) Appointments/ Re-elections (3) Cessations/
Resignations/ Reversals (2) |
|
Main Historic Changes
|
|||
|
Concept |
Publication |
Act |
Date |
|
Corporate Purpose Changes: |
LA FABRICACION,VENTA Y DISTRIBUCION DE PRODUCTOS QUIMICOS Y
FARMACEUTICOS. |
Company Formation |
26/10/1995 |
Breakdown of Owners' Equity
|
|
|
Registered
Capital: |
17.489.452,24 |
|
Paid up capital: |
17.489.452,24 |
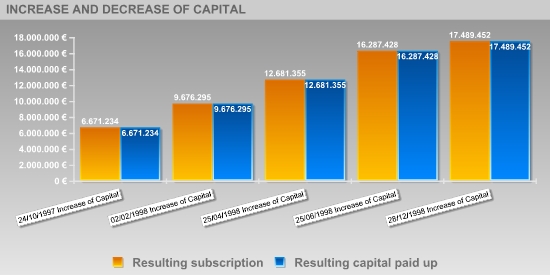
Updated Evolution of the Subscribed and Paid-in Capital
|
|||||
|
|
|||||
|
|
|
|
|
|
|
|
Publishing Date |
Registration
Type |
Capital
Subscribed |
Paid up capital |
Underwritten
result |
Disbursed Result |
|
06/10/1995 |
Company Formation |
60.101 |
15.025 |
60.101 |
15.025 |
|
10/05/1996 |
Capital call payment |
--- |
45.076 |
60.101 |
45.076 |
|
22/10/1996 |
Increase of Capital |
3.005.061 |
3.005.061 |
3.065.162 |
3.065.162 |
|
27/01/1997 |
Increase of Capital |
1.202.024 |
1.202.024 |
4.267.186 |
4.267.186 |
|
24/10/1997 |
Increase of Capital |
2.404.048 |
2.404.048 |
6.671.234 |
6.671.234 |
|
02/02/1998 |
Increase of Capital |
3.005.061 |
3.005.061 |
9.676.295 |
9.676.295 |
|
25/04/1998 |
Increase of Capital |
3.005.061 |
3.005.061 |
12.681.355 |
12.681.355 |
|
25/06/1998 |
Increase of Capital |
3.606.073 |
3.606.073 |
16.287.428 |
16.287.428 |
|
28/12/1998 |
Increase of Capital |
1.202.024 |
1.202.024 |
17.489.452 |
17.489.452 |
Active Social Bodies
|
|
Post published |
Social Body's
Name |
Appointment Date |
Other Positions
in this Company |
|
SINGLE PARTNER |
BAYER HISPANIA SL |
18/05/2011 |
1 |
|
PRESIDENT |
KRAUSE RAINER ERICH |
30/01/2012 |
3 |
|
VICE CHAIRMAN |
SPOOR RICHARD LAWRENCE |
03/09/2014 |
2 |
|
MEMBER OF THE BOARD |
SPOOR RICHARD LAWRENCE |
03/09/2014 |
2 |
|
|
SAEZ CASAS ANTONIO |
30/01/2012 |
6 |
|
|
KRAUSE RAINER ERICH |
21/12/2010 |
3 |
|
COMBINED PROXY |
MARTINEZ JORGE MANUEL |
18/04/2013 |
2 |
|
JOINT ATTORNEY |
MARTINEZ JORGE MANUEL |
18/04/2013 |
2 |
|
|
FERNANDEZ BERROCAL CRISTINA |
14/06/2011 |
1 |
|
|
LOPEZ SIERRA ABEL |
14/06/2011 |
1 |
|
|
GARCIA CORCOBADO JOSE LUIS |
14/06/2011 |
1 |
|
|
MARQUEZ PERDIGON ESTHER |
14/06/2011 |
1 |
|
|
SIMON GUERRERO FERNANDO |
03/01/2011 |
1 |
|
JOINT ATTORNEY/COMBINED PROXY |
DALIBARD PASCAL ROGER |
30/08/2010 |
1 |
|
|
KLOCKEWITZ KATJA TINA |
30/08/2010 |
1 |
|
|
GODDE JOACHIM HEINRICH |
30/08/2010 |
1 |
|
|
SCHMITZ STEFAN KARL |
30/08/2010 |
1 |
|
|
TRAPPMANN NINA |
30/08/2010 |
1 |
|
PROXY |
ENGEL BETTINA ELFRIEDE |
14/07/2014 |
2 |
|
|
NIETO SATOCA JESUS |
30/05/2013 |
1 |
|
|
ZEA CABRERA LUZ MARIA |
30/05/2013 |
1 |
|
|
ORTEGA SANCHEZ-TOBOSO PEDRO ANTONIO |
30/05/2013 |
1 |
|
|
CASTELLANOS RODRIGUEZ ALBERTO |
10/01/2013 |
1 |
|
|
DELGADO FERNANDEZ ELIGIO |
22/09/2012 |
9 |
|
|
CURTO CAPDEVILA MISERICORDIA |
22/09/2012 |
1 |
|
|
CAMPOY MARTINEZ BERTA |
22/09/2012 |
1 |
|
|
MONTERO DIAZ MIGUEL ANGEL |
22/09/2012 |
1 |
|
|
LANGNER MANFRED HELMUT |
22/09/2012 |
1 |
|
|
OEHL MICHAEL HEINRICH |
22/09/2012 |
1 |
|
|
STEINHANSES SABINE |
22/09/2012 |
1 |
|
|
SOARES DA CRUZ RICARDO |
25/05/2012 |
1 |
|
|
ALMIÑANA CAMPABADAL ANA MARIA |
25/05/2012 |
1 |
|
|
MANSERGAS SELLENS SERGIO |
25/05/2012 |
1 |
|
|
ROSS CHRISTINA |
25/05/2012 |
1 |
|
|
LEON CARRERAS FRANCESC |
25/05/2012 |
3 |
|
|
JORDAN ONCINS MARIA PILAR |
07/02/2011 |
1 |
|
|
ARBOIX DE LA TORRE MARIA ROSA |
07/02/2011 |
1 |
|
|
MEDINA PAREDES MARTA |
07/02/2011 |
1 |
|
|
ENGUIX ANDUCAS MARTA |
07/02/2011 |
1 |
|
|
FORSTER GRIT |
21/09/2009 |
1 |
|
|
LUTZ SEEGER FRANK |
01/09/2009 |
2 |
|
|
CABRERA FORNEIRO LUISA |
01/09/2009 |
2 |
|
|
VOM HOFE KIRSTIN KALAU |
27/11/2008 |
1 |
|
|
MANRIQUE MORA MARIA DEL ROCIO |
17/08/2007 |
1 |
|
|
NEBOT ASCASO JUAN CARLOS |
17/08/2007 |
1 |
|
|
COSCULLUELA GIRAL BENJAMIN |
17/08/2007 |
1 |
|
|
BALDENWEG ANNETTE |
17/08/2007 |
1 |
|
|
COMPANY MONTORY MONTSERRAT |
17/08/2007 |
1 |
|
|
CAMPOY BENEDICTO JAVIER |
17/08/2007 |
1 |
|
|
SOLER ESTEVE ESPERANZA |
17/08/2007 |
1 |
|
|
JIMENEZ GUILLEN MARIA TERESA |
17/08/2007 |
1 |
|
|
SCHMIDT JURGEN |
17/08/2007 |
1 |
|
|
SAEZ CASAS ANTONIO |
17/08/2007 |
6 |
|
|
MARTIN SANCHEZ GREGORIO |
17/08/2007 |
1 |
|
|
HERNANDEZ MARTINEZ MARIA ISABEL |
17/08/2007 |
1 |
|
|
KALAU VOM HOFE KIRSTIN |
17/08/2007 |
1 |
|
|
PUIGBERT RIBES JOSE |
17/08/2007 |
1 |
|
|
JUSTE BELLOSILLO FRANCISCO |
22/09/1999 |
1 |
|
SECRETARY |
SAEZ CASAS ANTONIO |
30/01/2012 |
6 |
|
ACCOUNTS' AUDITOR / HOLDER |
PRICEWATERHOUSECOOPERS AUDITORES SL |
09/09/2014 |
2 |
Historical Social Bodies
|
|
Social Body's
Name |
Post published |
End Date |
Other Positions
in this Company |
|
ANGULO GARCIA FRANCISCO JAVIER |
PROXY |
08/05/2001 |
4 |
|
|
PROXY |
15/02/2005 |
|
|
|
JOINT ATTORNEY |
21/07/2006 |
|
|
|
PROXY |
17/08/2007 |
|
|
AYALA GARCES SANTIAGO |
PROXY |
27/01/1998 |
4 |
|
|
MEMBER OF THE BOARD |
22/09/1999 |
|
|
|
PROXY |
22/09/1999 |
|
|
|
PROXY |
12/04/2000 |
|
|
BACH JOACHIM |
JOINT ATTORNEY/COMBINED PROXY |
14/06/2011 |
1 |
|
BAJA ADRIAN JOSEF |
JOINT ATTORNEY/COMBINED PROXY |
14/06/2011 |
1 |
|
BDO AUDIBERIA AUDITORES SL |
ACCOUNTS' AUDITOR / HOLDER |
22/09/2004 |
4 |
|
|
ACCOUNTS' AUDITOR / HOLDER |
09/08/2006 |
|
|
|
ACCOUNTS' AUDITOR / HOLDER |
18/07/2005 |
|
|
|
ACCOUNTS' AUDITOR / HOLDER |
28/01/2008 |
|
|
BELLON FERNANDEZ JAVIER |
PROXY |
20/11/2000 |
4 |
|
|
PROXY |
08/05/2001 |
|
|
|
PROXY |
12/04/2000 |
|
|
|
PROXY |
15/02/2005 |
|
|
BERCERUELO GONZALEZ JOSE LUIS |
PROXY |
10/01/2013 |
1 |
|
BERTRAM FRANK |
MEMBER OF THE BOARD |
30/01/2012 |
2 |
|
|
PRESIDENT |
30/01/2012 |
|
|
BOHN MICHAEL GUSTAV |
MEMBER OF THE BOARD |
17/08/2007 |
2 |
|
|
SECRETARY |
17/08/2007 |
|
|
BRACKMANN NICK BENJAMIN |
JOINT ATTORNEY/COMBINED PROXY |
22/09/2012 |
1 |
|
CABRERA FORNEIRO LUISA |
PROXY |
01/09/2009 |
2 |
|
CAMPOY BENEDICTO JORGE |
PROXY |
14/06/2011 |
1 |
|
CASSIDY DENIS |
PROXY |
22/09/1999 |
11 |
|
|
PROXY |
12/04/2000 |
|
|
|
MEMBER OF THE BOARD |
25/09/2000 |
|
|
|
PROXY |
20/11/2000 |
|
|
|
PROXY |
08/05/2001 |
|
|
|
PROXY |
15/02/2005 |
|
|
|
MEMBER OF THE BOARD |
18/07/2005 |
|
|
|
JOINT ATTORNEY/COMBINED PROXY |
21/07/2006 |
|
|
|
PROXY |
17/08/2007 |
|
|
|
MEMBER OF THE BOARD |
22/05/2008 |
|
|
|
PROXY |
01/08/2008 |
|
|
CODINA NESPLE AGUSTIN |
PROXY |
14/06/2011 |
1 |
|
DE HARO NAVARRO ANTONIO |
PROXY |
27/11/2008 |
1 |
|
DEHELLY CHRISTELLE |
PROXY |
10/01/2013 |
1 |
|
DELGADO FERNANDEZ ELIGIO |
PROXY |
12/04/2000 |
9 |
|
|
PROXY |
27/01/1998 |
|
|
|
PROXY |
08/05/2001 |
|
|
|
PROXY |
15/02/2005 |
|
|
|
PROXY |
20/11/2000 |
|
|
|
JOINT ATTORNEY/COMBINED PROXY |
21/07/2006 |
|
|
|
PROXY |
17/08/2007 |
|
|
|
PROXY |
22/09/2012 |
|
|
DURANTEZ GARCIA MANUEL |
PROXY |
20/11/2000 |
6 |
|
|
PROXY |
12/04/2000 |
|
|
|
COMBINED PROXY |
21/07/2006 |
|
|
|
PROXY |
17/08/2007 |
|
|
|
PROXY |
08/05/2001 |
|
|
|
PROXY |
15/02/2005 |
|
|
ENGEL BETTINA ELFRIEDE |
JOINT ATTORNEY/COMBINED PROXY |
22/09/2012 |
2 |
|
ESSER WINFRIED |
JOINT ATTORNEY/COMBINED PROXY |
22/09/2012 |
1 |
|
GALDINI BRUNO |
PROXY |
27/11/2008 |
2 |
|
|
JOINT ATTORNEY/COMBINED PROXY |
10/01/2013 |
|
|
GARRIDO FUENTES SERGIO |
PROXY |
14/06/2011 |
1 |
|
GIERLICHS OLIVER |
PROXY |
03/01/2011 |
1 |
|
GIL GREGORIO JAIME |
PROXY |
27/11/2008 |
1 |
|
GOMEZ CARRILLO CARRASCO FRANCISCO JAVIER |
PROXY |
20/11/2000 |
6 |
|
|
PROXY |
08/05/2001 |
|
|
|
PROXY |
17/08/2007 |
|
|
|
PROXY |
15/02/2005 |
|
|
|
JOINT ATTORNEY |
21/07/2006 |
|
|
|
PROXY |
27/11/2008 |
|
|
GONZALEZ SANCHEZ FRANCISCO JAVIER |
PROXY |
12/04/2000 |
2 |
|
|
PROXY |
20/11/2000 |
|
|
GRUNROSENBERGER HEIDEMARIE |
JOINT ATTORNEY/COMBINED PROXY |
14/06/2011 |
1 |
|
HAUMESSER WINFRIED |
MEMBER OF THE BOARD |
18/07/2005 |
3 |
|
|
MEMBER OF THE BOARD |
17/08/2007 |
|
|
|
MEMBER OF THE BOARD |
25/09/2000 |
|
|
JUAN MONTEJO ANTONIO |
COMBINED PROXY |
21/07/2006 |
2 |
|
|
PROXY |
17/08/2007 |
|
|
JUAN MONTEL ANTONIO |
COMBINED PROXY |
21/07/2006 |
1 |
|
JUSTE BELLOSILLO FRANCISCO DE ASIS |
PROXY |
20/11/2000 |
6 |
|
|
PROXY |
12/04/2000 |
|
|
|
PROXY |
08/05/2001 |
|
|
|
PROXY |
15/02/2005 |
|
|
|
PROXY |
17/08/2007 |
|
|
|
COMBINED PROXY |
21/07/2006 |
|
|
JUSTE BELLOSILLO INES |
MEMBER OF THE BOARD |
27/07/2009 |
1 |
|
JUSTE SESE RAFAEL |
JOINT ATTORNEY/COMBINED PROXY |
21/07/2006 |
15 |
|
|
VICE CHAIRMAN |
09/08/2006 |
|
|
|
MEMBER OF THE BOARD |
27/07/2009 |
|
|
|
PROXY |
01/09/2009 |
|
|
|
PROXY |
17/08/2007 |
|
|
|
MEMBER OF THE BOARD |
18/07/2005 |
|
|
|
VICE CHAIRMAN |
18/07/2005 |
|
|
|
PROXY |
08/05/2001 |
|
|
|
PROXY |
15/02/2005 |
|
|
|
PROXY |
20/11/2000 |
|
|
|
PROXY |
12/04/2000 |
|
|
|
MEMBER OF THE BOARD |
20/11/1995 |
|
|
|
PROXY |
27/01/1998 |
|
|
|
PROXY |
22/09/1999 |
|
|
|
VICE CHAIRMAN |
27/07/2009 |
|
|
KANTHAK RAIMUND |
PROXY |
15/02/2005 |
3 |
|
|
JOINT ATTORNEY/COMBINED PROXY |
21/07/2006 |
|
|
|
PROXY |
17/08/2007 |
|
|
KRAUSE RAINER ERICH |
VICE CHAIRMAN |
30/01/2012 |
3 |
|
LEON CARRERAS FRANCESC |
JOINT ATTORNEY/COMBINED PROXY |
25/05/2012 |
3 |
|
|
JOINT ATTORNEY/COMBINED PROXY |
23/12/2011 |
|
|
LOTZE ANDREAS |
JOINT ATTORNEY/COMBINED PROXY |
30/05/2013 |
1 |
|
LUTZ SEEGER FRANK |
JOINT ATTORNEY/COMBINED PROXY |
01/09/2009 |
2 |
|
MARTIN PRADA ADOLFO |
MEMBER OF THE BOARD |
20/11/1995 |
12 |
|
|
PROXY |
27/01/1998 |
|
|
|
PROXY |
22/09/1999 |
|
|
|
PROXY |
12/04/2000 |
|
|
|
PROXY |
08/05/2001 |
|
|
|
PROXY |
20/11/2000 |
|
|
|
MEMBER OF THE BOARD |
18/07/2005 |
|
|
|
MEMBER OF THE BOARD |
09/08/2006 |
|
|
|
PROXY |
15/02/2005 |
|
|
|
SECRETARY |
18/07/2005 |
|
|
|
JOINT ATTORNEY/COMBINED PROXY |
21/07/2006 |
|
|
|
SECRETARY |
09/08/2006 |
|
|
MICHAEL GUSTAV BOHN |
PROXY |
17/08/2007 |
1 |
|
MONTANE DIAZ ESTHER |
PROXY |
22/09/2012 |
1 |
|
NADAL CUENCA PEDRO |
MEMBER OF THE BOARD |
27/01/1998 |
2 |
|
|
PROXY |
27/01/1998 |
|
|
OHNESORGE HANS JOACHIM |
PROXY |
12/04/2000 |
12 |
|
|
PROXY |
20/11/2000 |
|
|
|
MEMBER OF THE BOARD |
25/09/2000 |
|
|
|
MEMBER OF THE BOARD |
18/07/2005 |
|
|
|
MEMBER OF THE BOARD |
09/08/2006 |
|
|
|
PROXY |
27/01/1998 |
|
|
|
PROXY |
22/09/1999 |
|
|
|
PRESIDENT |
09/08/2006 |
|
|
|
JOINT ATTORNEY/COMBINED PROXY |
21/07/2006 |
|
|
|
PROXY |
08/05/2001 |
|
|
|
PROXY |
15/02/2005 |
|
|
|
PRESIDENT |
18/07/2005 |
|
|
PERERA MANZANEDO FERNANDO |
PROXY |
01/09/2009 |
2 |
|
|
PROXY |
14/06/2011 |
|
|
PRICE WATERHOUSE COOPERS AUDITORES SL |
ACCOUNTS' AUDITOR / HOLDER |
15/09/2011 |
4 |
|
|
ACCOUNTS' AUDITOR / HOLDER |
17/09/2012 |
|
|
|
ACCOUNTS' AUDITOR / HOLDER |
02/10/2013 |
|
|
|
ACCOUNTS' AUDITOR / HOLDER |
06/09/2010 |
|
|
PRICEWATERHOUSECOOPERS AUDITORES SL |
ACCOUNTS' AUDITOR / HOLDER |
09/09/2014 |
2 |
|
ROMERO CASTILLO JOSE MIGUEL |
PROXY |
27/01/1998 |
1 |
|
RUBENSDOERFER CLAUS |
PROXY |
18/04/2013 |
1 |
|
RUBENSDOERFER KLAUS |
PROXY |
17/08/2007 |
1 |
|
SAEZ CASAS ANTONIO |
SECRETARY |
30/01/2012 |
6 |
|
|
MEMBER OF THE BOARD |
27/07/2009 |
|
|
|
SECRETARY |
27/07/2009 |
|
|
SANPERE DIAZ ANA |
PROXY |
25/05/2012 |
1 |
|
SCHMIDT SIMON ALEXANDER |
JOINT ATTORNEY/COMBINED PROXY |
14/07/2014 |
1 |
|
SCHRODER FRANCK |
JOINT ATTORNEY/COMBINED PROXY |
22/09/2012 |
1 |
|
SCHULZE UTE DOROTHEE |
JOINT ATTORNEY/COMBINED PROXY |
22/09/2012 |
1 |
|
SCHWARK DIETMAR |
JOINT ATTORNEY/COMBINED PROXY |
22/09/2012 |
1 |
|
VALDIVIELSO BUSTO ALBERTO |
MEMBER OF THE BOARD |
27/07/2009 |
1 |
|
VAN DEL LOO THEODORUS CLEMENS MARIA |
MEMBER OF THE BOARD |
21/12/2010 |
2 |
|
|
VICE CHAIRMAN |
21/12/2010 |
|
|
VAN DER LOO THEODORUS |
PROXY |
17/08/2007 |
3 |
|
|
MEMBER OF THE BOARD |
17/08/2007 |
|
|
|
PRESIDENT |
17/08/2007 |
|
|
VILALTA DE MIGUEL DANIEL |
PROXY |
14/06/2011 |
1 |
|
WENDELBERGER VERENA |
PROXY |
21/09/2009 |
1 |
|
WIEGOLD ANDREAS |
JOINT ATTORNEY/COMBINED PROXY |
22/09/2012 |
1 |
|
WINKLER KLAUS HERBERT |
PROXY |
20/11/2000 |
4 |
|
|
PROXY |
08/05/2001 |
|
|
|
PROXY |
15/02/2005 |
|
|
|
JOINT ATTORNEY/COMBINED PROXY |
21/07/2006 |
|
|
WOZNIEWSKI THOMAS |
MEMBER OF THE BOARD |
30/01/2012 |
4 |
|
|
MEMBER OF THE BOARD |
03/09/2014 |
|
|
|
VICE CHAIRMAN |
03/09/2014 |
|
|
|
MEMBER OF THE BOARD |
05/09/2011 |
|
|
WUSSOW-MESSOW GABY |
JOINT ATTORNEY/COMBINED PROXY |
14/06/2011 |
1 |
|
ZUMBAUM ARNE |
MEMBER OF THE BOARD |
22/05/2008 |
1 |
Defaults, Legal Claims and Insolvency Proceedings
|
Section enabling assessment of the degree of compliance of the company queried
with its payment obligations. It provides information on the existence and
nature of all stages of Insolvency and Legal Proceedings published with
reference to the Company in the country's various Official Bulletins and
national newspapers, as well Defaults Registered in the main national credit
bureaus (ASNEF Industrial and RAI ).
> Summary
Chronological summary
|
|
|
Number of
Publications |
Amount (_) |
Start date |
End date |
|
Insolvency Proceedings, Bankruptcy and Suspension of Payments |
|
Unpublished |
--- |
--- |
--- |
|
Request/Declaration |
|
0 |
--- |
date |
|
|
Proceedings |
|
--- |
--- |
|
--- |
|
Resolution |
|
--- |
--- |
|
--- |
|
Defaults on debt with Financial Institutions and Large Companies |
Bank and Commercial Delinquency |
None |
0 |
|
|
|
Status: Friendly |
|
--- |
|
|
|
|
Status: Pre-Litigation |
|
--- |
|
|
|
|
Status: Litigation |
|
--- |
|
|
|
|
Status: Non-performing |
|
--- |
|
|
|
|
Status: insolvency proceedings, bankruptcy and suspension of payments |
|
--- |
|
|
|
|
Other status |
|
--- |
|
|
|
|
Legal and Administrative Proceedings |
|
1 |
--- |
21/03/2012 |
21/03/2012 |
|
Notices of defaults and enforcement |
|
1 |
--- |
|
--- |
|
Seizures |
|
--- |
--- |
|
--- |
|
Auctions |
|
--- |
--- |
|
--- |
|
Declarations of insolvency and bad debt |
|
--- |
--- |
|
--- |
|
Proceedings heard by the Civil Court |
|
Unpublished |
--- |
|
|
|
Proceedings heard by the Labour Court |
|
Unpublished |
--- |
|
|
> Details
> Basis for scoring
|
Positive Factors |
Adverse Factors |
|
No irregular payment performance has been detected based on information
obtained from credit bureaus. It is one of the major domestic companies in terms of sales volume. Significant level of financial autonomy. The asset is financed mostly
with equity and financing with maturity exceeding one year, providing a solid
financial structure. BERLIMED SA 's borrowing cost is appropriate according to its volume
of external financing sources. The development of the structure of the debt during the last two years
indicates a decrease of the debt with credit institutions and trade creditors
in respect to all liabilities. The lower the level of debt, the lower the
dependence on suppliers capital and the more guarantee will have its
financial situation. |
|
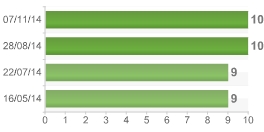
TREND OF SCORING
|
> Latest
Scoring Changes :
|
Scoring |
Evolution |
Date |
Event |
|
|
Neutral |
07/11/14 |
Modifications to the corporate group or to its relations with third
party companies. |
|
Positive |
28/08/14 |
Updating of financial statements. |
|
|
Neutral |
22/07/14 |
Updating of relevant commercial information. |
|
|
Neutral |
16/05/14 |
Updating of financial statements. |
Probability of default
|
> Estimated Probability of Default for the next 12 months:
0.199 %
|
Sector in which comparison is carried out: 464 Wholesale of household goods |
|
|
Relative Position:
|
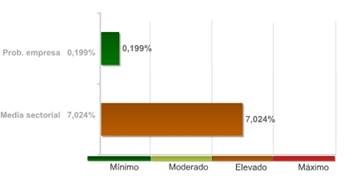
The company's comparative analysis with the rest of the companies that
comprise the sector, shows the company holds a better position with regard to
the probability of non-compliance.
The 99.00% of the companies of the sector BERLIMED SA belongs to show a
higher probability of non-compliance.
The probability of the company's non-compliance with its payment
obligations within deadlines estimated by our qualifications models is 0.199%.
In the event they fail to comply with the payment, the seriousness of
the loss will depend on factors such as the promptness of the commencement of
the charging management, the existence of executive documents which match the
credit or the existence of guarantees and free debt assets under the name of
the debtor. Therefore, the probability of non-compliance should not be solely
interpreted as the total loss of the owed amount.
Result of query submitted to the R.A.I. (Spanish Bad Debt
Register) on
|
LEGAL CLAIMS
|
|
Summary of Judicial Claims |
|
|
|
|
|
|
|
|
||
|
|
|
No se han publicado |
|
|
|
|
No se han publicado |
|
|
|
|
||
|
|
|
No se han publicado |
|
|
|
|
No se han publicado |
|
|
|
|
No se han publicado |
|
|
|
|
|
|
|
|
|
||
|
|
|
No se han publicado |
|
|
|
|
No se han publicado |
|
|
|
|
||
|
|
|
No se han publicado |
|
|
Incidences Detailed |
|
Incidences with the Local Administration |
|
|
|
Last Published Stage: |
EXECUTION NOTIFICATION |
|
Record Number: |
12073015010 |
|
Amount of the incidence: |
0,00 E |
|
Requested by: |
ADMINISTRACION LOCAL |
|
Published domicile: |
(DESCONOCIDA) |
|
Source: |
BOLETIN OFICIAL DEL AYUNTAMIENTO DE MADRID Nº6650, 2012 PAGINA 217 |
Link List
|
|
IS RELATED WITH: |
2 Entities |
|
SHAREHOLDERS: |
3 Entities |
> Shareholders
|
Relationship |
Entity |
Province |
Shareholding stake |
|
SHAREHOLDERS |
BAYER HISPANIA SL |
BARCELONA |
100 |
|
SHAREHOLDERS |
JUSTE SAQF |
|
49 |
|
|
SCHERING ESPAÑA SA |
MADRID |
51 |
> Other relationships
|
Relationship |
Entity |
Province |
Shareholding stake |
|
IS RELATED WITH |
| | |
|
|
|
|
BAYER HEALTHCARE MANUFACTURING, S.L. |
|
|
|
|
BAYER SCHERING PHARMA AG |
|
|
Turnover
|
|
|
Total Sales 2013 |
51.757.000 |
Financial Accounts and Balance Sheets
|
Financial Years
Presented
|
Ejercicio |
Tipo de Cuentas Anuales |
Fecha Presentacion |
|
2013 |
Normales |
August 2014 |
|
2012 |
Normales |
September 2013 |
|
2011 |
Normales |
July 2012 |
|
2010 |
Normales |
September 2011 |
|
2009 |
Normales |
July 2010 |
|
2008 |
Normales |
November 2009 |
|
2007 |
Normales |
October 2008 |
|
2006 |
Normales |
November 2007 |
|
2005 |
Normales |
August 2006 |
|
2004 |
Normales |
July 2005 |
|
2003 |
Normales |
December 2004 |
|
2002 |
Normales |
August 2003 |
|
2001 |
Normales |
September 2002 |
|
2000 |
Normales |
September 2001 |
|
1999 |
Consolidadas |
August 2000 |
|
1999 |
Normales |
No publicado en BORME |
|
1998 |
Normales |
September 1999 |
|
1997 |
Normales |
October 1998 |
|
1996 |
Normales |
October 1997 |
|
1995 |
Normales |
August 1996 |
The data in the
report regarding the last Company Accounts submitted by the company is taken from
the TRADE REGISTER serving the region in which the company's address is located
31/12/2013
> Balance en formato Normal de acuerdo al Nuevo Plan General
Contable 2007
Information
corresponding to the fiscal year
2013 2012 2011 2010 2009 is taken from information
submitted to the TRADE REGISTER. Data corresponding to fiscal years before
2013 2012 2011 2010 2009 has been compiled based on
the equivalence criteria stipulated in Act JUS/206/2009. Where the provisions
of the Act did not establish relevant equivalence criteria, such criteria using
its own methodology. To view details on the methodology.
|
|
ORIGINAL |
ORIGINAL |
ORIGINAL |
ORIGINAL |
ORIGINAL |
|
|
Assets |
2013 |
2012 |
2011 |
2010 |
2009 |
|
|
A) NON-CURRENT ASSETS: 11000 |
22.840.000,00 |
23.175.000,00 |
25.215.000,00 |
25.949.000,00 |
23.775.000,00 |
|
|
I. Intangible fixed assets : 11100 |
69.000,00 |
846.000,00 |
1.538.000,00 |
2.236.000,00 |
27.000,00 |
|
|
1. Development: 11110 |
0,00 |
0,00 |
0,00 |
0,00 |
0,00 |
|
|
2. Concessions: 11120 |
0,00 |
0,00 |
0,00 |
0,00 |
0,00 |
|
|
3. Patents, licencing, trade
marks and similar: 11130 |
0,00 |
0,00 |
0,00 |
0,00 |
0,00 |
|
|
4. Goodwill: 11140 |
0,00 |
0,00 |
0,00 |
0,00 |
0,00 |
|
|
5. IT applications:
11150 |
69.000,00 |
846.000,00 |
1.538.000,00 |
2.236.000,00 |
27.000,00 |
|
|
6. Investigation:
11160 |
0,00 |
0,00 |
0,00 |
0,00 |
0,00 |
|
|
7. Intellectual property:
11180 |
0,00 |
0,00 |
0,00 |
0,00 |
0,00 |
|
|
8. Greenhouse gas emission
allowance: 11190 |
0,00 |
0,00 |
0,00 |
0,00 |
0,00 |
|
|
9. Other intangible fixed
assets. : 11170 |
0,00 |
0,00 |
0,00 |
0,00 |
0,00 |
|
|
II. Tangible fixed assets : 11200 |
22.262.000,00 |
22.214.000,00 |
23.407.000,00 |
23.419.000,00 |
23.571.000,00 |
|
|
1. Land and buildings:
11210 |
12.907.000,00 |
13.273.000,00 |
11.037.000,00 |
9.529.000,00 |
9.636.000,00 |
|
|
2. Technical installations
and other tangible fixed assets: 11220 |
8.188.000,00 |
8.418.000,00 |
11.929.000,00 |
11.827.000,00 |
11.257.000,00 |
|
|
3. Tangible asset in
progress and advances: 11230 |
1.167.000,00 |
523.000,00 |
441.000,00 |
2.063.000,00 |
2.678.000,00 |
|
|
III. Real estate investment: 11300 |
0,00 |
0,00 |
0,00 |
0,00 |
0,00 |
|
|
1. Land: 11310 |
0,00 |
0,00 |
0,00 |
0,00 |
0,00 |
|
|
2. Buildings: 11320 |
0,00 |
0,00 |
0,00 |
0,00 |
0,00 |
|
|
IV. Long-term investments in Group companies and
associates : 11400 |
0,00 |
0,00 |
0,00 |
0,00 |
0,00 |
|
|
1. Equity instruments:
11410 |
0,00 |
0,00 |
0,00 |
0,00 |
0,00 |
|
|
2. Credits to businesses:
11420 |
0,00 |
0,00 |
0,00 |
0,00 |
0,00 |
|
|
3. Debt securities:
11430 |
0,00 |
0,00 |
0,00 |
0,00 |
0,00 |
|
|
4. Derivatives : 11440 |
0,00 |
0,00 |
0,00 |
0,00 |
0,00 |
|
|
5. Other financial assets :
11450 |
0,00 |
0,00 |
0,00 |
0,00 |
0,00 |
|
|
6. Other investments:
11460 |
0,00 |
0,00 |
0,00 |
0,00 |
0,00 |
|
|
V. Long-term financial investments: 11500 |
90.000,00 |
115.000,00 |
164.000,00 |
182.000,00 |
21.000,00 |
|
|
1. Equity instruments:
11510 |
0,00 |
0,00 |
0,00 |
0,00 |
0,00 |
|
|
2. Credits to third parties
: 11520 |
0,00 |
0,00 |
0,00 |
0,00 |
0,00 |
|
|
3. Debt securities:
11530 |
0,00 |
0,00 |
0,00 |
0,00 |
0,00 |
|
|
4. Derivatives : 11540 |
0,00 |
0,00 |
0,00 |
0,00 |
0,00 |
|
|
5. Other financial assets :
11550 |
90.000,00 |
115.000,00 |
164.000,00 |
182.000,00 |
21.000,00 |
|
|
6. Other investments:
11560 |
0,00 |
0,00 |
0,00 |
0,00 |
0,00 |
|
|
VI. Assets for deferred tax : 11600 |
419.000,00 |
0,00 |
106.000,00 |
112.000,00 |
156.000,00 |
|
|
VII. Non-current trade debts : 11700 |
0,00 |
0,00 |
0,00 |
0,00 |
0,00 |
|
|
B) CURRENT ASSETS: 12000 |
25.438.000,00 |
19.015.000,00 |
18.866.000,00 |
21.654.000,00 |
18.195.000,00 |
|
|
I. Non-current assets held for sale : 12100 |
0,00 |
0,00 |
0,00 |
0,00 |
0,00 |
|
|
II. Stocks: 12200 |
18.547.000,00 |
13.231.000,00 |
10.361.000,00 |
10.955.000,00 |
9.095.000,00 |
|
|
1. Commercial: 12210 |
0,00 |
0,00 |
0,00 |
0,00 |
0,00 |
|
|
2. Primary material and
other supplies: 12220 |
13.662.000,00 |
9.181.000,00 |
7.330.000,00 |
7.293.000,00 |
5.245.000,00 |
|
|
3. Work in progress:
12230 |
1.882.000,00 |
1.835.000,00 |
1.771.000,00 |
2.375.000,00 |
2.800.000,00 |
|
|
a) Of
long-term production cycle : 12231 |
0,00 |
0,00 |
0,00 |
0,00 |
0,00 |
|
|
b) Of
short-term production cycle : 12232 |
1.882.000,00 |
1.835.000,00 |
1.771.000,00 |
2.375.000,00 |
2.800.000,00 |
|
|
4. Finished goods:
12240 |
3.003.000,00 |
2.215.000,00 |
1.260.000,00 |
1.287.000,00 |
1.050.000,00 |
|
|
a) Of
long-term production cycle : 12241 |
0,00 |
0,00 |
0,00 |
0,00 |
0,00 |
|
|
b) Of
short-term production cycle : 12242 |
3.003.000,00 |
2.215.000,00 |
1.260.000,00 |
1.287.000,00 |
1.050.000,00 |
|
|
5. By-products, residues and
recycled materials: 12250 |
0,00 |
0,00 |
0,00 |
0,00 |
0,00 |
|
|
6. Advances to suppliers:
12260 |
0,00 |
0,00 |
0,00 |
0,00 |
0,00 |
|
|
III. Trade debtors and others receivable
accounts: 12300 |
6.858.000,00 |
5.743.000,00 |
8.476.000,00 |
10.662.000,00 |
9.091.000,00 |
|
|
1. Trade debtors / accounts
receivable: 12310 |
2.271.000,00 |
1.962.000,00 |
4.673.000,00 |
4.227.000,00 |
3.637.000,00 |
|
|
a)
Long-term receivables from sales and services supplied : 12311 |
0,00 |
0,00 |
0,00 |
0,00 |
0,00 |
|
|
b)
Customers for sales and provisions of services : 12312 |
2.271.000,00 |
1.962.000,00 |
4.673.000,00 |
4.227.000,00 |
3.637.000,00 |
|
|
2. Customers, Group
companies and associates : 12320 |
4.504.000,00 |
3.483.000,00 |
3.625.000,00 |
6.261.000,00 |
4.484.000,00 |
|
|
3. Other accounts
receivable: 12330 |
79.000,00 |
141.000,00 |
110.000,00 |
5.000,00 |
38.000,00 |
|
|
4. Personnel: 12340 |
2.000,00 |
18.000,00 |
30.000,00 |
43.000,00 |
177.000,00 |
|
|
5. Assets for deferred tax: 12350 |
0,00 |
0,00 |
0,00 |
0,00 |
0,00 |
|
|
6. Other debtors, including
tax and social security: 12360 |
2.000,00 |
139.000,00 |
38.000,00 |
126.000,00 |
755.000,00 |
|
|
7. Called up share capital:
12370 |
0,00 |
0,00 |
0,00 |
0,00 |
0,00 |
|
|
IV. Short-term investments in Group companies and
associates: 12400 |
0,00 |
0,00 |
0,00 |
0,00 |
0,00 |
|
|
1. Equity instruments:
12410 |
0,00 |
0,00 |
0,00 |
0,00 |
0,00 |
|
|
2. Credits to businesses:
12420 |
0,00 |
0,00 |
0,00 |
0,00 |
0,00 |
|
|
3. Debt securities:
12430 |
0,00 |
0,00 |
0,00 |
0,00 |
0,00 |
|
|
4. Derivatives : 12440 |
0,00 |
0,00 |
0,00 |
0,00 |
0,00 |
|
|
5. Other financial assets :
12450 |
0,00 |
0,00 |
0,00 |
0,00 |
0,00 |
|
|
6. Other investments:
12460 |
0,00 |
0,00 |
0,00 |
0,00 |
0,00 |
|
|
V. Short-term financial investments : 12500 |
0,00 |
0,00 |
0,00 |
0,00 |
0,00 |
|
|
1. Equity instruments:
12510 |
0,00 |
0,00 |
0,00 |
0,00 |
0,00 |
|
|
2. Credits to businesses:
12520 |
0,00 |
0,00 |
0,00 |
0,00 |
0,00 |
|
|
3. Debt securities:
12530 |
0,00 |
0,00 |
0,00 |
0,00 |
0,00 |
|
|
4. Derivatives : 12540 |
0,00 |
0,00 |
0,00 |
0,00 |
0,00 |
|
|
5. Other financial assets :
12550 |
0,00 |
0,00 |
0,00 |
0,00 |
0,00 |
|
|
6. Other investments:
12560 |
0,00 |
0,00 |
0,00 |
0,00 |
0,00 |
|
|
VI. Short-term accruals: 12600 |
33.000,00 |
41.000,00 |
27.000,00 |
35.000,00 |
0,00 |
|
|
VII. Cash and other equivalent liquid assets :
12700 |
0,00 |
0,00 |
2.000,00 |
2.000,00 |
9.000,00 |
|
|
1. Treasury: 12710 |
0,00 |
0,00 |
0,00 |
2.000,00 |
9.000,00 |
|
|
2. Other equivalent liquid
assets: 12720 |
0,00 |
0,00 |
2.000,00 |
0,00 |
0,00 |
|
|
TOTAL ASSETS (A + B) : 10000 |
48.278.000,00 |
42.190.000,00 |
44.081.000,00 |
47.603.000,00 |
41.970.000,00 |
|
|
|
ORIGINAL |
ORIGINAL |
ORIGINAL |
ORIGINAL |
ORIGINAL |
|
|
Liabilities and
Net Worth |
2013 |
2012 |
2011 |
2010 |
2009 |
|
|
A) NET WORTH: 20000 |
27.524.000,00 |
25.927.000,00 |
24.654.000,00 |
24.264.000,00 |
23.397.000,00 |
|
|
A-1) Shareholders' equity: 21000 |
27.524.000,00 |
25.927.000,00 |
24.654.000,00 |
24.264.000,00 |
23.397.000,00 |
|
|
I. Capital: 21100 |
17.489.000,00 |
17.489.000,00 |
17.489.000,00 |
17.489.000,00 |
17.489.000,00 |
|
|
1. Registered capital :
21110 |
17.489.000,00 |
17.489.000,00 |
17.489.000,00 |
17.489.000,00 |
17.489.000,00 |
|
|
2. (Uncalled capital):
21120 |
0,00 |
0,00 |
0,00 |
0,00 |
0,00 |
|
|
II. Share premium: 21200 |
0,00 |
0,00 |
0,00 |
0,00 |
0,00 |
|
|
III. Reserves: 21300 |
8.196.000,00 |
7.165.000,00 |
6.775.000,00 |
5.908.000,00 |
5.319.000,00 |
|
|
1. Legal y estatutarias:
21310 |
875.000,00 |
748.000,00 |
709.000,00 |
622.000,00 |
563.000,00 |
|
|
2. Other reserves:
21320 |
7.321.000,00 |
6.417.000,00 |
6.066.000,00 |
5.286.000,00 |
4.756.000,00 |
|
|
3. Revaluation reserves:
21330 |
0,00 |
0,00 |
0,00 |
0,00 |
0,00 |
|
|
IV. (Common stock equity): 21400 |
0,00 |
0,00 |
0,00 |
0,00 |
0,00 |
|
|
V. Results from previous periods: 21500 |
0,00 |
0,00 |
0,00 |
0,00 |
0,00 |
|
|
1. Brought forward:
21510 |
0,00 |
0,00 |
0,00 |
0,00 |
0,00 |
|
|
2. (Negative results from
previous periods): 21520 |
0,00 |
0,00 |
0,00 |
0,00 |
0,00 |
|
|
VI. Other shareholders' contributions:
21600 |
0,00 |
0,00 |
0,00 |
0,00 |
0,00 |
|
|
VII. Result of the period: 21700 |
1.839.000,00 |
1.273.000,00 |
390.000,00 |
867.000,00 |
589.000,00 |
|
|
VIII. (Interim dividend): 21800 |
0,00 |
0,00 |
0,00 |
0,00 |
0,00 |
|
|
IX. Other net worth instruments: 21900 |
0,00 |
0,00 |
0,00 |
0,00 |
0,00 |
|
|
A-2) Adjustments due to changes in value:
22000 |
0,00 |
0,00 |
0,00 |
0,00 |
0,00 |
|
|
I. Financial assets held for sale: 22100 |
0,00 |
0,00 |
0,00 |
0,00 |
0,00 |
|
|
II. Hedge operations: 22200 |
0,00 |
0,00 |
0,00 |
0,00 |
0,00 |
|
|
III. Linked non-current assets and liabilities
held for sale : 22300 |
0,00 |
0,00 |
0,00 |
0,00 |
0,00 |
|
|
IV. Exchange rate difference: 22400 |
0,00 |
0,00 |
0,00 |
0,00 |
0,00 |
|
|
V. Other: 22500 |
0,00 |
0,00 |
0,00 |
0,00 |
0,00 |
|
|
A-3) Received subsidies, donations and legacies: 23000 |
0,00 |
0,00 |
0,00 |
0,00 |
0,00 |
|
|
B) NON-CURRENT LIABILITIES: 31000 |
57.000,00 |
38.000,00 |
375.000,00 |
395.000,00 |
385.000,00 |
|
|
I. Long-term provisions: 31100 |
57.000,00 |
38.000,00 |
375.000,00 |
395.000,00 |
385.000,00 |
|
|
1. Long-term employee
benefits liability: 31110 |
57.000,00 |
38.000,00 |
375.000,00 |
395.000,00 |
385.000,00 |
|
|
2. Environmental actions:
31120 |
0,00 |
0,00 |
0,00 |
0,00 |
0,00 |
|
|
3. Restructuring provisions:
31130 |
0,00 |
0,00 |
0,00 |
0,00 |
0,00 |
|
|
4. Other provisions:
31140 |
0,00 |
0,00 |
0,00 |
0,00 |
0,00 |
|
|
II Long-term creditors: 31200 |
0,00 |
0,00 |
0,00 |
0,00 |
0,00 |
|
|
1. Liabilities and other
securities: 31210 |
0,00 |
0,00 |
0,00 |
0,00 |
0,00 |
|
|
2. Amounts owed to credit
institutions: 31220 |
0,00 |
0,00 |
0,00 |
0,00 |
0,00 |
|
|
3. Creditors from financial
leasing: 31230 |
0,00 |
0,00 |
0,00 |
0,00 |
0,00 |
|
|
4. Derivatives : 31240 |
0,00 |
0,00 |
0,00 |
0,00 |
0,00 |
|
|
5. Other financial
liabilities : 31250 |
0,00 |
0,00 |
0,00 |
0,00 |
0,00 |
|
|
III. Long-term debts with Group companies and
associates: 31300 |
0,00 |
0,00 |
0,00 |
0,00 |
0,00 |
|
|
IV. Liabilities for deferred tax: 31400 |
0,00 |
0,00 |
0,00 |
0,00 |
0,00 |
|
|
V. Long-term accruals: 31500 |
0,00 |
0,00 |
0,00 |
0,00 |
0,00 |
|
|
VI. Non-current trade creditors : 31600 |
0,00 |
0,00 |
0,00 |
0,00 |
0,00 |
|
|
VII. Special long-term debts : 31700 |
0,00 |
0,00 |
0,00 |
0,00 |
0,00 |
|
|
C) CURRENT LIABILITIES : 32000 |
20.697.000,00 |
16.225.000,00 |
19.052.000,00 |
22.944.000,00 |
18.188.000,00 |
|
|
I. Liabilities linked to non-current assets held
for sale: 32100 |
0,00 |
0,00 |
0,00 |
0,00 |
0,00 |
|
|
II. Short-term provisions: 32200 |
55.000,00 |
39.000,00 |
4.000,00 |
34.000,00 |
69.000,00 |
|
|
1. Provisions from
greenhouse gas emission allowance: 32210 |
0,00 |
0,00 |
0,00 |
0,00 |
0,00 |
|
|
2. Other provisions:
32220 |
55.000,00 |
0,00 |
0,00 |
0,00 |
0,00 |
|
|
III. Short-term creditors : 32300 |
0,00 |
2.000,00 |
0,00 |
0,00 |
0,00 |
|
|
1. Liabilities and other
securities: 32310 |
0,00 |
0,00 |
0,00 |
0,00 |
0,00 |
|
|
2. Amounts owed to credit
institutions: 32320 |
0,00 |
2.000,00 |
0,00 |
0,00 |
0,00 |
|
|
3. Creditors from financial
leasing: 32330 |
0,00 |
0,00 |
0,00 |
0,00 |
0,00 |
|
|
4. Derivatives : 32340 |
0,00 |
0,00 |
0,00 |
0,00 |
0,00 |
|
|
5. Other financial
liabilities : 32350 |
0,00 |
0,00 |
0,00 |
0,00 |
0,00 |
|
|
IV. Short-term debts with Group companies and
associates: 32400 |
13.129.000,00 |
7.297.000,00 |
14.026.000,00 |
14.921.000,00 |
11.361.000,00 |
|
|
V. Trade creditors and other accounts payable:
32500 |
7.513.000,00 |
8.887.000,00 |
5.007.000,00 |
7.950.000,00 |
6.758.000,00 |
|
|
1. Suppliers: 32510 |
3.932.000,00 |
5.684.000,00 |
2.090.000,00 |
4.042.000,00 |
3.708.000,00 |
|
|
a)
Long-term debts : 32511 |
0,00 |
0,00 |
0,00 |
0,00 |
0,00 |
|
|
b)
Short-term debts : 32512 |
3.932.000,00 |
5.684.000,00 |
2.090.000,00 |
4.042.000,00 |
3.708.000,00 |
|
|
2. Suppliers, Group
companies and associates: 32520 |
494.000,00 |
1.068.000,00 |
546.000,00 |
1.206.000,00 |
330.000,00 |
|
|
3. Other creditors:
32530 |
1.098.000,00 |
261.000,00 |
359.000,00 |
707.000,00 |
820.000,00 |
|
|
4. Personnel (remuneration
due): 32540 |
1.494.000,00 |
1.478.000,00 |
1.637.000,00 |
1.652.000,00 |
1.494.000,00 |
|
|
5. Liabilities for current
tax: 32550 |
0,00 |
0,00 |
0,00 |
0,00 |
0,00 |
|
|
6. Other accounts payable to
Public Administrations.: 32560 |
495.000,00 |
396.000,00 |
375.000,00 |
343.000,00 |
406.000,00 |
|
|
7. Advances from clients:
32570 |
0,00 |
0,00 |
0,00 |
0,00 |
0,00 |
|
|
VI. Short-term accruals: 32600 |
0,00 |
0,00 |
15.000,00 |
39.000,00 |
0,00 |
|
|
VII. Special short-term debts : 32700 |
0,00 |
0,00 |
0,00 |
0,00 |
0,00 |
|
|
TOTAL NET WORTH AND LIABILITIES (A + B + C) : 30000 |
48.278.000,00 |
42.190.000,00 |
44.081.000,00 |
47.603.000,00 |
41.970.000,00 |
|
|
|
ORIGINAL |
ORIGINAL |
ORIGINAL |
ORIGINAL |
ORIGINAL |
|
|
Profit and
Loss |
2013 |
2012 |
2011 |
2010 |
2009 |
|
|
1. Net turnover: 40100 |
51.757.000,00 |
43.021.000,00 |
38.946.000,00 |
36.562.000,00 |
36.714.000,00 |
|
|
a) Sales: 40110 |
48.795.000,00 |
40.527.000,00 |
35.628.000,00 |
36.562.000,00 |
36.714.000,00 |
|
|
b) Rendering of services: 40120 |
2.962.000,00 |
2.494.000,00 |
3.318.000,00 |
0,00 |
0,00 |
|
|
c) Income of financial nature of holding
companies: 40130 |
0,00 |
0,00 |
0,00 |
0,00 |
0,00 |
|
|
2. Changes in stocks of finished goods and work in progress:
40200 |
835.000,00 |
1.019.000,00 |
-632.000,00 |
-180.000,00 |
557.000,00 |
|
|
3. Works carried out by the company for its assets: 40300 |
0,00 |
0,00 |
0,00 |
0,00 |
0,00 |
|
|
4. Supplies : 40400 |
-26.645.000,00 |
-19.919.000,00 |
-14.584.000,00 |
-15.795.000,00 |
-17.417.000,00 |
|
|
a) Stock consumption: 40410 |
0,00 |
0,00 |
0,00 |
-16.113.000,00 |
-17.316.000,00 |
|
|
b) Consumption of raw materials and miscellaneous
consumable ones: 40420 |
-26.371.000,00 |
-19.892.000,00 |
-14.658.000,00 |
0,00 |
0,00 |
|
|
c) Works carried out by other companies:
40430 |
0,00 |
0,00 |
0,00 |
0,00 |
0,00 |
|
|
d) Impairment of stock, primary material and
other supplies: 40440 |
-274.000,00 |
-27.000,00 |
74.000,00 |
318.000,00 |
-101.000,00 |
|
|
5. Other operating income: 40500 |
126.000,00 |
55.000,00 |
225.000,00 |
4.055.000,00 |
1.196.000,00 |
|
|
a) Auxiliary income and other from current
management: 40510 |
126.000,00 |
55.000,00 |
225.000,00 |
4.055.000,00 |
1.196.000,00 |
|
|
b) Operation subsidies included in the
Period's result: 40520 |
0,00 |
0,00 |
0,00 |
0,00 |
0,00 |
|
|
6. Personnel costs: 40600 |
-13.397.000,00 |
-12.436.000,00 |
-12.962.000,00 |
-13.838.000,00 |
-12.149.000,00 |
|
|
a) Wages, salaries et al.: 40610 |
-10.046.000,00 |
-9.302.000,00 |
-9.556.000,00 |
-10.410.000,00 |
-9.102.000,00 |
|
|
b) Social security costs: 40620 |
-3.321.000,00 |
-3.101.000,00 |
-3.373.000,00 |
-3.412.000,00 |
-2.977.000,00 |
|
|
c) Provisions : 40630 |
-30.000,00 |
-33.000,00 |
-33.000,00 |
-16.000,00 |
-70.000,00 |
|
|
7. Other operating costs: 40700 |
-6.982.000,00 |
-6.787.000,00 |
-6.905.000,00 |
-7.315.000,00 |
-5.827.000,00 |
|
|
a) External services: 40710 |
-6.770.000,00 |
-6.674.000,00 |
-6.772.000,00 |
-7.052.000,00 |
-5.664.000,00 |
|
|
b) Taxes: 40720 |
-138.000,00 |
-105.000,00 |
-99.000,00 |
-131.000,00 |
-136.000,00 |
|
|
c) Losses, impairments and variation in
provisions from trade operations : 40730 |
-39.000,00 |
0,00 |
0,00 |
0,00 |
0,00 |
|
|
d) Other current management expenditure :
40740 |
-35.000,00 |
-8.000,00 |
-34.000,00 |
-132.000,00 |
-27.000,00 |
|
|
e) Expenses due to greenhouse gas emissions:
40750 |
0,00 |
0,00 |
0,00 |
0,00 |
0,00 |
|
|
8. Amortisation of fixed assets: 40800 |
-3.795.000,00 |
-3.466.000,00 |
-3.468.000,00 |
-2.485.000,00 |
-2.307.000,00 |
|
|
9. Allocation of subsidies of non-financial fixed assets and other:
40900 |
0,00 |
0,00 |
0,00 |
0,00 |
0,00 |
|
|
10. Excess provisions : 41000 |
0,00 |
0,00 |
0,00 |
0,00 |
35.000,00 |
|
|
11. Impairment and result of transfers of fixed assets: 41100 |
0,00 |
0,00 |
1.000,00 |
0,00 |
-14.000,00 |
|
|
a) Impairment and losses : 41110 |
0,00 |
0,00 |
1.000,00 |
0,00 |
-14.000,00 |
|
|
b) Results for transfers and other : 41120 |
0,00 |
0,00 |
0,00 |
0,00 |
0,00 |
|
|
c) Impairment and profit due to disposals of
assets of holding companies: 41130 |
0,00 |
0,00 |
0,00 |
0,00 |
0,00 |
|
|
12. Negative difference in combined businesses: 41200 |
0,00 |
0,00 |
0,00 |
0,00 |
0,00 |
|
|
13. Other results : 41300 |
0,00 |
0,00 |
0,00 |
0,00 |
0,00 |
|
|
A.1) OPERATING INCOME (1 + 2 + 3 + 4 + 5 + 6 + 7 + 8 + 9 + 10 + 11 + 12
+ 13) : 49100 |
1.899.000,00 |
1.487.000,00 |
621.000,00 |
1.004.000,00 |
788.000,00 |
|
|
14. Financial income : 41400 |
31.000,00 |
331.000,00 |
161.000,00 |
202.000,00 |
111.000,00 |
|
|
a) Of shares in equity instruments : 41410 |
0,00 |
0,00 |
0,00 |
0,00 |
0,00 |
|
|
a 1) In Group companies and
associates: 41411 |
0,00 |
0,00 |
0,00 |
0,00 |
0,00 |
|
|
a 2) In third parties:
41412 |
0,00 |
0,00 |
0,00 |
0,00 |
0,00 |
|
|
b) From negotiable securities and other financial
instruments : 41420 |
31.000,00 |
331.000,00 |
161.000,00 |
202.000,00 |
111.000,00 |
|
|
b 1) From Group companies
and associates : 41421 |
0,00 |
2.000,00 |
6.000,00 |
1.000,00 |
3.000,00 |
|
|
b 2) From third parties :
41422 |
31.000,00 |
329.000,00 |
155.000,00 |
201.000,00 |
108.000,00 |
|
|
c) Allocation of financial subsidies, donations
and legacies : 41430 |
0,00 |
0,00 |
0,00 |
0,00 |
0,00 |
|
|
15. Financial expenditure: 41500 |
-74.000,00 |
-251.000,00 |
-310.000,00 |
-149.000,00 |
-207.000,00 |
|
|
a) Amounts owed to Group companies and associates
: 41510 |
-74.000,00 |
-251.000,00 |
-268.000,00 |
-130.000,00 |
-201.000,00 |
|
|
b) For debts with third parties : 41520 |
0,00 |
0,00 |
-24.000,00 |
-19.000,00 |
-6.000,00 |
|
|
c) Stock renewal : 41530 |
0,00 |
0,00 |
-18.000,00 |
0,00 |
0,00 |
|
|
16. Changes in fair value of financial instruments : 41600 |
0,00 |
0,00 |
0,00 |
0,00 |
0,00 |
|
|
a) Trading book and other : 41610 |
0,00 |
0,00 |
0,00 |
0,00 |
0,00 |
|
|
b) Allocation of financial assets held for sale to
the result for the period: 41620 |
0,00 |
0,00 |
0,00 |
0,00 |
0,00 |
|
|
17. Exchange rate differences : 41700 |
66.000,00 |
-8.000,00 |
-10.000,00 |
-9.000,00 |
-3.000,00 |
|
|
18. Impairment and result for transfers of financial instruments:
41800 |
0,00 |
0,00 |
0,00 |
0,00 |
0,00 |
|
|
a) Impairment and losses : 41810 |
0,00 |
0,00 |
0,00 |
0,00 |
0,00 |
|
|
b) Results for transfers and other : 41820 |
0,00 |
0,00 |
0,00 |
0,00 |
0,00 |
|
|
19. Other financial income and expenditure: 42100 |
0,00 |
0,00 |
0,00 |
0,00 |
0,00 |
|
|
a) Incorporation of financial expenditure to
assets: 42110 |
0,00 |
0,00 |
0,00 |
0,00 |
0,00 |
|
|
b) Financial income from arrangement with
creditors: 42120 |
0,00 |
0,00 |
0,00 |
0,00 |
0,00 |
|
|
c) Other income and expenditure: 42130 |
0,00 |
0,00 |
0,00 |
0,00 |
0,00 |
|
|
A.2) FINANCIAL REVENUE (14+15+16+17+18+19) : 49200 |
23.000,00 |
72.000,00 |
-159.000,00 |
44.000,00 |
-99.000,00 |
|
|
A.3) NET RESULT BEFORE TAXES (A.1+A.2) : 49300 |
1.922.000,00 |
1.559.000,00 |
462.000,00 |
1.048.000,00 |
689.000,00 |
|
|
20. Income taxes: 41900 |
-83.000,00 |
-286.000,00 |
-72.000,00 |
-181.000,00 |
-100.000,00 |
|
|
A.4) PROFIT AFTER TAXES (A.3+20) : 49400 |
1.839.000,00 |
1.273.000,00 |
390.000,00 |
867.000,00 |
589.000,00 |
|
|
21. Result of the year coming from interrupted operations :
42000 |
0,00 |
0,00 |
0,00 |
0,00 |
0,00 |
|
|
A.5) RESULT OF THE PERIOD (A.4+21) : 49500 |
1.839.000,00 |
1.273.000,00 |
390.000,00 |
867.000,00 |
589.000,00 |
|
> Normal Balance Sheet under the rules of the 1990 General Accounting
Plan (repealed since 1st January of 2008)
Information
corresponding to the fiscal year
2013 2012 2011 2010 2009 has been compiled based on
the equivalence criteria stipulated in Act JUS/206/2009. Where the provisions
of the Act did not establish relevant equivalence criteria, such criteria using
its own methodology. To view details on the methodology
2013 2012 2011 2010 2009 is taken from information
submitted to the TRADE REGISTER.
|
|
EQUIVALENCIA |
EQUIVALENCIA |
EQUIVALENCIA |
EQUIVALENCIA |
EQUIVALENCIA |
|
|
ASSETS |
2013 |
2012 |
2011 |
2010 |
2009 |
|
|
A) SHAREHOLDERS (PARTNERS) BY UNCALLED SUSCRIBED CAPITAL: |
0,00 |
0,00 |
0,00 |
0,00 |
0,00 |
|
|
B) FIXED ASSETS: |
22.421.000,00 |
23.175.000,00 |
25.109.000,00 |
25.837.000,00 |
23.619.000,00 |
|
|
I. Formation expenses: |
0,00 |
0,00 |
0,00 |
0,00 |
0,00 |
|
|
II. Intangible fixed assets: |
69.000,00 |
846.000,00 |
1.538.000,00 |
2.236.000,00 |
27.000,00 |
|
|
1. Research and development
costs: |
0,00 |
0,00 |
0,00 |
0,00 |
0,00 |
|
|
2. Concessions, patents,
licences, trademarks et al.: |
0,00 |
0,00 |
0,00 |
0,00 |
0,00 |
|
|
3. Goodwill: |
0,00 |
0,00 |
0,00 |
0,00 |
0,00 |
|
|
4. Key money paid for
premises: |
0,00 |
0,00 |
0,00 |
0,00 |
0,00 |
|
|
5. Software: |
69.000,00 |
846.000,00 |
1.538.000,00 |
2.236.000,00 |
27.000,00 |
|
|
6. Assets under capital
leases: |
0,00 |
0,00 |
0,00 |
0,00 |
0,00 |
|
|
7. Payments on account:
|
0,00 |
0,00 |
0,00 |
0,00 |
0,00 |
|
|
8. Provisions: |
0,00 |
0,00 |
0,00 |
0,00 |
0,00 |
|
|
9. Accumulated depreciation:
|
0,00 |
0,00 |
0,00 |
0,00 |
0,00 |
|
|
III. Tangible fixed assets: |
22.262.000,00 |
22.214.000,00 |
23.407.000,00 |
23.419.000,00 |
23.571.000,00 |
|
|
1. Land and construction:
|
12.907.000,00 |
13.273.000,00 |
11.037.000,00 |
9.529.000,00 |
9.636.000,00 |
|
|
2. Technical installations
and machinery: |
4.939.020,00 |
5.077.756,00 |
7.195.599,00 |
7.134.072,00 |
6.790.247,00 |
|
|
3. Other installations,
tools and furniture: |
2.793.993,00 |
2.872.476,00 |
4.070.535,00 |
4.035.729,00 |
3.841.228,00 |
|
|
4. Payments on account and
tangible fixed assets under construction: |
1.167.000,00 |
523.000,00 |
441.000,00 |
2.063.000,00 |
2.678.000,00 |
|
|
5. Other tangible assets:
|
454.988,00 |
467.768,00 |
662.866,00 |
657.198,00 |
625.525,00 |
|
|
6. Provisions: |
0,00 |
0,00 |
0,00 |
0,00 |
0,00 |
|
|
7. Accumulated depreciation:
|
0,00 |
0,00 |
0,00 |
0,00 |
0,00 |
|
|
IV. Financial investments: |
90.000,00 |
115.000,00 |
164.000,00 |
182.000,00 |
21.000,00 |
|
|
1. Equity investments in group
companies: |
0,00 |
0,00 |
0,00 |
0,00 |
0,00 |
|
|
2. Receivables from group
companies: |
0,00 |
0,00 |
0,00 |
0,00 |
0,00 |
|
|
3. Equity investment in
associated companies: |
0,00 |
0,00 |
0,00 |
0,00 |
0,00 |
|
|
4. Credits to associated
companies: |
0,00 |
0,00 |
0,00 |
0,00 |
0,00 |
|
|
5. Long-term securities
portfolio: |
0,00 |
0,00 |
0,00 |
0,00 |
0,00 |
|
|
6. Other receivables: |
0,00 |
0,00 |
0,00 |
0,00 |
0,00 |
|
|
7. Long term guarantees and
deposits: |
90.000,00 |
115.000,00 |
164.000,00 |
182.000,00 |
21.000,00 |
|
|
8. Provisions: |
0,00 |
0,00 |
0,00 |
0,00 |
0,00 |
|
|
9. Long-term receivables
from public bodies: |
0,00 |
0,00 |
0,00 |
0,00 |
0,00 |
|
|
V. Own shares: |
0,00 |
0,00 |
0,00 |
0,00 |
0,00 |
|
|
VI. Long-term trade receivables: |
0,00 |
0,00 |
0,00 |
0,00 |
0,00 |
|
|
C) Deferred expenses: |
0,00 |
0,00 |
0,00 |
0,00 |
0,00 |
|
|
D) CURRENT ASSETS: |
25.857.000,00 |
19.015.000,00 |
18.972.000,00 |
21.766.000,00 |
18.351.000,00 |
|
|
I. Called-up share capital (not paid): |
0,00 |
0,00 |
0,00 |
0,00 |
0,00 |
|
|
II. Stocks: |
18.547.000,00 |
13.231.000,00 |
10.361.000,00 |
10.955.000,00 |
9.095.000,00 |
|
|
1. Goods for resale: |
0,00 |
0,00 |
0,00 |
0,00 |
0,00 |
|
|
2. Raw materials and other consumables:
|
13.662.000,00 |
9.181.000,00 |
7.330.000,00 |
7.293.000,00 |
5.245.000,00 |
|
|
3. Goods in process and
semifinished ones: |
1.882.000,00 |
1.835.000,00 |
1.771.000,00 |
2.375.000,00 |
2.800.000,00 |
|
|
4. Finished products: |
3.003.000,00 |
2.215.000,00 |
1.260.000,00 |
1.287.000,00 |
1.050.000,00 |
|
|
5. Byproducts, scrap and
recovered materials: |
0,00 |
0,00 |
0,00 |
0,00 |
0,00 |
|
|
6. Payments on account:
|
0,00 |
0,00 |
0,00 |
0,00 |
0,00 |
|
|
7. Provisions: |
0,00 |
0,00 |
0,00 |
0,00 |
0,00 |
|
|
III. Debtors: |
7.277.000,00 |
5.743.000,00 |
8.582.000,00 |
10.774.000,00 |
9.247.000,00 |
|
|
1. Trade debtors / accounts
receivable: |
2.271.000,00 |
1.962.000,00 |
4.673.000,00 |
4.227.000,00 |
3.637.000,00 |
|
|
2. Accounts receivable,
Group companies: |
3.209.334,00 |
2.481.819,00 |
2.583.001,00 |
4.461.288,00 |
3.195.083,00 |
|
|
3. Accounts receivable,
associated companies: |
1.294.666,00 |
1.001.181,00 |
1.041.999,00 |
1.799.712,00 |
1.288.917,00 |
|
|
4. Other debtors: |
79.000,00 |
141.000,00 |
110.000,00 |
5.000,00 |
38.000,00 |
|
|
5. Staff: |
2.000,00 |
18.000,00 |
30.000,00 |
43.000,00 |
177.000,00 |
|
|
6. Public bodies: |
421.000,00 |
139.000,00 |
144.000,00 |
238.000,00 |
911.000,00 |
|
|
7. Provisions: |
0,00 |
0,00 |
0,00 |
0,00 |
0,00 |
|
|
IV. Short-term investments: |
0,00 |
0,00 |
2.000,00 |
0,00 |
0,00 |
|
|
1. Equity investments in
group companies: |
0,00 |
0,00 |
0,00 |
0,00 |
0,00 |
|
|
2. Receivables from group
companies: |
0,00 |
0,00 |
0,00 |
0,00 |
0,00 |
|
|
3. Equity investment in
associated companies: |
0,00 |
0,00 |
0,00 |
0,00 |
0,00 |
|
|
4. Credits to associated
companies: |
0,00 |
0,00 |
0,00 |
0,00 |
0,00 |
|
|
5. Short term securities
portfolio: |
0,00 |
0,00 |
2.000,00 |
0,00 |
0,00 |
|
|
6. Other receivables: |
0,00 |
0,00 |
0,00 |
0,00 |
0,00 |
|
|
7. Shor term guarantees and
deposits: |
0,00 |
0,00 |
0,00 |
0,00 |
0,00 |
|
|
8. Provisions: |
0,00 |
0,00 |
0,00 |
0,00 |
0,00 |
|
|
V. Short-term treasury shares: |
0,00 |
0,00 |
0,00 |
0,00 |
0,00 |
|
|
VI. Cash at bank and in hand: |
0,00 |
0,00 |
0,00 |
2.000,00 |
9.000,00 |
|
|
VII. Prepayments and accrued income: |
33.000,00 |
41.000,00 |
27.000,00 |
35.000,00 |
0,00 |
|
|
GENERAL TOTAL (A + B + C + D): |
48.278.000,00 |
42.190.000,00 |
44.081.000,00 |
47.603.000,00 |
41.970.000,00 |
|
MERCANTILE
REGISTRY.
|
|
EQUIVALENCIA |
EQUIVALENCIA |
EQUIVALENCIA |
EQUIVALENCIA |
EQUIVALENCIA |
|
|
LIABILITIES |
2013 |
2012 |
2011 |
2010 |
2009 |
|
|
A) EQUITY: |
27.524.000,00 |
25.927.000,00 |
24.654.000,00 |
24.264.000,00 |
23.397.000,00 |
|
|
I. Subscribed capital: |
17.489.000,00 |
17.489.000,00 |
17.489.000,00 |
17.489.000,00 |
17.489.000,00 |
|
|
II. Share premium: |
0,00 |
0,00 |
0,00 |
0,00 |
0,00 |
|
|
III. Revaluation reserves: |
0,00 |
0,00 |
0,00 |
0,00 |
0,00 |
|
|
IV. Reserves: |
8.196.000,00 |
7.165.000,00 |
6.775.000,00 |
5.908.000,00 |
5.319.000,00 |
|
|
1. Legal reserve: |
875.000,00 |
748.000,00 |
709.000,00 |
622.000,00 |
563.000,00 |
|
|
2. Reserves for own shares:
|
0,00 |
0,00 |
0,00 |
0,00 |
0,00 |
|
|
3. Reserves for shares of
the controlling company: |
0,00 |
0,00 |
0,00 |
0,00 |
0,00 |
|
|
4. Statutory reserves:
|
0,00 |
0,00 |
0,00 |
0,00 |
0,00 |
|
|
5. Miscellaneous reserves:
|
7.321.000,00 |
6.417.000,00 |
6.066.000,00 |
5.286.000,00 |
4.756.000,00 |
|
|
Differences due to capital
adjustement to euros: |
0,00 |
0,00 |
0,00 |
0,00 |
0,00 |
|
|
V. Profit or loss brought forward: |
0,00 |
0,00 |
0,00 |
0,00 |
0,00 |
|
|
1. Retained earnings: |
0,00 |
0,00 |
0,00 |
0,00 |
0,00 |
|
|
2. Prior year losses: |
0,00 |
0,00 |
0,00 |
0,00 |
0,00 |
|
|
3. Partners'
contributions so as to compensate losses: |
0,00 |
0,00 |
0,00 |
0,00 |
0,00 |
|
|
VI. Profit or loss for the financial year: |
1.839.000,00 |
1.273.000,00 |
390.000,00 |
867.000,00 |
589.000,00 |
|
|
VII. Interim dividend paid: |
0,00 |
0,00 |
0,00 |
0,00 |
0,00 |
|
|
VIII. Own shares for capital reduction: |
0,00 |
0,00 |
0,00 |
0,00 |
0,00 |
|
|
B) Deferred income: |
0,00 |
0,00 |
0,00 |
0,00 |
0,00 |
|
|
1. Capital grants: |
0,00 |
0,00 |
0,00 |
0,00 |
0,00 |
|
|
2. Unrealised exchange
gains: |
0,00 |
0,00 |
0,00 |
0,00 |
0,00 |
|
|
3. Other deferred income:
|
0,00 |
0,00 |
0,00 |
0,00 |
0,00 |
|
|
4. Public revenues to
distribute in several financial years: |
0,00 |
0,00 |
0,00 |
0,00 |
0,00 |
|
|
C) PROVISIONS FOR LIABILITIES AND CHARGES: |
57.000,00 |
38.000,00 |
375.000,00 |
395.000,00 |
385.000,00 |
|
|
1. Provisions for pension
fund and other similar obligations: |
57.000,00 |
38.000,00 |
375.000,00 |
395.000,00 |
385.000,00 |
|
|
2. Provisions for taxes:
|
0,00 |
0,00 |
0,00 |
0,00 |
0,00 |
|
|
3. Other provisions: |
0,00 |
0,00 |
0,00 |
0,00 |
0,00 |
|
|
4. Reversion fund: |
0,00 |
0,00 |
0,00 |
0,00 |
0,00 |
|
|
D) LONG TERM LIABILITIES: |
0,00 |
0,00 |
0,00 |
0,00 |
0,00 |
|
|
I. Issued debentures and other marketable
securities: |
0,00 |
0,00 |
0,00 |
0,00 |
0,00 |
|
|
1. Non-convertible
debentures: |
0,00 |
0,00 |
0,00 |
0,00 |
0,00 |
|
|
2. Convertible debentures:
|
0,00 |
0,00 |
0,00 |
0,00 |
0,00 |
|
|
3. Other debt securities:
|
0,00 |
0,00 |
0,00 |
0,00 |
0,00 |
|
|
II. Amounts owed to credit institutions: |
0,00 |
0,00 |
0,00 |
0,00 |
0,00 |
|
|
1. Loans and other
liabilities: |
0,00 |
0,00 |
0,00 |
0,00 |
0,00 |
|
|
2. Long-term liabilities
from capital leases: |
0,00 |
0,00 |
0,00 |
0,00 |
0,00 |
|
|
III. Debts with companies of the group and
affiliated ones: |
0,00 |
0,00 |
0,00 |
0,00 |
0,00 |
|
|
1. Amounts owed to group
companies: |
0,00 |
0,00 |
0,00 |
0,00 |
0,00 |
|
|
2. Amounts owed to
associated companies: |
0,00 |
0,00 |
0,00 |
0,00 |
0,00 |
|
|
IV. Other creditors: |
0,00 |
0,00 |
0,00 |
0,00 |
0,00 |
|
|
1. Long-term bills of
exchange payable: |
0,00 |
0,00 |
0,00 |
0,00 |
0,00 |
|
|
2. Other creditors: |
0,00 |
0,00 |
0,00 |
0,00 |
0,00 |
|
|
3. Long term guarantees and
deposits received: |
0,00 |
0,00 |
0,00 |
0,00 |
0,00 |
|
|
4. Long term payables to
public bodies: |
0,00 |
0,00 |
0,00 |
0,00 |
0,00 |
|
|
V. Unpaid portion of equity investment: |
0,00 |
0,00 |
0,00 |
0,00 |
0,00 |
|
|
1. Group companies: |
0,00 |
0,00 |
0,00 |
0,00 |
0,00 |
|
|
2. Associated companies:
|
0,00 |
0,00 |
0,00 |
0,00 |
0,00 |
|
|
3. Third parties: |
0,00 |
0,00 |
0,00 |
0,00 |
0,00 |
|
|
VI. Long term trade creditors: |
0,00 |
0,00 |
0,00 |
0,00 |
0,00 |
|
|
E) SHORT TERM CREDITORS: |
20.642.000,00 |
16.186.000,00 |
19.048.000,00 |
22.910.000,00 |
18.119.000,00 |
|
|
I. Issued debentures and other marketable
securities: |
0,00 |
0,00 |
0,00 |
0,00 |
0,00 |
|
|
1. Non-convertible
debentures: |
0,00 |
0,00 |
0,00 |
0,00 |
0,00 |
|
|
2. Convertible debentures:
|
0,00 |
0,00 |
0,00 |
0,00 |
0,00 |
|
|
3. Other debt securities:
|
0,00 |
0,00 |
0,00 |
0,00 |
0,00 |
|
|
4. Accrued interest on
debentures and other debt securities: |
0,00 |
0,00 |
0,00 |
0,00 |
0,00 |
|
|
II. Amounts owed to credit institutions: |
0,00 |
2.000,00 |
0,00 |
0,00 |
0,00 |
|
|
1. Loans and other liabilities:
|
0,00 |
2.000,00 |
0,00 |
0,00 |
0,00 |
|
|
2. Accrued interest on
liabilities with credit institutions: |
0,00 |
0,00 |
0,00 |
0,00 |
0,00 |
|
|
3. Short-term liabilities
from capital leases: |
0,00 |
0,00 |
0,00 |
0,00 |
0,00 |
|
|
III. Short-term amounts owed to group and
associated companies: |
13.623.000,00 |
8.365.000,00 |
14.572.000,00 |
16.127.000,00 |
11.691.000,00 |
|
|
1. Amounts owed to group
companies: |
13.623.000,00 |
8.365.000,00 |
14.572.000,00 |
16.127.000,00 |
11.691.000,00 |
|
|
2. Amounts owed to
associated companies: |
0,00 |
0,00 |
0,00 |
0,00 |
0,00 |
|
|
IV. Trade creditors: |
5.030.000,00 |
5.945.000,00 |
2.449.000,00 |
4.749.000,00 |
4.528.000,00 |
|
|
1. Advanced payments from
customers: |
0,00 |
0,00 |
0,00 |
0,00 |
0,00 |
|
|
2. Amounts owed for
purchases of goods or services: |
5.030.000,00 |
5.945.000,00 |
2.449.000,00 |
4.749.000,00 |
4.528.000,00 |
|
|
3. Debts represented by
notes payable: |
0,00 |
0,00 |
0,00 |
0,00 |
0,00 |
|
|
V. Other creditors: |
1.989.000,00 |
1.874.000,00 |
2.012.000,00 |
1.995.000,00 |
1.900.000,00 |
|
|
1. Public bodies: |
495.000,00 |
396.000,00 |
375.000,00 |
343.000,00 |
406.000,00 |
|
|
2. Bills of exchange
payable: |
0,00 |
0,00 |
0,00 |
0,00 |
0,00 |
|
|
3. Miscellaneous debts:
|
0,00 |
0,00 |
0,00 |
0,00 |
0,00 |
|
|
4. Wages and salaries
payable: |
1.494.000,00 |
1.478.000,00 |
1.637.000,00 |
1.652.000,00 |
1.494.000,00 |
|
|
5. Guarantees and deposits received
at short term: |
0,00 |
0,00 |
0,00 |
0,00 |
0,00 |
|
|
VI. Provisions: |
0,00 |
0,00 |
0,00 |
0,00 |
0,00 |
|
|
VII. Prepayments and accrued income: |
0,00 |
0,00 |
15.000,00 |
39.000,00 |
0,00 |
|
|
F) SHORT-TERM PROVISIONS FOR LIABILITIES AND CHARGES: |
55.000,00 |
39.000,00 |
4.000,00 |
34.000,00 |
69.000,00 |
|
|
GENERAL TOTAL (A + B + C + D + E + F): |
48.278.000,00 |
42.190.000,00 |
44.081.000,00 |
47.603.000,00 |
41.970.000,00 |
|
MERCANTILE
REGISTRY.
|
|
EQUIVALENCIA |
EQUIVALENCIA |
EQUIVALENCIA |
EQUIVALENCIA |
EQUIVALENCIA |
|
|
DEBIT |
2013 |
2012 |
2011 |
2010 |
2009 |
|
|
A) CHARGES (A.1 to A.15): |
50.976.000,00 |
43.153.000,00 |
38.942.000,00 |
39.952.000,00 |
38.024.000,00 |
|
|
A.1. Stock reduction of both
manufactured goods and the ones in process: |
0,00 |
0,00 |
632.000,00 |
180.000,00 |
0,00 |
|
|
A.2. Supplies: |
26.371.000,00 |
19.892.000,00 |
14.658.000,00 |
16.113.000,00 |
17.316.000,00 |
|
|
a)
Stock consumption: |
0,00 |
0,00 |
0,00 |
16.113.000,00 |
17.316.000,00 |
|
|
b)
Consumption of raw materials and miscellaneous consumable ones: |
26.371.000,00 |
19.892.000,00 |
14.658.000,00 |
0,00 |
0,00 |
|
|
c)
Miscellaneous external expenditure: |
0,00 |
0,00 |
0,00 |
0,00 |
0,00 |
|
|
A.3. Staff costs: |
13.397.000,00 |
12.436.000,00 |
12.962.000,00 |
13.838.000,00 |
12.149.000,00 |
|
|
a)
Wages, salaries et al.: |
10.076.000,00 |
9.335.000,00 |
9.589.000,00 |
10.426.000,00 |
9.172.000,00 |
|
|
b)
Social security costs: |
3.321.000,00 |
3.101.000,00 |
3.373.000,00 |
3.412.000,00 |
2.977.000,00 |
|
|
A.4. Depreciation expense:
|
3.795.000,00 |
3.466.000,00 |
3.468.000,00 |
2.485.000,00 |
2.307.000,00 |
|
|
A.5. Variation of trade provisions
and losses of unrecovered receivables: |
313.000,00 |
27.000,00 |
-74.000,00 |
-318.000,00 |
101.000,00 |
|
|
a)
Stock provision variation: |
274.000,00 |
27.000,00 |
-74.000,00 |
-318.000,00 |
101.000,00 |
|
|
b)
Variation in provision and bad debt losses: |
0,00 |
0,00 |
0,00 |
0,00 |
0,00 |
|
|
c)
Variation of other trade provisions: |
39.000,00 |
0,00 |
0,00 |
0,00 |
0,00 |
|
|
A.6. Other operating
charges: |
6.943.000,00 |
6.787.000,00 |
6.905.000,00 |
7.315.000,00 |
5.827.000,00 |
|
|
a)
External services: |
6.770.000,00 |
6.674.000,00 |
6.772.000,00 |
7.052.000,00 |
5.664.000,00 |
|
|
b)
Taxes: |
138.000,00 |
105.000,00 |
99.000,00 |
131.000,00 |
136.000,00 |
|
|
c)
Other operating expenses: |
35.000,00 |
8.000,00 |
34.000,00 |
132.000,00 |
27.000,00 |
|
|
d) Allocation
to revision fund: |
0,00 |
0,00 |
0,00 |
0,00 |
0,00 |
|
|
A.I. OPERATING BENEFITS
(B.1+B.2+B.3+B.4-A.1-A.2-A.3-A.4-A.5-A.6): |
1.899.000,00 |
1.487.000,00 |
620.000,00 |
1.004.000,00 |
802.000,00 |
|
|
A.7. Financial and similar
charges: |
74.000,00 |
251.000,00 |
310.000,00 |
149.000,00 |
207.000,00 |
|
|
a) Due
to liabilities with companies of the group: |
74.000,00 |
251.000,00 |
268.000,00 |
130.000,00 |
201.000,00 |
|
|
b) Due
to liabilities with associated companies: |
0,00 |
0,00 |
0,00 |
0,00 |
0,00 |
|
|
c) Due
to other debts.: |
0,00 |
0,00 |
42.000,00 |
19.000,00 |
6.000,00 |
|
|
d) Losses
from financial investments: |
0,00 |
0,00 |
0,00 |
0,00 |
0,00 |
|
|
A.8. Changes in financial
investment provisions: |
0,00 |
0,00 |
0,00 |
0,00 |
0,00 |
|
|
A.9. Exchange losses: |
0,00 |
8.000,00 |
10.000,00 |
9.000,00 |
3.000,00 |
|
|
A.II. NET FINANCIAL INCOME
(B.5+B.6+B.7+B.8-A.7-A.8-A.9): |
23.000,00 |
72.000,00 |
0,00 |
44.000,00 |
0,00 |
|
|
A.III. PROFIT FROM ORDINARY ACTIVITIES
(A.I+A.II-B.I-B.II): |
1.922.000,00 |
1.559.000,00 |
461.000,00 |
1.048.000,00 |
703.000,00 |
|
|
A.10. Changes in provisions
for intangible, tangible and securities portfolio: |
0,00 |
0,00 |
-1.000,00 |
0,00 |
14.000,00 |
|
|
A.11. Losses from tangible and
intangible fixed assets and securities portfolio: |
0,00 |
0,00 |
0,00 |
0,00 |
0,00 |
|
|
A.12. Losses from
transactions with own shares and debentures: |
0,00 |
0,00 |
0,00 |
0,00 |
0,00 |
|
|
A.13. Extraordinary
expenses: |
0,00 |
0,00 |
0,00 |
0,00 |
0,00 |
|
|
A.14. Expenses and losses of
former financial years: |
0,00 |
0,00 |
0,00 |
0,00 |
0,00 |
|
|
A.IV. EXTRAORDINARY PROFIT (B.9+B.10+B.11+B.12+B.13-A.10-A.11-A.12-A.13-A.14):
|
0,00 |
0,00 |
1.000,00 |
0,00 |
0,00 |
|
|
A.V. PROFIT BEFORE TAXES (A.III+A.IV-B.III-B.IV):
|
1.922.000,00 |
1.559.000,00 |
462.000,00 |
1.048.000,00 |
689.000,00 |
|
|
A.15. Corporation tax:
|
83.000,00 |
286.000,00 |
72.000,00 |
181.000,00 |
100.000,00 |
|
|
A.16. Miscellaneous taxes:
|
0,00 |
0,00 |
0,00 |
0,00 |
0,00 |
|
|
A.VI. FINANCIAL YEAR RESULTS (PROFIT)
(A.V-A.15-A.16): |
1.839.000,00 |
1.273.000,00 |
390.000,00 |
867.000,00 |
589.000,00 |
|
MERCANTILE
REGISTRY.
|
|
EQUIVALENCIA |
EQUIVALENCIA |
EQUIVALENCIA |
EQUIVALENCIA |
EQUIVALENCIA |
|
|
CREDIT |
2013 |
2012 |
2011 |
2010 |
2009 |
|
|
B) INCOME ( B.1 to B.13): |
52.815.000,00 |
44.426.000,00 |
39.332.000,00 |
40.819.000,00 |
38.613.000,00 |
|
|
B.1. Net total sales: |
51.757.000,00 |
43.021.000,00 |
38.946.000,00 |
36.562.000,00 |
36.714.000,00 |
|
|
a)
Sales: |
48.795.000,00 |
40.527.000,00 |
35.628.000,00 |
36.562.000,00 |
36.714.000,00 |
|
|
b)
Rendering of services: |
2.962.000,00 |
2.494.000,00 |
3.318.000,00 |
0,00 |
0,00 |
|
|
Returns
and Rappel on sales: |
0,00 |
0,00 |
0,00 |
0,00 |
0,00 |
|
|
B.2. Stock increase of
manufactured goods and products in process: |
835.000,00 |
1.019.000,00 |
0,00 |
0,00 |
557.000,00 |
|
|
B.3. Works performed by the
company for fixed assets: |
0,00 |
0,00 |
0,00 |
0,00 |
0,00 |
|
|
B.4. Miscellaneous operating
income: |
126.000,00 |
55.000,00 |
225.000,00 |
4.055.000,00 |
1.231.000,00 |
|
|
a) Auxiliary
income and other from current management: |
126.000,00 |
55.000,00 |
225.000,00 |
4.055.000,00 |
1.196.000,00 |
|
|
b)
Grants: |
0,00 |
0,00 |
0,00 |
0,00 |
0,00 |
|
|
c) Liabilities
and charges provisions surplus: |
0,00 |
0,00 |
0,00 |
0,00 |
35.000,00 |
|
|
B.I. PÉRDIDAS DE EXPLOTACIÓN
(A.1+A.2+A.3+A.4+A.5-A.6-B.1-B.2-B.3-B.4): |
0,00 |
0,00 |
0,00 |
0,00 |
0,00 |
|
|
B.5. Income from equity
investment: |
0,00 |
0,00 |
0,00 |
0,00 |
0,00 |
|
|
a) In
companies of the group: |
0,00 |
0,00 |
0,00 |
0,00 |
0,00 |
|
|
b) In
associated companies: |
0,00 |
0,00 |
0,00 |
0,00 |
0,00 |
|
|
c)
Third parties: |
0,00 |
0,00 |
0,00 |
0,00 |
0,00 |
|
|
B.6. Income from other
marketable securities and long-term receivables: |
0,00 |
0,00 |
0,00 |
0,00 |
0,00 |
|
|
a) From
companies of the group: |
0,00 |
0,00 |
0,00 |
0,00 |
0,00 |
|
|
b) From
associated companies: |
0,00 |
0,00 |
0,00 |
0,00 |
0,00 |
|
|
c) From
companies out of the group: |
0,00 |
0,00 |
0,00 |
0,00 |
0,00 |
|
|
B.7. Miscellaneous interests
or similar income: |
31.000,00 |
331.000,00 |
161.000,00 |
202.000,00 |
111.000,00 |
|
|
a) From
companies of the group: |
0,00 |
2.000,00 |
6.000,00 |
1.000,00 |
3.000,00 |
|
|
b) From
associated companies: |
0,00 |
0,00 |
0,00 |
0,00 |
0,00 |
|
|
c)
Miscellaneous interests: |
31.000,00 |
329.000,00 |
155.000,00 |
201.000,00 |
108.000,00 |
|
|
d)
Profit on financial investment: |
0,00 |
0,00 |
0,00 |
0,00 |
0,00 |
|
|
B.8. Exchange positive
differences: |
66.000,00 |
0,00 |
0,00 |
0,00 |
0,00 |
|
|
B.II. NEGATIVE FINANCIAL RESULTS (A.7+A.8+A.9-B.5-B.6-B.7-B.8):
|
0,00 |
0,00 |
159.000,00 |
0,00 |
99.000,00 |
|
|
B.III. LOSSES ON ORDINARY ACTIVITIES ( B.I + B.II
- A.I - A.II ): |
0,00 |
0,00 |
0,00 |
0,00 |
0,00 |
|
|
B.9.Profit on disposal of both
tangible and intangible fixed assets and securities portfolio: |
0,00 |
0,00 |
0,00 |
0,00 |
0,00 |
|
|
B.10. Profit on transactions
with own shares and debentures: |
0,00 |
0,00 |
0,00 |
0,00 |
0,00 |
|
|
B.11. Capital grants
transferred to profit and loss: |
0,00 |
0,00 |
0,00 |
0,00 |
0,00 |
|
|
B.12. Extraordinary income:
|
0,00 |
0,00 |
0,00 |
0,00 |
0,00 |
|
|
B.13. Income and profit of
former financial years: |
0,00 |
0,00 |
0,00 |
0,00 |
0,00 |
|
|
B.IV. NEGATIVE EXTRAORDINARY RESULTS
(A.10+A.11+A.12+A.13+A.14-B.9-B.10-B.11-B.12-B.13): |
0,00 |
0,00 |
0,00 |
0,00 |
14.000,00 |
|
|
B.V. LOSSES BEFORE TAXES (B.III+B.IV-A.III-A.IV):
|
0,00 |
0,00 |
0,00 |
0,00 |
0,00 |
|
|
B.VI. RESULT OF THE PERIOD (LOSSES)
(B.V+A.15+A.16): |
0,00 |
0,00 |
0,00 |
0,00 |
0,00 |
|
MERCANTILE
REGISTRY.
CASHFLOW STATEMENT
|
Model: Normal
> Source of information: Data contained in this section is taken from
the information declared in the Annual Accounts submitted to the Trade
Register.
|
|
2013 |
2012 |
2011 |
2010 |
2009 |
|
|
1. Fiscal year result before taxes.: 61100 |
1.922.000,00 |
1.559.000,00 |
462.000,00 |
1.048.000,00 |
689.000,00 |
|
|
2. Results adjustments.: 61200 |
4.114.000,00 |
3.402.000,00 |
3.676.000,00 |
2.089.000,00 |
2.686.000,00 |
|
|
a) Fixed Assets Amortization (+).: 61201 |
3.795.000,00 |
3.466.000,00 |
3.468.000,00 |
2.485.000,00 |
2.307.000,00 |
|
|
b) Obsolescence Allowances (+/-). : 61202 |
326.000,00 |
-27.000,00 |
79.000,00 |
-318.000,00 |
101.000,00 |
|
|
c) Variation in Provision (+/-). : 61203 |
16.000,00 |
35.000,00 |
-30.000,00 |
-25.000,00 |
160.000,00 |
|
|
e) Results on disposal of fixed assets (+/-). :
61205 |
0,00 |
0,00 |
0,00 |
0,00 |
22.000,00 |
|
|
g) Financial income (-).: 61207 |
-31.000,00 |
-331.000,00 |
-161.000,00 |
-202.000,00 |
-111.000,00 |
|
|
h) Financial Expenses (+). : 61208 |
74.000,00 |
251.000,00 |
310.000,00 |
149.000,00 |
207.000,00 |
|
|
i) Exchange differences (+/-). : 61209 |
-66.000,00 |
8.000,00 |
10.000,00 |
0,00 |
0,00 |
|
|
3. Changes in current capital equity.: 61300 |
-8.497.000,00 |
3.445.000,00 |
-270.000,00 |
-1.917.000,00 |
3.313.000,00 |
|
|
a) Stock (+/-).: 61301 |
-5.603.000,00 |
-2.843.000,00 |
515.000,00 |
-1.542.000,00 |
-1.197.000,00 |
|
|
d) Debtors and other accounts receivable (+/-). :
61302 |
-1.088.000,00 |
2.725.000,00 |
2.176.000,00 |
-1.571.000,00 |
2.930.000,00 |
|
|
c) Other current assets (+/-). : 61303 |
8.000,00 |
-14.000,00 |
8.000,00 |
-35.000,00 |
22.000,00 |
|
|
d) Creditors and other accounts payable (+/-). :
61304 |
-1.374.000,00 |
3.880.000,00 |
-2.943.000,00 |
1.192.000,00 |
1.558.000,00 |
|
|
e) Other current liabilities (+/-).: 61305 |
0,00 |
-15.000,00 |
-24.000,00 |
39.000,00 |
0,00 |
|
|
f) Other non-current assets and liabilities
(+/-).: 61306 |
-440.000,00 |
-288.000,00 |
-2.000,00 |
0,00 |
0,00 |
|
|
4. Other cash flows for operating activities.: 61400 |
-636.000,00 |
-100.000,00 |
-215.000,00 |
-84.000,00 |
-491.000,00 |
|
|
a) Interest payments (-). : 61401 |
-74.000,00 |
-251.000,00 |
-310.000,00 |
-149.000,00 |
-207.000,00 |
|
|
c) Interest collection (+). : 61403 |
31.000,00 |
331.000,00 |
161.000,00 |
202.000,00 |
111.000,00 |
|
|
d) Income tax payment collection (payments)
(+/-).: 61404 |
-593.000,00 |
-180.000,00 |
-66.000,00 |
-109.000,00 |
-395.000,00 |
|
|
e) Other payments (payment collection) (-/+) :
61405 |
0,00 |
0,00 |
0,00 |
-28.000,00 |
0,00 |
|
|
5. Operating activity cash flows (1 + 2 + 3 + 4) : 61500 |
-3.097.000,00 |
8.306.000,00 |
3.653.000,00 |
1.136.000,00 |
6.197.000,00 |
|
|
6. Payments for investment (-).: 62100 |
-2.297.000,00 |
-1.582.000,00 |
-2.758.000,00 |
-4.978.000,00 |
-4.168.000,00 |
|
|
b) Intangible fixed assets. : 62102 |
-14.000,00 |
-79.000,00 |
-54.000,00 |
-11.000,00 |
0,00 |
|
|
c) Fixed assets. : 62103 |
-2.263.000,00 |
-1.503.000,00 |
-2.704.000,00 |
-4.806.000,00 |
-4.168.000,00 |
|
|
e) Other financial assets. : 62105 |
-20.000,00 |
0,00 |
0,00 |
-161.000,00 |
0,00 |
|
|
7. Divestment payment collection (+). : 62200 |
54.000,00 |
1.000,00 |
0,00 |
275.000,00 |
20.000,00 |
|
|
b) Intangible fixed assets. : 62202 |
0,00 |
0,00 |
0,00 |
1.000,00 |
0,00 |
|
|
c) Fixed assets. : 62203 |
9.000,00 |
1.000,00 |
0,00 |
274.000,00 |
20.000,00 |
|
|
e) Other financial assets. : 62205 |
45.000,00 |
0,00 |
0,00 |
0,00 |
0,00 |
|
|
8. Investment activity cash flows (6 + 7) minus Amortization:
62300 |
-2.243.000,00 |
-1.581.000,00 |
-2.758.000,00 |
-4.703.000,00 |
-4.148.000,00 |
|
|
9. Payment collection and payments for equity instruments. :
63100 |
0,00 |
0,00 |
0,00 |
0,00 |
0,00 |
|
|
10. Payment collection and payments for financial liabilities
instruments.: 63200 |
6.340.000,00 |
-6.727.000,00 |
-895.000,00 |
3.560.000,00 |
-2.045.000,00 |
|
|
a) Issuance : 63201 |
6.340.000,00 |
2.000,00 |
0,00 |
0,00 |
0,00 |
|
|
2. Debts incurred with credit institutions (+). :
63203 |
0,00 |
2.000,00 |
0,00 |
0,00 |
0,00 |
|
|
3. Debts incurred with companies of the group and
affiliates (+).: 63204 |
6.340.000,00 |
0,00 |
0,00 |
0,00 |
0,00 |
|
|
b) Repayment and amortization of : 63207 |
0,00 |
-6.729.000,00 |
-895.000,00 |
3.560.000,00 |
-2.045.000,00 |
|
|
3. Debts incurred with companies of the group and
affiliates (-). : 63210 |
0,00 |
-6.729.000,00 |
-895.000,00 |
3.560.000,00 |
-2.034.000,00 |
|
|
5. Other debts (-). : 63212 |
0,00 |
0,00 |
0,00 |
0,00 |
-10.000,00 |
|
|
11. Payments from dividends and remunerations from other assets
instruments. : 63300 |
-1.000.000,00 |
0,00 |
0,00 |
0,00 |
0,00 |
|
|
a) Dividends (-).: 63301 |
-1.000.000,00 |
0,00 |
0,00 |
0,00 |
0,00 |
|
|
12. Cash flows for financing activities (9+10+11).: 63400 |
5.340.000,00 |
-6.727.000,00 |
-895.000,00 |
3.560.000,00 |
-2.045.000,00 |
|
|
D) EFFECT OF EXCHANGE RATE CHANGES: 64000 |
0,00 |
0,00 |
0,00 |
0,00 |
0,00 |
|
|
E) NET INCREASE/DECREASE OF CASH OR EQUIVALENT ASSETS
(+/-5+/-8+/12+/-D) : 65000 |
0,00 |
-2.000,00 |
0,00 |
-7.000,00 |
4.000,00 |
|
|
Cash or equivalent assets as of beginning of the
fiscal year.: 65100 |
0,00 |
2.000,00 |
0,00 |
9.000,00 |
5.000,00 |
|
|
Cash or equivalent assets as of end of the fiscal
year.: 65200 |
0,00 |
0,00 |
0,00 |
2.000,00 |
9.000,00 |
|
FINANCIAL DIAGNOSIS
|
> Economic-Financial Comparative Analysis
Data used in the following ratios and indicators is taken from the
Annual Accounts submitted by the company to the TRADE REGISTER.
> Comparison within the Sector
|
Cash Flow |
2013 |
2012 |
Variación 2013 -
2012 |
|
|||
|
|
Empresa |
Sector |
Empresa |
Sector |
Empresa |
Sector |
|
|
Cash Flow over Sales: |
0,00 % |
0,02 % |
0,00 % |
0,01 % |
|
173,51 % |
|
|
EBITDA over Sales: |
11,00 % |
10,23 % |
11,51 % |
9,25 % |
-4,44 % |
10,56 % |
|
|
Cash Flow Yield: |
0,00 % |
0,01 % |
0,00 % |
0,00 % |
|
|
|
|
Profitability |
2013 |
2012 |
Variación 2013 -
2012 |
|
|||
|
|
Empresa |
Sector |
Empresa |
Sector |
Empresa |
Sector |
|
|
Operating economic profitability: |
3,94 % |
6,60 % |
3,53 % |
5,25 % |
11,51 % |
25,83 % |
|
|
Total economic profitability: |
4,13 % |
3,61 % |
4,29 % |
2,50 % |
-3,63 % |
44,33 % |
|
|
Financial profitability: |
6,68 % |
4,30 % |
4,91 % |
1,32 % |
36,08 % |
224,86 % |
|
|
Margin: |
3,66 % |
6,01 % |
3,45 % |
4,87 % |
6,03 % |
23,54 % |
|
|
Mark-up: |
3,70 % |
4,02 % |
3,62 % |
1,60 % |
2,36 % |
151,36 % |
|
|
Solvency |
2013 |
2012 |
Variación 2013 -
2012 |
|
|||
|
|
Empresa |
Sector |
Empresa |
Sector |
Empresa |
Sector |
|
|
Liquidity: |
0,00 |
0,14 |
0,00 |
0,12 |
|
20,17 |
|
|
Acid Test: |
0,33 |
0,86 |
0,35 |
0,85 |
-6,36 |
0,75 |
|
|
Working Capital / Investment: |
0,10 |
0,02 |
0,07 |
0,03 |
48,50 |
-15,91 |
|
|
Solvency: |
1,25 |
1,17 |
1,17 |
1,17 |
6,63 |
-0,40 |
|
|
Indebtedness |
2013 |
2012 |
Variación 2013 -
2012 |
|
|||
|
|
Empresa |
Sector |
Empresa |
Sector |
Empresa |
Sector |
|
|
Indebtedness level: |
0,75 |
1,42 |
0,62 |
1,63 |
20,06 |
-12,60 |
|
|
Borrowing Composition: |
0,00 |
1,02 |
0,00 |
1,03 |
|
-1,45 |
|
|
Repayment Ability: |
|
60,31 |
-8.093,00 |
179,96 |
|
-66,49 |
|
|
Warranty: |
2,34 |
1,71 |
2,61 |
1,62 |
-10,27 |
5,66 |
|
|
Generated resources / Total creditors: |
0,29 |
0,08 |
0,29 |
0,07 |
-2,80 |
22,66 |
|
|
Efficiency |
2013 |
2012 |
Variación 2013 -
2012 |
|
|||
|
|
Empresa |
Sector |
Empresa |
Sector |
Empresa |
Sector |
|
|
Productivity: |
1,43 |
1,82 |
1,40 |
1,73 |
1,91 |
5,63 |
|
|
Turnover of Collection Rights : |
7,57 |
5,11 |
7,50 |
4,81 |
0,86 |
6,22 |
|
|
Turnover of Payment Entitlements: |
4,59 |
3,69 |
3,12 |
3,52 |
47,03 |
4,77 |
|
|
Stock rotation: |
2,69 |
7,82 |
3,14 |
6,54 |
-14,26 |
19,58 |
|
|
Assets turnover: |
1,08 |
1,10 |
1,02 |
1,08 |
5,17 |
1,86 |
|
|
Borrowing Cost: |
0,36 |
2,85 |
1,55 |
2,95 |
-76,88 |
-3,68 |
|
> Trend of indicators under the General Accounting Plan of 2007
(2013, 2012, 2011, 2010, 2009)
|
Cash Flow |
2013 |
2012 |
2011 |
2010 |
2009 |
|
|
Cash Flow over Sales: |
0,00 % |
0,00 % |
0,00 % |
0,00 % |
0,01 % |
|
|
EBITDA over Sales: |
11,00 % |
11,51 % |
10,50 % |
9,54 % |
8,37 % |
|
|
Cash Flow Yield: |
0,00 % |
0,00 % |
0,00 % |
0,00 % |
0,01 % |
|
|
Profitability |
2013 |
2012 |
2011 |
2010 |
2009 |
|
|
Operating economic profitability: |
3,94 % |
3,53 % |
1,41 % |
2,12 % |
1,88 % |
|
|
Total economic profitability: |
4,13 % |
4,29 % |
1,75 % |
2,51 % |
2,13 % |
|
|
Financial profitability: |
6,68 % |
4,91 % |
1,58 % |
3,57 % |
2,52 % |
|
|
Margin: |
3,66 % |
3,45 % |
1,59 % |
2,47 % |
2,08 % |
|
|
Mark-up: |
3,70 % |
3,62 % |
1,18 % |
2,58 % |
1,82 % |
|
|
Solvency |
2013 |
2012 |
2011 |
2010 |
2009 |
|
|
Liquidity: |
0,00 |
0,00 |
0,00 |
0,00 |
0,00 |
|
|
Acid Test: |
0,33 |
0,35 |
0,45 |
0,47 |
0,50 |
|
|
Working Capital / Investment: |
0,10 |
0,07 |
0,00 |
-0,03 |
0,01 |
|
|
Solvency: |
1,25 |
1,17 |
1,00 |
0,95 |
1,01 |
|
|
Indebtedness |
2013 |
2012 |
2011 |
2010 |
2009 |
|
|
Indebtedness level: |
0,75 |
0,62 |
0,76 |
0,93 |
0,76 |
|
|
Borrowing Composition: |
0,00 |
0,00 |
0,00 |
0,00 |
0,00 |
|
|
Repayment Ability: |
|
-8.093,00 |
|
-3.272,86 |
5,37 |
|
|
Warranty: |
2,34 |
2,61 |
2,31 |
2,08 |
2,32 |
|
|
Generated resources / Total creditors: |
0,29 |
0,29 |
0,20 |
0,13 |
0,17 |
|
|
Efficiency |
2013 |
2012 |
2011 |
2010 |
2009 |
|
|
Productivity: |
1,43 |
1,40 |
1,32 |
1,25 |
1,25 |
|
|
Turnover of Collection Rights : |
7,57 |
7,50 |
4,62 |
3,81 |
4,17 |
|
|
Turnover of Payment Entitlements: |
4,59 |
3,12 |
4,17 |
2,88 |
3,52 |
|
|
Stock rotation: |
2,69 |
3,14 |
3,72 |
3,62 |
4,08 |
|
|
Assets turnover: |
1,08 |
1,02 |
0,89 |
0,86 |
0,90 |
|
|
Borrowing Cost: |
0,36 |
1,55 |
1,63 |
0,65 |
1,14 |
|
COMPARATIVE SECTORIAL BALANCE
|
Sector-based
Comparison under the rules of the New General Accounting Plan.
|
|
Variación - |
|
|
|
Empresa |
Sector |
|
|
Variación - |
|
|
|
Empresa |
Sector |
|
|
Variación - |
|
|
|
Empresa |
Sector |
|
News |
|
Public Tenders
and Works Won |
No Public Tenders
assigned to the name of the company.
|
Research Summary |
|
The company belongs to the Bayer Group. It was incorporated in 1995
and is engaged in the manufacture of pharmaceutical products. Its turnover
has been increased by 20,31 % in 2013 compared to 2012. It complies with its
payment obligations. |
|
Sources |
|
Registry of Commerce's Official Gazette. Own and external data bases
Company References |
FOREIGN EXCHANGE RATES
|
Currency |
Unit
|
Indian Rupees |
|
US Dollar |
1 |
Rs.63.64 |
|
|
1 |
Rs.98.98 |
|
Euro |
1 |
Rs.77.74 |
INFORMATION DETAILS
|
Analysis Done by
: |
RAS |
|
|
|
|
Report Prepared
by : |
TPT |
RATING EXPLANATIONS
|
RATING |
STATUS |
PROPOSED CREDIT LINE |
|
|
>86 |
Aaa |
Possesses an extremely sound financial base with the strongest capability
for timely payment of interest and principal sums |
Unlimited |
|
71-85 |
Aa |
Possesses adequate working capital. No caution needed for credit
transaction. It has above average (strong) capability for payment of interest
and principal sums |
Large |
|
56-70 |
A |
Financial & operational base are regarded healthy. General
unfavourable factors will not cause fatal effect. Satisfactory capability for
payment of interest and principal sums |
Fairly Large |
|
41-55 |
Ba |
Overall operation
is considered normal. Capable to meet normal commitments. |
Satisfactory |
|
26-40 |
B |
Capability to overcome financial difficulties seems comparatively
below average. |
Small |
|
11-25 |
Ca |
Adverse factors are apparent. Repayment of interest and principal sums
in default or expected to be in default upon maturity |
Limited with
full security |
|
<10 |
C |
Absolute credit risk exists. Caution needed to be exercised |
Credit not
recommended |
|
-- |
NB |
New Business |
-- |
This score serves as a reference to assess
SC’s credit risk and to set the amount of credit to be extended. It is
calculated from a composite of weighted scores obtained from each of the major
sections of this report. The assessed factors and their relative weights (as
indicated through %) are as follows:
Financial
condition (40%) Ownership
background (20%) Payment
record (10%)
Credit history
(10%) Market trend (10%) Operational size
(10%)
This report is issued at your request without any
risk and responsibility on the part of MIRA INFORM PRIVATE LIMITED (MIPL)
or its officials.