MIRA
INFORM REPORT
|
Report Date : |
03.02.2014 |
IDENTIFICATION DETAILS
|
Name : |
QUIMICA SINTETICA SA |
|
|
|
|
Registered Office : |
Cl. Dulcinea - S/N - 28805 Alcala De Henares (Madrid) |
|
|
|
|
Country : |
Spain |
|
|
|
|
Financials (as on) : |
2011 |
|
|
|
|
Date of Incorporation : |
17.06.1950 |
|
|
|
|
Legal Form : |
Private Company |
|
|
|
|
Line of Business : |
Engaged in investigation, development, manufacturing, sale
& marketing of Active Pharmaceutical Ingredients and brand name drugs for
human and animals. It belongs to the group CHEMO. |
|
|
|
|
No. of Employees : |
152 (2011) |
RATING & COMMENTS
|
MIRA’s Rating : |
B |
|
RATING |
STATUS |
PROPOSED CREDIT LINE |
|
|
26-40 |
B |
Capability to overcome financial difficulties seems comparatively
below average. |
Small |
|
Status : |
Moderate |
|
|
|
|
Payment Behaviour : |
No Complaints |
|
|
|
|
Litigation : |
Clear |
NOTES :
Any query related to this report can be made on
e-mail : infodept@mirainform.com
while quoting report number, name and date.
ECGC Country Risk Classification List – december 01, 2013
|
Country Name |
Previous Rating (30.09.2013) |
Current Rating (01.12.2013) |
|
Spain |
A2 |
A2 |
|
Risk Category |
ECGC
Classification |
|
Insignificant |
A1 |
|
Low |
A2 |
|
Moderate |
B1 |
|
High |
B2 |
|
Very High |
C1 |
|
Restricted |
C2 |
|
Off-credit |
D |
Spain ECONOMIC OVERVIEW
After almost 15
years of above average GDP growth, the Spanish economy began to slow in late
2007 and entered into a recession in the second quarter of 2008. GDP contracted
by 3.7% in 2009, ending a 16-year growth trend, and by another 0.3% in 2010;
GDP expanded 0.4% in 2011, before contracting 1.4% in 2012. The economy has
once again fallen into recession as deleveraging in the private sector, fiscal
consolidation, and continued high unemployment weigh on domestic demand and
investment, even as exports have shown signs of resiliency. The unemployment
rate rose from a low of about 8% in 2007 to 26.0% in 2012. The economic
downturn has also hurt Spain's public finances. The government budget deficit
peaked at 11.2% of GDP in 2010 and the process to reduce this imbalance has been
slow despite the central government's efforts to raise new tax revenue and cut
spending. Spain reduced its budget deficit to 9.4% of GDP in 2011, and roughly
7.4% of GDP in 2012, above the 6.3% target negotiated between Spain and the EU.
Although Spain''s large budget deficit and poor economic growth prospects
remain a source of concern for foreign investors, the government''s ongoing
efforts to cut spending and introduce flexibility into the labor markets are
intended to assuage these concerns. The government is also taking steps to
shore up the banking system, namely by using up to $130 billion in EU funds to
recapitalize struggling banks exposed to the collapsed domestic construction
and real estate sectors.
|
Source : CIA |
Company name
Quimica sintetica SA
Company address
Localization CL. DULCINEA - S/N - 28805
ALCALA DE HENARES (MADRID)
|
Telephone |
918890577 |
|
Fax |
918890577 |
Company summary
|
Cif |
A28008167 |
|
Easy Number |
00000432375578 |
|
Registry Data |
Register
BARCELONA, Section 8, Sheet 52020 |
|
Incorporation
Date |
17/06/1950 |
|
Last
Publication in BORME |
22/01/2014
(Appointments) |
Activity
|
CNAE |
Engaged in investigation,
development, manufacturing, sale & marketing of Active Pharmaceutical
Ingredients and brand name drugs for human and animals. It belongs to the
group CHEMO. |
|
CNAE activity classification (ANNUAL ACCOUNTS): |
2110 / Manufacture of basic pharmaceutical products |
|
Size |
MEDIUM |
|
Published Trademarks |
No |
|
Audited / Opinion: |
Yes |
|
Tenders Won: |
No |
|
Subsidies Granted: |
3 |
|
Quality Certificate: |
Yes |
Defaults, Legal
Claims and Insolvency Proceedings
|
|
Number |
Amount |
Last Entry |
|
Insolvency Proceedings, Bankruptcy and Suspension of Payments |
Unpublished |
- |
- |
|
Legal and Administrative Proceedings |
1 |
64.97 € |
- |
|
Notices of defaults and enforcement |
Unpublished |
0 € |
- |
|
Proceedings heard by the Labour Court |
Unpublished |
0 € |
- |
Key Financial
Indicators in the award of credit:
|
Main Financial Data |
2011 |
2010 |
Change 2011 - 2010 |
|
Net total sales |
52.243.825 |
50.370.454 |
3,72% |
|
Gross margin |
12,64% |
24,1% |
-47,54% |
|
Gross Operating Results |
-708.367 |
145.802 |
-585,84% |
|
Indebtedness |
0,39 |
0,4 |
-4,24% |
|
Financial Year Result |
-1.684.204 |
-587.384 |
-186,73% |
|
Equity |
14.291.988 |
15.976.192 |
-10,54% |
|
Cash Flow |
-151.544 |
-1.055.121 |
85,64% |
|
Working Capital |
11.395.292 |
12.052.566 |
-5,45% |
|
Financial profitability |
-11,78% |
-3,68% |
-220,52% |
|
Economic Rate of Return |
-8,27% |
-5,42% |
-52,44% |
|
Average payment term |
120 days |
120 days |
0% |
|
Average Payment Collection Term |
90 days |
90 days |
0% |
|
Number of Employees |
152 |
162 |
-6,17% |
ACTIVITY
|
NACE: |
2110 / Manufacture of basic pharmaceutical products |
|
Main Activity: |
Engaged in investigation,
development, manufacturing, sale & marketing of Active Pharmaceutical
Ingredients and brand name drugs for human and animals. It belongs to the
group CHEMO. |
|
CNAE Source: |
ANNUAL ACCOUNTS |
|
Company size: |
MEDIUM |
Staff
|
Financial Year |
Permanent Employees |
Temporary Employees |
|
|
2011 |
152 |
0 |
|
|
2010 |
162 |
0 |
|
|
2009 |
162 |
0 |
|
|
2008 |
180 |
0 |
|
|
2007 |
170 |
1 |
|
|
2006 |
197 |
16 |
|
|
2005 |
201 |
18 |
|
|
2004 |
247 |
0 |
|
|
2003 |
187 |
41 |
|
|
2002 |
220 |
0 |
|
|
2000 |
172 |
26 |
|
Staff distribution
|
Associations |
Number of Employees 2011 |
Number of Employees 2010 |
|
EXECUTIVES AND MANAGERS |
1 |
2 |
|
PROFESSIONALS, TECHNICIANS AND SIMILAR |
45 |
49 |
|
ADMNISTRATIVE SERVICES AND SIMILAR |
6 |
6 |
|
THE REST OF THE STAFF |
100 |
101 |
|
TOTAL |
152 |
158 |
Sales Distribution
Geographic
|
Scope |
Region |
Sales |
|
Country |
SPAIN |
46.711.629,00 Euros |
|
Country |
SWITZERLAND |
4.834.390,00 Euros |
|
Continent |
EUROPA |
598.095,00 Euros |
|
Country |
ANOTHER COUNTRY |
99.711,00 Euros |
DEFAULTS, LEGAL CLAIMS AND INSOLVENCY PROCEEDINGS
Section enabling assessment of the degree of compliance of the company queried with its payment obligations. It provides information on the existence and nature of all stages of Insolvency and Legal Proceedings published with reference to the Company in the country's various Official Bulletins and national newspapers, as well Defaults Registered in the main national credit bureaus (ASNEF Empresas and RAI).
Summary
|
Se ha publicado en Boletines Oficiales una incidencia con
fecha 30/08/2008. |
Chronological
Summary
|
Proceedings and Stages |
Number of Publications |
Amount |
Start date |
End date |
|
Insolvency Proceedings, Bankruptcy and Suspension of Payments |
Unpublished |
- |
- |
- |
|
Request/Declaration |
0 |
- |
|
- |
|
Proceedings |
0 |
- |
|
- |
|
Resolution |
0 |
- |
|
- |
|
Legal and Administrative Proceedings |
1 |
64.97 € |
27/08/2008 |
27/08/2008 |
|
Notices of defaults and enforcement |
0 |
0 |
|
|
|
Seizures |
0 |
0 |
|
|
|
Auctions |
0 |
0 |
|
|
|
Declarations of insolvency and bad debt |
0 |
0 |
|
|
|
Proceedings heard by the Civil Court |
Unpublished |
0 € |
|
|
|
Proceedings heard by the Labour Court |
Unpublished |
- |
|
|
DETAILS
|
Incidences Detailed |
|
Incidences with the Social Security |
|
|
|
Last Published Stage: |
NOTIFICATION |
|
Record Number: |
02082008047884560 |
|
Amount of the incidence: |
64,97 E |
|
Requested by: |
SEGURIDAD SOCIAL |
|
Published domicile: |
CL GRAN VIA CARLOS I; BARCELONA C.P.:08028 |
|
Source: |
B.O.P. BARCELONA Nº209, 2008 PAGINA 35 |
ACCOUNTS AND BALANCE SHEET
RESULTS
Financial Years Presented
|
Financial Year |
Type of Annual Accounts |
|
|
2011 |
Normal |
December 2012 |
|
2010 |
Normal |
August 2011 |
|
2009 |
Normal |
December 2010 |
|
2008 |
Normal |
November 2009 |
|
2007 |
Normal |
August 2008 |
|
2006 |
Normal |
August 2007 |
|
2005 |
Normal |
December 2006 |
|
2004 |
Normal |
December 2005 |
|
2003 |
Normal |
October 2004 |
|
2002 |
Normal |
October 2003 |
|
2001 |
Normal |
October 2002 |
|
2000 |
Normal |
August 2001 |
|
1999 |
Normal |
December 2000 |
|
1998 |
Normal |
February 2000 |
|
1997 |
Normal |
December 1998 |
|
1996 |
Normal |
September 1997 |
|
1995 |
Normal |
July 1996 |
|
1994 |
Normal |
November 1995 |
|
1993 |
Normal |
September 1994 |
|
1992 |
Normal |
July 1993 |
|
1992 |
Normal |
August 1993 |
|
1991 |
Normal |
June 1992 |
|
1990 |
Normal |
July 1991 |
|
1989 |
Normal |
December 1990 |
La información del último Depósito de Cuentas contenida en el
informe procede del REGISTRO MERCANTIL correspondiente al domicilio de la sociedad
obtenida a fecha 31/12/2011
Balance en formato
Normal de acuerdo al Nuevo Plan General Contable 2007
Information corresponding to the
fiscal year 2011 2010 2009 2008 is taken from
information submitted to the TRADE REGISTER. Data corresponding to fiscal years
before 2011 2010 2009 2008 has been compiled based on
the equivalence criteria stipulated in Act JUS/206/2009. Where the provisions
of the Act did not establish relevant equivalence criteria, created such criteria
using its own methodology. To view details on the methodology.
|
Assets |
Code |
2011 |
2010 |
2009 |
2008 |
2007 |
|
|
A) NON-CURRENT
ASSETS |
11000 |
21.354.983 |
22.167.611 |
18.596.357 |
20.195.427 |
15.919.965 |
|
|
I. Intangible fixed assets |
11100 |
12.792 |
12.948 |
32.286 |
59.367 |
236.958 |
|
|
1. Development |
11110 |
0 |
0 |
0 |
0 |
0 |
|
|
2. Concessions |
11120 |
0 |
0 |
0 |
0 |
0 |
|
|
3. Patents, licencing, trade marks and similar |
11130 |
0 |
1.244 |
10.525 |
20.009 |
162.721 |
|
|
4. Goodwill |
11140 |
0 |
0 |
0 |
0 |
0 |
|
|
5. IT applications |
11150 |
12.792 |
11.704 |
21.761 |
39.358 |
74.237 |
|
|
6. Investigation |
11160 |
0 |
0 |
0 |
0 |
0 |
|
|
7. Other intangible fixed assets |
11170 |
0 |
0 |
0 |
0 |
0 |
|
|
II. Tangible fixed assets |
11200 |
9.679.741 |
10.097.054 |
11.592.283 |
14.366.702 |
14.461.273 |
|
|
1. Land and buildings |
11210 |
5.154.978 |
5.351.445 |
5.905.048 |
6.510.054 |
2.021.627 |
|
|
2. Technical installations and other tangible
fixed assets |
11220 |
4.200.713 |
4.745.609 |
5.687.235 |
7.856.648 |
12.439.645 |
|
|
3. Tangible asset in progress and advances |
11230 |
324.050 |
0 |
0 |
0 |
0 |
|
|
III. Real estate investment |
11300 |
0 |
0 |
0 |
0 |
0 |
|
|
1. Land |
11310 |
0 |
0 |
0 |
0 |
0 |
|
|
2. Buildings |
11320 |
0 |
0 |
0 |
0 |
0 |
|
|
IV. Long-term investments in Group companies and associates |
11400 |
9.370.390 |
8.928.576 |
4.355.863 |
3.191.803 |
0 |
|
|
1. Equity instruments |
11410 |
0 |
0 |
0 |
0 |
0 |
|
|
2. Credits to businesses |
11420 |
9.370.390 |
8.928.576 |
4.355.863 |
3.191.803 |
0 |
|
|
3. Debt securities |
11430 |
0 |
0 |
0 |
0 |
0 |
|
|
4. Derivatives |
11440 |
0 |
0 |
0 |
0 |
0 |
|
|
5. Other financial assets |
11450 |
0 |
0 |
0 |
0 |
0 |
|
|
6. Other investments |
11460 |
0 |
0 |
0 |
0 |
0 |
|
|
V. Long-term financial investments |
11500 |
23.435 |
23.435 |
23.435 |
32.080 |
26.415 |
|
|
1. Equity instruments |
11510 |
0 |
0 |
0 |
0 |
0 |
|
|
2. Credits to third parties |
11520 |
0 |
0 |
0 |
0 |
0 |
|
|
3. Debt securities |
11530 |
0 |
0 |
0 |
0 |
0 |
|
|
4. Derivatives |
11540 |
0 |
0 |
0 |
0 |
0 |
|
|
5. Other financial assets |
11550 |
23.435 |
23.435 |
23.435 |
32.080 |
26.415 |
|
|
6. Other investments |
11560 |
0 |
0 |
0 |
0 |
0 |
|
|
VI. Assets for deferred tax |
11600 |
2.268.625 |
3.105.598 |
2.592.490 |
2.545.475 |
1.195.319 |
|
|
VII. Non-current trade debts |
11700 |
0 |
0 |
0 |
0 |
0 |
|
|
B) CURRENT
ASSETS |
12000 |
25.223.897 |
28.517.624 |
28.214.013 |
26.485.242 |
32.589.104 |
|
|
I. Non-current assets held for sale |
12100 |
0 |
0 |
0 |
0 |
0 |
|
|
II. Stocks |
12200 |
12.100.240 |
18.816.479 |
14.481.630 |
14.602.788 |
14.992.029 |
|
|
1. Commercial |
12210 |
0 |
0 |
0 |
0 |
0 |
|
|
2. Primary material and other supplies |
12220 |
3.545.946 |
6.227.024 |
2.879.426 |
3.871.549 |
5.971.000 |
|
|
3. Work in progress |
12230 |
1.053.230 |
2.109.271 |
1.492.612 |
2.185.882 |
2.828.252 |
|
|
a) Of long-term production
cycle |
12231 |
0 |
0 |
0 |
0 |
0 |
|
|
b) Of short-term production
cycle |
12232 |
1.053.230 |
2.109.271 |
1.492.612 |
2.185.882 |
2.828.252 |
|
|
4. Finished goods |
12240 |
5.930.496 |
9.266.958 |
8.812.155 |
8.228.672 |
6.192.777 |
|
|
a) Of long-term production
cycle |
12241 |
0 |
0 |
0 |
0 |
0 |
|
|
b) Of short-term production
cycle |
12242 |
5.930.496 |
9.266.958 |
8.812.155 |
8.228.672 |
6.192.777 |
|
|
5. By-products, residues and recycled materials |
12250 |
0 |
0 |
0 |
0 |
0 |
|
|
6. Advances to suppliers |
12260 |
1.570.568 |
1.213.226 |
1.297.437 |
316.685 |
0 |
|
|
III. Trade debtors and others receivable accounts |
12300 |
12.592.658 |
8.983.140 |
10.890.722 |
11.271.930 |
17.472.137 |
|
|
1. Trade debtors / accounts receivable |
12310 |
186.684 |
481.620 |
7.786 |
308.091 |
248.190 |
|
|
a) Long-term receivables from
sales and services supplied |
12311 |
0 |
0 |
0 |
0 |
0 |
|
|
b) Customers for sales and
provisions of services |
12312 |
186.684 |
481.620 |
7.786 |
308.091 |
248.190 |
|
|
2. Customers, Group companies and associates |
12320 |
11.574.848 |
7.516.105 |
10.406.497 |
8.120.972 |
15.521.741 |
|
|
3. Other accounts receivable |
12330 |
0 |
0 |
0 |
0 |
360.127 |
|
|
4. Personnel |
12340 |
9.913 |
14.648 |
21.394 |
20.901 |
16.923 |
|
|
5. Assets for deferred tax |
12350 |
0 |
0 |
0 |
0 |
0 |
|
|
6. Other debtors, including tax and social
security |
12360 |
821.213 |
970.767 |
455.045 |
2.821.966 |
1.325.156 |
|
|
7. Called up share capital |
12370 |
0 |
0 |
0 |
0 |
0 |
|
|
IV. Short-term investments in Group companies and associates |
12400 |
0 |
32.612 |
1.093.206 |
0 |
0 |
|
|
1. Equity instruments |
12410 |
0 |
0 |
0 |
0 |
0 |
|
|
2. Credits to businesses |
12420 |
0 |
32.612 |
1.093.206 |
0 |
0 |
|
|
3. Debt securities |
12430 |
0 |
0 |
0 |
0 |
0 |
|
|
4. Derivatives |
12440 |
0 |
0 |
0 |
0 |
0 |
|
|
5. Other financial assets |
12450 |
0 |
0 |
0 |
0 |
0 |
|
|
6. Other investments |
12460 |
0 |
0 |
0 |
0 |
0 |
|
|
V. Short-term financial investments |
12500 |
350.100 |
350.100 |
350.100 |
355.665 |
0 |
|
|
1. Equity instruments |
12510 |
0 |
0 |
0 |
0 |
0 |
|
|
2. Credits to businesses |
12520 |
0 |
0 |
0 |
0 |
0 |
|
|
3. Debt securities |
12530 |
0 |
0 |
0 |
0 |
0 |
|
|
4. Derivatives |
12540 |
0 |
0 |
0 |
0 |
0 |
|
|
5. Other financial assets |
12550 |
350.100 |
350.100 |
350.100 |
355.665 |
0 |
|
|
6. Other investments |
12560 |
0 |
0 |
0 |
0 |
0 |
|
|
VI. Short-term accruals |
12600 |
0 |
2.850 |
10.791 |
7.907 |
9.308 |
|
|
VII. Cash and other equivalent liquid assets |
12700 |
180.899 |
332.443 |
1.387.564 |
246.952 |
115.630 |
|
|
1. Treasury |
12710 |
180.899 |
32.443 |
1.387.564 |
246.952 |
115.630 |
|
|
2. Other equivalent liquid assets |
12720 |
0 |
300.000 |
0 |
0 |
0 |
|
|
TOTAL ASSETS (A
+ B) |
10000 |
46.578.880 |
50.685.235 |
46.810.370 |
46.680.669 |
48.509.069 |
|
|
Liabilities and
Net Worth |
Code |
2011 |
2010 |
2009 |
2008 |
2007 |
|
|
A) NET WORTH |
20000 |
14.291.988 |
15.976.192 |
16.563.576 |
22.065.996 |
19.910.240 |
|
|
A-1) Shareholders' equity |
21000 |
14.291.988 |
15.976.192 |
16.563.576 |
22.065.996 |
19.910.240 |
|
|
I. Capital |
21100 |
2.007.340 |
2.007.340 |
2.007.340 |
2.007.340 |
2.007.340 |
|
|
1. Registered capital |
21110 |
2.007.340 |
2.007.340 |
2.007.340 |
2.007.340 |
2.007.340 |
|
|
2. (Uncalled capital) |
21120 |
0 |
0 |
0 |
0 |
0 |
|
|
II. Share premium |
21200 |
0 |
0 |
0 |
0 |
0 |
|
|
III. Reserves |
21300 |
13.968.852 |
14.556.236 |
20.058.656 |
20.543.388 |
28.544.280 |
|
|
1. Legal and statutory |
21310 |
401.476 |
401.476 |
401.476 |
401.476 |
401.476 |
|
|
2. Other reserves |
21320 |
13.567.376 |
14.154.760 |
19.657.180 |
20.141.912 |
28.142.804 |
|
|
IV. (Common stock equity) |
21400 |
0 |
0 |
0 |
0 |
0 |
|
|
V. Results from previous periods |
21500 |
0 |
0 |
0 |
0 |
0 |
|
|
1. Brought forward |
21510 |
0 |
0 |
0 |
0 |
0 |
|
|
2. (Negative results from previous periods) |
21520 |
0 |
0 |
0 |
0 |
0 |
|
|
VI. Other shareholders' contributions |
21600 |
0 |
0 |
0 |
0 |
0 |
|
|
VII. Result of the period |
21700 |
-1.684.204 |
-587.384 |
-5.502.420 |
-484.732 |
-10.641.380 |
|
|
VIII. (Interim dividend) |
21800 |
0 |
0 |
0 |
0 |
0 |
|
|
IX. Other net worth instruments |
21900 |
0 |
0 |
0 |
0 |
0 |
|
|
A-2) Adjustments due to changes in value |
22000 |
0 |
0 |
0 |
0 |
0 |
|
|
I. Financial assets held for sale |
22100 |
0 |
0 |
0 |
0 |
0 |
|
|
II. Hedge operations |
22200 |
0 |
0 |
0 |
0 |
0 |
|
|
III. Linked non-current assets and liabilities held for sale |
22300 |
0 |
0 |
0 |
0 |
0 |
|
|
IV. Exchange rate difference |
22400 |
0 |
0 |
0 |
0 |
0 |
|
|
V. Other |
22500 |
0 |
0 |
0 |
0 |
0 |
|
|
A-3) Received subsidies, donations and legacies |
23000 |
0 |
0 |
0 |
0 |
0 |
|
|
B) NON-CURRENT
LIABILITIES |
31000 |
18.458.287 |
18.243.985 |
17.905.052 |
11.746.397 |
13.696.759 |
|
|
I. Long-term provisions |
31100 |
18.438.151 |
18.193.146 |
17.827.572 |
11.637.510 |
13.493.977 |
|
|
1. Long-term employee benefits liability |
31110 |
0 |
0 |
0 |
0 |
0 |
|
|
2. Environmental actions |
31120 |
0 |
0 |
0 |
0 |
0 |
|
|
3. Restructuring provisions |
31130 |
12.775.705 |
12.619.605 |
12.238.706 |
5.837.856 |
0 |
|
|
4. Other provisions |
31140 |
5.662.446 |
5.573.541 |
5.588.866 |
5.799.654 |
13.493.977 |
|
|
II Long-term creditors |
31200 |
0 |
0 |
0 |
0 |
0 |
|
|
1. Liabilities and other securities |
31210 |
0 |
0 |
0 |
0 |
0 |
|
|
2. Amounts owed to credit institutions |
31220 |
0 |
0 |
0 |
0 |
0 |
|
|
3. Creditors from financial leasing |
31230 |
0 |
0 |
0 |
0 |
0 |
|
|
4. Derivatives |
31240 |
0 |
0 |
0 |
0 |
0 |
|
|
5. Other financial liabilities |
31250 |
0 |
0 |
0 |
0 |
0 |
|
|
III. Long-term debts with Group companies and associates |
31300 |
0 |
0 |
0 |
0 |
0 |
|
|
IV. Liabilities for deferred tax |
31400 |
20.136 |
50.839 |
77.480 |
108.887 |
202.782 |
|
|
V. Long-term accruals |
31500 |
0 |
0 |
0 |
0 |
0 |
|
|
VI. Non-current trade creditors |
31600 |
0 |
0 |
0 |
0 |
0 |
|
|
VII. Special long-term debts |
31700 |
0 |
0 |
0 |
0 |
0 |
|
|
C) CURRENT
LIABILITIES |
32000 |
13.828.605 |
16.465.058 |
12.341.742 |
12.868.276 |
14.902.070 |
|
|
I. Liabilities linked to non-current assets held for sale |
32100 |
0 |
0 |
0 |
0 |
0 |
|
|
II. Short-term provisions |
32200 |
1.223.152 |
2.751.755 |
1.232.118 |
2.647.059 |
0 |
|
|
III. Short-term creditors |
32300 |
0 |
0 |
35.941 |
471.890 |
583.266 |
|
|
1. Liabilities and other securities |
32310 |
0 |
0 |
0 |
0 |
0 |
|
|
2. Amounts owed to credit institutions |
32320 |
0 |
0 |
35.941 |
471.890 |
212.484 |
|
|
3. Creditors from financial leasing |
32330 |
0 |
0 |
0 |
0 |
82.758 |
|
|
4. Derivatives |
32340 |
0 |
0 |
0 |
0 |
0 |
|
|
5. Other financial liabilities |
32350 |
0 |
0 |
0 |
0 |
288.024 |
|
|
IV. Short-term debts with Group companies and associates |
32400 |
0 |
0 |
0 |
0 |
0 |
|
|
V. Trade creditors and other accounts payable |
32500 |
12.605.453 |
13.713.303 |
11.073.683 |
9.749.327 |
14.318.804 |
|
|
1. Suppliers |
32510 |
7.349.051 |
7.663.100 |
6.627.681 |
6.928.114 |
5.258.647 |
|
|
a) Long-term debts |
32511 |
0 |
0 |
0 |
0 |
0 |
|
|
b) Short-term debts |
32512 |
7.349.051 |
7.663.100 |
6.627.681 |
6.928.114 |
5.258.647 |
|
|
2. Suppliers, Group companies and associates |
32520 |
3.585.050 |
4.435.711 |
3.469.065 |
1.653.100 |
7.513.817 |
|
|
3. Other creditors |
32530 |
616.453 |
0 |
42.578 |
189.630 |
143.935 |
|
|
4. Personnel (remuneration due) |
32540 |
592.601 |
901.925 |
630.400 |
646.599 |
1.130.933 |
|
|
5. Liabilities for current tax |
32550 |
0 |
0 |
0 |
0 |
0 |
|
|
6. Otras deudas con las Administraciones Públicas. |
32560 |
462.298 |
712.567 |
303.959 |
331.884 |
271.472 |
|
|
7. Advances from clients |
32570 |
0 |
0 |
0 |
0 |
0 |
|
|
VI. Short-term accruals |
32600 |
0 |
0 |
0 |
0 |
0 |
|
|
VII. Special short-term debts |
32700 |
0 |
0 |
0 |
0 |
0 |
|
|
TOTAL NET WORTH
AND LIABILITIES (A + B + C) |
30000 |
46.578.880 |
50.685.235 |
46.810.370 |
46.680.669 |
48.509.069 |
|
|
Profit and
Loss |
Code |
2011 |
2010 |
2009 |
2008 |
2007 |
|
|
1. Net turnover |
40100 |
52.243.825 |
50.370.454 |
43.546.343 |
49.485.843 |
55.130.007 |
|
|
a) Sales |
40110 |
52.243.825 |
50.370.454 |
43.546.343 |
49.485.843 |
55.130.007 |
|
|
b) Rendering of services |
40120 |
0 |
0 |
0 |
0 |
0 |
|
|
2. Changes in
stocks of finished goods and work in progress |
40200 |
-4.476.684 |
1.071.462 |
-109.787 |
1.393.525 |
-1.549.770 |
|
|
3. Works carried
out by the company for its assets |
40300 |
0 |
0 |
0 |
0 |
0 |
|
|
4. Supplies |
40400 |
-28.689.240 |
-26.428.275 |
-23.126.259 |
-28.048.784 |
-30.551.228 |
|
|
a) Stock consumption |
40410 |
-29.025.923 |
-26.428.275 |
-23.126.259 |
-28.048.784 |
0 |
|
|
b) Consumption of raw materials and miscellaneous consumable ones |
40420 |
0 |
0 |
0 |
0 |
-30.551.228 |
|
|
c) Works carried out by other companies |
40430 |
0 |
0 |
0 |
0 |
0 |
|
|
d) Impairment of stock, primary material and other supplies |
40440 |
336.683 |
0 |
0 |
0 |
0 |
|
|
5. Other
operating income |
40500 |
1.527.647 |
331.012 |
1.082.403 |
1.345.472 |
1.547.588 |
|
|
a) Auxiliary income and other from current management |
40510 |
1.527.647 |
189.262 |
1.082.403 |
1.345.472 |
1.547.588 |
|
|
b) Operation subsidies included in the Period's result |
40520 |
0 |
141.750 |
0 |
0 |
0 |
|
|
6. Personnel
costs |
40600 |
-7.505.716 |
-12.072.017 |
-12.566.450 |
-8.949.890 |
-9.564.142 |
|
|
a) Wages, salaries et al. |
40610 |
-5.583.717 |
-10.154.996 |
-10.693.246 |
-7.098.535 |
-7.496.219 |
|
|
b) Social security costs |
40620 |
-1.921.999 |
-1.917.021 |
-1.873.204 |
-1.851.355 |
-2.067.923 |
|
|
c) Provisions |
40630 |
0 |
0 |
0 |
0 |
0 |
|
|
7. Other
operating costs |
40700 |
-13.808.199 |
-13.126.834 |
-13.871.995 |
-13.724.096 |
-11.022.139 |
|
|
a) External services |
40710 |
-13.520.820 |
-12.883.583 |
-13.533.204 |
-13.468.600 |
-10.779.120 |
|
|
b) Taxes |
40720 |
-251.326 |
-243.251 |
-251.533 |
-255.496 |
-247.181 |
|
|
c) Losses, impairments and variation in provisions from trade
operations |
40730 |
-36.053 |
0 |
-87.258 |
0 |
4.162 |
|
|
d) Other current management expenditure |
40740 |
0 |
0 |
0 |
0 |
0 |
|
|
8. Amortisation
of fixed assets |
40800 |
-2.337.785 |
-2.389.040 |
-3.464.769 |
-3.059.183 |
-3.126.871 |
|
|
9. Allocation of
subsidies of non-financial fixed assets and other |
40900 |
0 |
0 |
0 |
0 |
0 |
|
|
10. Excess
provisions |
41000 |
0 |
0 |
0 |
0 |
0 |
|
|
11. Impairment
and result of transfers of fixed assets |
41100 |
0 |
0 |
0 |
0 |
133 |
|
|
a) Impairment and losses |
41110 |
0 |
0 |
0 |
0 |
0 |
|
|
b) Results for transfers and other |
41120 |
0 |
0 |
0 |
0 |
133 |
|
|
12. Negative
difference in combined businesses |
41200 |
0 |
0 |
0 |
0 |
0 |
|
|
13. Other
results |
41300 |
141.202 |
315.758 |
0 |
0 |
-13.493.033 |
|
|
A.1) OPERATING
INCOME (1 + 2 + 3 + 4 + 5 + 6 + 7 + 8 + 9 + 10 + 11 + 12 + 13) |
49100 |
-2.904.950 |
-1.927.480 |
-8.510.514 |
-1.557.113 |
-12.629.455 |
|
|
14. Financial
income |
41400 |
105.557 |
38.406 |
539 |
19.585 |
43.968 |
|
|
a) Of shares in equity instruments |
41410 |
0 |
0 |
0 |
0 |
0 |
|
|
a 1) In Group companies and associates |
41411 |
0 |
0 |
0 |
0 |
0 |
|
|
a 2) In third parties |
41412 |
0 |
0 |
0 |
0 |
0 |
|
|
b) From negotiable securities and other financial instruments |
41420 |
105.557 |
38.406 |
539 |
19.585 |
43.968 |
|
|
b 1) From Group companies and associates |
41421 |
105.225 |
32.612 |
0 |
0 |
0 |
|
|
b 2) From third parties |
41422 |
332 |
5.794 |
539 |
19.585 |
43.968 |
|
|
c) Allocation of financial subsidies, donations and legacies |
41430 |
0 |
0 |
0 |
0 |
0 |
|
|
15. Financial
expenditure |
41500 |
-502.098 |
-400.859 |
-1.078.919 |
-296.178 |
-128.580 |
|
|
a) Amounts owed to Group companies and associates |
41510 |
-32.976 |
0 |
0 |
0 |
-64.596 |
|
|
b) For debts with third parties |
41520 |
-265 |
-9.313 |
-27.661 |
-20.769 |
-63.984 |
|
|
c) Stock renewal |
41530 |
-468.857 |
-391.546 |
-1.051.258 |
-275.409 |
0 |
|
|
16. Changes in
fair value of financial instruments |
41600 |
0 |
0 |
0 |
0 |
0 |
|
|
a) Trading book and other |
41610 |
0 |
0 |
0 |
0 |
0 |
|
|
b) Allocation of financial assets held for sale to the result for the
period |
41620 |
0 |
0 |
0 |
0 |
0 |
|
|
17. Exchange
rate differences |
41700 |
289.815 |
-154.407 |
202.047 |
-189.040 |
203.521 |
|
|
18. Impairment and
result for transfers of financial instruments |
41800 |
0 |
0 |
0 |
0 |
0 |
|
|
a) Impairment and losses |
41810 |
0 |
0 |
0 |
0 |
0 |
|
|
b) Results for transfers and other |
41820 |
0 |
0 |
0 |
0 |
0 |
|
|
19. Other financial
income and expenditure |
42100 |
0 |
0 |
0 |
0 |
0 |
|
|
a) Incorporation of financial expenditure to assets |
42110 |
0 |
0 |
0 |
0 |
0 |
|
|
b) Financial income from arrangement with creditors |
42120 |
0 |
0 |
0 |
0 |
0 |
|
|
c) Other income and expenditure |
42130 |
0 |
0 |
0 |
0 |
0 |
|
|
A.2) FINANCIAL
REVENUE (14+15+16+17+18+19) |
49200 |
-106.726 |
-516.860 |
-876.333 |
-465.633 |
118.909 |
|
|
A.3) NET RESULT
BEFORE TAXES (A.1+A.2) |
49300 |
-3.011.676 |
-2.444.340 |
-9.386.847 |
-2.022.746 |
-12.510.546 |
|
|
20. Income taxes |
41900 |
1.327.472 |
1.856.956 |
3.884.427 |
1.538.014 |
1.869.166 |
|
|
A.4) PROFIT
AFTER TAXES (A.3+20) |
49400 |
-1.684.204 |
-587.384 |
-5.502.420 |
-484.732 |
-10.641.380 |
|
|
21. Result of
the year coming from interrupted operations |
42000 |
0 |
0 |
0 |
0 |
0 |
|
|
A.5) RESULT OF
THE PERIOD (A.4+21) |
49500 |
-1.684.204 |
-587.384 |
-5.502.420 |
-484.732 |
-10.641.380 |
|
DIAGNOSTICO ECONOMICO-FINANCIERO
Economic-Financial
Comparative Analysis
Data used in the following ratios and indicators is taken from
the Annual Accounts submitted by the company to the TRADE REGISTER.
Comparison within
the Sector
|
Cash Flow |
2011 |
2010 |
Change 2011 - 2010 |
|
|||
|
|
Company |
Sector |
Company |
Sector |
Company |
Sector |
|
|
Cash Flow over Sales |
0,00 % |
-0,01 % |
-2,09 % |
0,00 % |
99,86 % |
|
|
|
EBITDA over Sales |
-1,36 % |
15,42 % |
0,29 % |
12,00 % |
-568,42 % |
28,53 % |
|
|
Cash Flow Yield |
0,00 % |
0,00 % |
-2,08 % |
0,00 % |
99,84 % |
|
|
|
Profitability |
2011 |
2010 |
Change 2011 - 2010 |
|
|||
|
|
Company |
Sector |
Company |
Sector |
Company |
Sector |
|
|
Operating economic profitability |
-8,27 % |
15,93 % |
-5,42 % |
9,18 % |
-52,44 % |
73,61 % |
|
|
Total economic profitability |
-5,39 % |
7,95 % |
-4,03 % |
4,88 % |
-33,64 % |
63,05 % |
|
|
Financial profitability |
-11,78 % |
10,51 % |
-3,68 % |
5,36 % |
-220,52 % |
95,82 % |
|
|
Margin |
-5,66 % |
11,66 % |
-4,42 % |
7,10 % |
-28,04 % |
64,24 % |
|
|
Mark-up |
-5,86 % |
10,85 % |
-5,44 % |
5,88 % |
-7,71 % |
84,53 % |
|
|
Solvency |
2011 |
2010 |
Change 2011 - 2010 |
|
|||
|
|
Company |
Sector |
Company |
Sector |
Company |
Sector |
|
|
Liquidity |
0,01 |
0,09 |
0,02 |
0,11 |
-40,80 % |
-17,04 % |
|
|
Acid Test |
1,04 |
1,03 |
0,71 |
1,03 |
47,21 % |
0,26 % |
|
|
Working Capital / Investment |
0,24 |
0,10 |
0,24 |
0,11 |
2,88 % |
-6,24 % |
|
|
Solvency |
2,18 |
1,54 |
2,31 |
1,51 |
-5,42 % |
1,73 % |
|
|
Indebtedness |
2011 |
2010 |
Change 2011 - 2010 |
|
|||
|
|
Company |
Sector |
Company |
Sector |
Company |
Sector |
|
|
Indebtedness level |
0,39 |
0,58 |
0,40 |
0,66 |
-4,24 % |
-11,46 % |
|
|
Borrowing Composition |
0,00 |
0,75 |
0,00 |
0,72 |
|
3,69 % |
|
|
Repayment Ability |
-83,31 |
-101,00 |
3,10 |
-240,24 |
-2.789,76 % |
57,96 % |
|
|
Warranty |
3,69 |
2,72 |
3,68 |
2,52 |
0,19 % |
7,90 % |
|
|
Generated resources / Total creditors |
0,03 |
0,24 |
0,13 |
0,14 |
-80,82 % |
68,04 % |
|
|
Efficiency |
2011 |
2010 |
Change 2011 - 2010 |
|
|||
|
|
Company |
Sector |
Company |
Sector |
Company |
Sector |
|
|
Productivity |
0,91 |
2,05 |
1,01 |
1,79 |
-10,52 % |
14,52 % |
|
|
Turnover of Collection Rights |
4,27 |
4,04 |
5,64 |
3,84 |
-24,34 % |
5,15 % |
|
|
Turnover of Payment Entitlements |
3,02 |
4,69 |
2,96 |
4,34 |
1,81 % |
8,14 % |
|
|
Stock rotation |
4,70 |
5,96 |
2,81 |
6,03 |
66,88 % |
-1,07 % |
|
|
Assets turnover |
1,46 |
1,37 |
1,23 |
1,29 |
19,06 % |
5,71 % |
|
|
Borrowing Cost |
3,98 |
2,47 |
2,91 |
2,16 |
36,55 % |
14,43 % |
|
Trend of indicators
under the General Accounting Plan of 2007 (2011, 2010, 2009, 2008, 2007)
|
Cash Flow |
2011 |
2010 |
2009 |
2008 |
2007 |
|
|
Cash Flow over Sales |
0,00 % |
-2,09 % |
2,62 % |
0,27 % |
-1,32 % |
|
|
EBITDA over Sales |
-1,36 % |
0,29 % |
-11,59 % |
3,04 % |
7,23 % |
|
|
Cash Flow Yield |
0,00 % |
-2,08 % |
2,44 % |
0,28 % |
-1,50 % |
|
|
Profitability |
2011 |
2010 |
2009 |
2008 |
2007 |
|
|
Operating economic profitability |
-8,27 % |
-5,42 % |
-20,76 % |
-3,61 % |
1,78 % |
|
|
Total economic profitability |
-5,39 % |
-4,03 % |
-17,75 % |
-3,70 % |
-25,53 % |
|
|
Financial profitability |
-11,78 % |
-3,68 % |
-33,22 % |
-2,20 % |
-54,38 % |
|
|
Margin |
-5,66 % |
-4,42 % |
-19,07 % |
-3,06 % |
1,52 % |
|
|
Mark-up |
-5,86 % |
-5,44 % |
-21,03 % |
-0,92 % |
1,73 % |
|
|
Solvency |
2011 |
2010 |
2009 |
2008 |
2007 |
|
|
Liquidity |
0,01 |
0,02 |
0,12 |
0,02 |
0,01 |
|
|
Acid Test |
1,04 |
0,71 |
1,24 |
1,16 |
1,25 |
|
|
Working Capital / Investment |
0,24 |
0,24 |
0,42 |
0,40 |
0,39 |
|
|
Solvency |
2,18 |
2,31 |
2,77 |
2,84 |
2,25 |
|
|
Indebtedness |
2011 |
2010 |
2009 |
2008 |
2007 |
|
|
Indebtedness level |
0,39 |
0,40 |
0,33 |
0,31 |
0,45 |
|
|
Borrowing Composition |
0,00 |
0,00 |
0,01 |
0,01 |
0,01 |
|
|
Repayment Ability |
-83,31 |
3,10 |
-32,83 |
6,11 |
8,28 |
|
|
Warranty |
3,69 |
3,68 |
4,18 |
4,52 |
3,21 |
|
|
Generated resources / Total creditors |
0,03 |
0,13 |
-0,18 |
0,25 |
-0,50 |
|
|
Efficiency |
2011 |
2010 |
2009 |
2008 |
2007 |
|
|
Productivity |
0,91 |
1,01 |
0,60 |
1,17 |
1,42 |
|
|
Turnover of Collection Rights |
4,27 |
5,64 |
4,10 |
4,51 |
3,04 |
|
|
Turnover of Payment Entitlements |
3,02 |
2,96 |
3,33 |
4,43 |
7,98 |
|
|
Stock rotation |
4,70 |
2,81 |
3,67 |
3,59 |
3,72 |
|
|
Assets turnover |
1,46 |
1,23 |
1,09 |
1,18 |
1,17 |
|
|
Borrowing Cost |
3,98 |
2,91 |
9,64 |
2,87 |
0,85 |
|
SECTOR-BASED BALANCE COMPARISON
Sector-based
Comparison under the rules of the New General Accounting Plan.
|
|
2011 |
2010 |
Change
2011 - 2010 |
|
|||
|
|
Company |
Sector |
Company |
Sector |
Company |
Sector |
|
|
ASSETS |
46.578.880 |
110.318.146 |
50.685.235 |
99.267.732 |
-8,10
% |
11,13
% |
|
|
NON-CURRENT
ASSETS |
21.354.983 |
75.556.735 |
22.167.611 |
65.440.872 |
-3,67
% |
15,46
% |
|
|
TANGIBLE FIXED ASSETS |
9.679.741 |
17.979.129 |
10.097.054 |
18.014.525 |
-4,13
% |
-0,20
% |
|
|
Intangible Fixed Assets |
12.792 |
3.147.948 |
12.948 |
2.608.935 |
-1,20
% |
20,66
% |
|
|
Other Non-current Asset |
11.662.450 |
54.429.658 |
12.057.609 |
44.817.412 |
-3,28
% |
21,45
% |
|
|
CURRENT
ASSETS |
25.223.897 |
34.761.411 |
28.517.624 |
33.826.861 |
-11,55
% |
2,76
% |
|
|
Stock |
12.100.240 |
10.742.560 |
18.816.479 |
10.186.417 |
-35,69
% |
5,46
% |
|
|
Debtors |
12.592.658 |
17.934.052 |
8.983.140 |
17.387.792 |
40,18
% |
3,14
% |
|
|
Cash flow |
180.899 |
2.129.814 |
332.443 |
2.531.028 |
-45,59
% |
-15,85
% |
|
|
Another Current Asset |
350.100 |
3.954.985 |
385.562 |
3.721.623 |
-9,20
% |
6,27
% |
|
|
|
2011 |
2010 |
Change 2011 -
2010 |
|||
|
|
Company |
Sector |
Company |
Sector |
Company |
Sector |
|
NET ASSETS AND
LIABILITIES |
46.578.880 |
110.318.146 |
50.685.235 |
99.267.732 |
-8,10 % |
11,13 % |
|
Net Worth |
14.291.988 |
68.090.805 |
15.976.192 |
59.148.714 |
-10,54 % |
15,12 % |
|
Capital and Share Premiums |
2.007.340 |
26.608.692 |
2.007.340 |
23.677.619 |
0,00 % |
12,38 % |
|
Reserves |
13.968.852 |
34.875.555 |
14.556.236 |
31.082.265 |
-4,04 % |
12,20 % |
|
Other Net Assets |
0 |
-528.043 |
0 |
1.208.538 |
|
-143,69 % |
|
Financial Year Result |
-1.684.204 |
7.134.588 |
-587.384 |
3.165.267 |
-186,73 % |
125,40 % |
|
NON-CURRENT
LIABILITIES |
18.458.287 |
18.536.277 |
18.243.985 |
16.916.875 |
1,17 % |
9,57 % |
|
Long-term debts incurred with companies of the group and affiliates |
0 |
10.386.359 |
0 |
10.541.296 |
|
-1,47 % |
|
Other Long-term Debts |
18.458.287 |
8.149.918 |
18.243.985 |
6.375.578 |
1,17 % |
27,83 % |
|
CURRENT
LIABILITIES |
13.828.605 |
23.691.065 |
16.465.058 |
23.202.144 |
-16,01 % |
2,11 % |
|
Trade Creditors |
12.605.453 |
10.998.921 |
13.713.303 |
11.406.967 |
-8,08 % |
-3,58 % |
|
Short-term debts incurred with companies of the group and affiliates |
0 |
8.642.406 |
0 |
7.163.784 |
|
20,64 % |
|
Deudas a Corto Plazo |
1.223.152 |
4.049.738 |
2.751.755 |
4.631.393 |
-55,55 % |
-12,56 % |
|
|
2011 |
2010 |
Change 2011 -
2010 |
|||
|
|
Company |
Sector |
Company |
Sector |
Company |
Sector |
|
Net total sales |
52.243.825 |
71.272.936 |
50.370.454 |
66.168.567 |
3,72 % |
7,71 % |
|
+ Other Operating Income |
1.527.647 |
1.129.671 |
331.012 |
592.847 |
361,51 % |
90,55 % |
|
= OPERATING
INCOMES |
53.771.472 |
72.402.608 |
50.701.466 |
66.761.414 |
6,06 % |
8,45 % |
|
- Miscellaneous operating expenses |
-13.808.199 |
-14.421.344 |
-13.126.834 |
-13.104.364 |
-5,19 % |
-10,05 % |
|
- Operating consumption |
-33.165.924 |
-36.503.442 |
-25.356.813 |
-35.647.711 |
-30,80 % |
-2,40 % |
|
= COMPANY ADDED
VALUE |
6.797.349 |
21.477.822 |
12.217.819 |
18.009.339 |
-44,37 % |
19,26 % |
|
- Staff costs |
-7.505.716 |
-10.488.629 |
-12.072.017 |
-10.071.722 |
37,83 % |
-4,14 % |
|
= GROSS OPERATING
RESULT |
-708.367 |
10.989.193 |
145.802 |
7.937.617 |
-585,84 % |
38,44 % |
|
- Amortization of Fixed Assets |
-2.337.785 |
-2.644.264 |
-2.389.040 |
-2.576.111 |
2,15 % |
-2,65 % |
|
- Turnover provisions variation |
0 |
32.566 |
0 |
20.149 |
|
61,63 % |
|
+ Obsolescence and Results from Disposal of Fixed Assets and Others |
0 |
66.821 |
0 |
-640.580 |
|
110,43 % |
|
+ Other Results |
141.202 |
-82.941 |
315.758 |
67.225 |
-55,28 % |
-223,38 % |
|
= OPERATING
RESULT |
-2.904.950 |
8.361.672 |
-1.927.480 |
4.808.300 |
-50,71 % |
73,90 % |
|
+ Financial income |
395.372 |
460.764 |
-116.001 |
39.977 |
440,84 % |
1.052,56 % |
|
- Financial expenditure |
-502.098 |
-1.001.133 |
-400.859 |
-849.423 |
-25,26 % |
-17,86 % |
|
- Obsolescence and Variation of Financial Instruments |
0 |
-47.732 |
0 |
-5.735 |
|
-732,28 % |
|
= RESULT BEFORE
TAXES |
-3.011.676 |
7.773.571 |
-2.444.340 |
3.993.119 |
-23,21 % |
94,67 % |
|
- Corporation tax |
1.327.472 |
-638.983 |
1.856.956 |
-860.302 |
-28,51 % |
25,73 % |
|
+Resultado del ejercicio procedente de operaciones interrumpidas neto
de impuestos |
0 |
0 |
0 |
32.450 |
|
-100,00 % |
|
= FINANCIAL YEAR RESULT |
-1.684.204 |
7.134.588 |
-587.384 |
3.165.267 |
-186,73
% |
125,40
% |
STATEMENT OF CHANGES IN NET WORTH
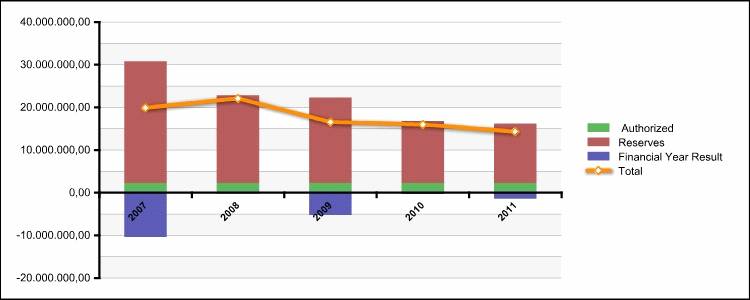
Trend of Net Worth
|
Total statement of changes in equity |
2007 |
2008 |
2009 |
2010 |
2011 |
|
|
Authorized |
2.007.340 |
2.007.340 |
2.007.340 |
2.007.340 |
2.007.340 |
|
|
Reserves |
28.544.280 |
20.543.388 |
20.058.656 |
14.556.236 |
13.968.852 |
|
|
Financial Year Result |
-10.641.380 |
-484.732 |
-5.502.420 |
-587.384 |
-1.684.204 |
|
|
Total |
19.910.240 |
22.065.996 |
16.563.576 |
15.976.192 |
14.291.988 |
|
|
|
|
|
Profit and Loss
Statement submitted in the fiscal year.
Data is taken
from the annual Profit and Loss Statement submitted by the company in its
Annual Accounts for the fiscal year [ejercicio del balances].
|
Profit and Loss
Statement submitted in the fiscal year |
2011 |
2010 |
|
A) RESULT IN PROFIT
AND LOSS ACCOUNT |
-1.684.204 |
-587.384 |
|
I. Due to valuation of financial instruments. |
0 |
0 |
|
1. Financial assets available for sales |
0 |
0 |
|
2. Other income/expense. |
0 |
0 |
|
II. For coverage of cash flow. |
0 |
0 |
|
III. Grants, donations and bequests received |
0 |
141.750 |
|
IV. Due to actuarial profits and losses and other adjustments |
0 |
0 |
|
V. Due to non-current assets and linked liabilities, held for sales |
0 |
0 |
|
VI. Conversion differences. |
0 |
0 |
|
VII. Tax effect |
0 |
-42.525 |
|
B) Total income
and expense directly allocated to net assets (I + II + III + IV + V + VI +
VII) |
0 |
99.225 |
|
VIII. Due to valuation of financial instruments. |
0 |
0 |
|
1. Financial assets available for sales |
0 |
0 |
|
2. Other income/expense. |
0 |
0 |
|
IX. For coverage of cash flow. |
0 |
0 |
|
X. Grants, donations and bequests received |
0 |
-141.750 |
|
XI. Due to non-current assets and linked liabilities, held for sales |
0 |
0 |
|
XII. Conversion differences. |
0 |
0 |
|
XIII. Tax effect. |
0 |
42.525 |
|
C) Total
transfers made to profit and loss account (VIII + IX + X + XI + XII + XIII) |
0 |
-99.225 |
|
TOTAL INCOME
AND EXPENSE ACKNOWLEDGED (A + B + C) |
-1.684.204 |
-587.384 |
Source of data
Data is taken from the annual Profit and Loss Statement submitted by the company in its Annual Accounts for the fiscal year [ejercicio del balances].
|
Total statement of changes in
equity |
|
Total |
Total |
Total |
Total |
|
|
A) BALANCE, AS OF END OF FISCAL YEAR 2009 |
511 |
2.007.340 |
20.058.656 |
-5.502.420 |
16.563.576 |
|
|
I. Adjustments due to criteria changes in fiscal year 2009 and
previous ones |
512 |
0 |
0 |
0 |
0 |
|
|
II. Adjustments due to errors in fiscal year 2009 and previous
ones |
513 |
0 |
0 |
0 |
0 |
|
|
B) ADJUSTED BALANCE, AS OF BEGINNING OF FISCAL YEAR 2010 |
514 |
2.007.340 |
20.058.656 |
-5.502.420 |
16.563.576 |
|
|
I. Total income and expense acknowledged |
515 |
0 |
0 |
-587.384 |
-587.384 |
|
|
II. Transactions with partners or owners |
516 |
0 |
0 |
0 |
0 |
|
|
1.- Capital increases |
517 |
0 |
0 |
0 |
0 |
|
|
2.- (-) Capital reductions |
518 |
0 |
0 |
0 |
0 |
|
|
3. Conversion of financial liabilities into net assets
(conversion of debentures, debt relief). |
519 |
0 |
0 |
0 |
0 |
|
|
4. ( - ) Distribution of dividends. |
520 |
0 |
0 |
0 |
0 |
|
|
5. Transactions with own shares and participation (net). |
521 |
0 |
0 |
0 |
0 |
|
|
6. Increase (decrease) of net assets resulting from a
combination of businesses. |
522 |
0 |
0 |
0 |
0 |
|
|
7. Other transactions with partners or owners. |
523 |
0 |
0 |
0 |
0 |
|
|
III. Other net assets variations |
524 |
0 |
-5.502.420 |
5.502.420 |
0 |
|
|
C) BALANCE, AS OF END OF FISCAL YEAR 2010 |
511 |
2.007.340 |
14.556.236 |
-587.384 |
15.976.192 |
|
|
I. Adjustments due to criteria changes in fiscal year 2010 |
512 |
0 |
0 |
0 |
0 |
|
|
II. Adjustments due to errors in fiscal year 2010 |
513 |
0 |
0 |
0 |
0 |
|
|
D) ADJUSTED BALANCE, AS OF BEGINNING OF FISCAL YEAR 2011 |
514 |
2.007.340 |
14.556.236 |
-587.384 |
15.976.192 |
|
|
I. Total income and expense acknowledged |
515 |
0 |
0 |
-1.684.204 |
-1.684.204 |
|
|
II. Transactions with partners or owners |
516 |
0 |
0 |
0 |
0 |
|
|
1.- Capital increases |
517 |
0 |
0 |
0 |
0 |
|
|
2.- (-) Capital reductions |
518 |
0 |
0 |
0 |
0 |
|
|
3. Conversion of financial liabilities into net assets
(conversion of debentures, debt relief). |
519 |
0 |
0 |
0 |
0 |
|
|
4. ( - ) Distribution of dividends. |
520 |
0 |
0 |
0 |
0 |
|
|
5. Transactions with own shares and participation (net). |
521 |
0 |
0 |
0 |
0 |
|
|
6. Increase (decrease) of net assets resulting from a
combination of businesses. |
522 |
0 |
0 |
0 |
0 |
|
|
7. Other transactions with partners or owners |
523 |
0 |
0 |
0 |
0 |
|
|
III. Other net assets variations |
524 |
0 |
-587.384 |
587.384 |
0 |
|
|
E) BALANCE, AS OF END OF FISCAL YEAR 2011 |
525 |
2.007.340 |
13.968.852 |
-1.684.204 |
14.291.988 |
|
CASHFLOW STATEMENT
Model: Normal
Source of information: Data contained in this section is taken from the information declared in the Annual Accounts submitted to the Trade Register.
|
|
Code |
2011 |
2010 |
2009 |
2008 |
2007 |
|
|
1. Fiscal year result
before taxes. |
61100 |
-3.011.676 |
-2.444.340 |
-9.386.847 |
-2.022.746 |
-12.510.546 |
|
|
2. Results adjustments. |
61200 |
2.002.679 |
6.888.097 |
9.046.112 |
3.734.563 |
16.497.777 |
|
|
a)
Fixed Assets Amortization (+). |
61201 |
2.337.785 |
2.389.040 |
3.464.769 |
3.059.183 |
3.126.871 |
|
|
b)
Obsolescence Allowances (+/-). |
61202 |
-300.630 |
0 |
0 |
0 |
0 |
|
|
c) Variation
in Provision (+/-). |
61203 |
327.655 |
3.982.197 |
4.705.010 |
485.156 |
13.489.815 |
|
|
g)
Financial income (-). |
61207 |
-105.557 |
-38.406 |
-539 |
-19.585 |
-1.130.896 |
|
|
h)
Financial Expenses (+). |
61208 |
33.241 |
400.859 |
1.078.919 |
20.769 |
1.011.987 |
|
|
i)
Exchange differences (+/-). |
61209 |
-289.815 |
154.407 |
-202.047 |
189.040 |
0 |
|
|
3. Changes in current
capital equity. |
61300 |
2.876.716 |
-1.214.731 |
875.152 |
-733.038 |
-1.705.358 |
|
|
a)
Stock (+/-). |
61301 |
7.052.922 |
-4.334.849 |
121.158 |
389.241 |
1.636.674 |
|
|
d)
Debtors and other accounts receivable (+/-). |
61302 |
-2.193.117 |
2.112.077 |
-1.380.845 |
7.974.380 |
-5.266.067 |
|
|
c)
Other current assets (+/-). |
61303 |
35.462 |
-1.627.880 |
2.681 |
-354.264 |
2.877 |
|
|
d)
Creditors and other accounts payable (+/-). |
61304 |
-1.576.737 |
2.662.562 |
5.153.773 |
-2.122.860 |
1.673.497 |
|
|
f)
Other non-current assets and liabilities (+/-). |
61306 |
-441.814 |
-26.641 |
-3.021.615 |
-6.619.535 |
247.661 |
|
|
4. Other cash flows for
operating activities. |
61400 |
-1.349.115 |
235.161 |
1.495.093 |
957.976 |
118.909 |
|
|
a)
Interest payments (-). |
61401 |
-33.241 |
-9.313 |
-27.661 |
-20.769 |
-1.011.987 |
|
|
b)
Dividend payment collection (+). |
61402 |
105.557 |
38.406 |
539 |
19.585 |
0 |
|
|
c)
Interest collection (+). |
61403 |
0 |
0 |
0 |
0 |
1.130.896 |
|
|
d)
Income tax payment collection (payments) (+/-). |
61404 |
189.822 |
2.694.600 |
628.326 |
959.160 |
0 |
|
|
e)
Other payments (payment collection) (-/+) |
61405 |
-1.611.253 |
-2.488.532 |
893.889 |
0 |
0 |
|
|
5. Operating activity
cash flows (1 + 2 + 3 + 4) |
61500 |
518.604 |
3.464.187 |
2.029.510 |
1.936.755 |
2.400.782 |
|
|
6. Payments for
investment (-). |
62100 |
-1.030.002 |
-4.324.473 |
-620.691 |
-1.616.393 |
0 |
|
|
a)
Companies of the group and affiliates. |
62101 |
529.975 |
-3.450.000 |
0 |
0 |
0 |
|
|
h)
Other assets. |
62108 |
-1.559.977 |
-874.473 |
-620.691 |
-1.616.393 |
0 |
|
|
7. Divestment payment
collection (+). |
62200 |
0 |
0 |
0 |
0 |
2.004.388 |
|
|
b)
Intangible fixed assets. |
62202 |
0 |
0 |
0 |
0 |
161.228 |
|
|
c)
Fixed assets. |
62203 |
0 |
0 |
0 |
0 |
1.843.160 |
|
|
8. Investment activity
cash flows (6 + 7) minus Amortization |
62300 |
-1.030.002 |
-4.324.473 |
-620.691 |
-1.616.393 |
-1.122.483 |
|
|
9. Payment collection and
payments for equity instruments. |
63100 |
0 |
0 |
0 |
0 |
0 |
|
|
a)
Issuance of equity instruments (+). |
63101 |
0 |
0 |
0 |
10.641.380 |
13.375.952 |
|
|
b)
Amortization of assets instruments (-). |
63102 |
0 |
0 |
0 |
0 |
-13.375.952 |
|
|
10. Payment collection
and payments for financial liabilities instruments. |
63200 |
0 |
-35.941 |
-435.949 |
0 |
-2.006.831 |
|
|
a)
Issuance |
63201 |
0 |
0 |
0 |
0 |
240.399 |
|
|
3.
Debts incurred with companies of the group and affiliates (+). |
63204 |
0 |
0 |
0 |
0 |
209.428 |
|
|
5.
Other debts (+). |
63206 |
0 |
0 |
0 |
0 |
30.971 |
|
|
b)
Repayment and amortization of |
63207 |
0 |
-35.941 |
-435.949 |
0 |
-2.247.230 |
|
|
2.
Debts incurred with credit institutions (-). |
63209 |
0 |
0 |
-435.949 |
0 |
-2.033.737 |
|
|
4. Special
characteristic debts (-). |
63211 |
0 |
0 |
0 |
0 |
-213.493 |
|
|
11. Payments from
dividends and remunerations from other assets instruments. |
63300 |
0 |
0 |
0 |
0 |
0 |
|
|
12. Cash flows for
financing activities (9+10+11). |
63400 |
0 |
-35.941 |
-435.949 |
0 |
-2.006.831 |
|
|
D) EFECTO DE LAS
VARIACIONES DE LOS TIPOS DE CAMBIO |
64000 |
359.854 |
-158.894 |
167.742 |
-189.040 |
0 |
|
|
E) NET INCREASE/DECREASE
OF CASH OR EQUIVALENT ASSETS (+/-5+/-8+/12+/-D) |
65000 |
-151.544 |
-1.055.121 |
1.140.612 |
131.322 |
-728.532 |
|
|
Cash
or equivalent assets as of beginning of the fiscal year. |
65100 |
332.443 |
1.387.564 |
246.952 |
115.630 |
844.162 |
|
|
Cash
or equivalent assets as of end of the fiscal year. |
65200 |
180.899 |
332.443 |
1.387.564 |
246.952 |
115.630 |
|
EVENTS AFTER CLOSURE
|
Financial Year 2011 |
|
Están en trámites todas las gestiones encaminadas a cumplir con
los compromisos asumidos con todas las partes y en especial con los
trabajadores según el ERE firmado. |
|
Financial Year 2006 |
|
A fecha de formulación de las cuentas, los Administradores han
iniciado conversaciones con el comité representante de los trabajadores con
el fin de analizar y exponer posibles alternativas en relación con el
compromiso adquirido por la Sociedad con el Ayuntamiento de Alcalá de Henares
relativo a la planta de producción y el abandono de su ubicación actual. |
|
Financial Year 2003 |
|
DURANTE EL MES DE FEBRERO DE 2004, LA SOCIEDAD HA VENDIDO EN LA BOLSA
DE NUEVA YORK LA PARTICIPACION QUE OSTENTABA DE LA SOCIEDAD IVAX CORPORATION
OBTENIENDO POR ELLO UNA PLUSVALIA QUE ASCIENDE A 1.6 MILLONES DE EUROS. PARA
EL EJERCICIO 2004 LA SOCIEDAD PA |
AUDITORIAS DE CUENTAS ANUALES
|
Financial Year |
Auditor's Company |
Audit Date |
Result |
Audit Cost |
Other Services |
Cost of other Services |
|
2011 |
KPMG AUDITORES SL |
02/04/2012 |
|
25.500 |
|
|
|
2010 |
KPMG AUDITORES SL |
01/04/2011 |
|
25.500 |
|
|
|
2009 |
KPMG AUDITORES SL |
01/04/2010 |
|
25.000 |
|
|
|
2008 |
KPMG AUDITORES SL |
01/04/2009 |
|
35.000 |
|
|
|
2007 |
KPMG AUDITORES SL |
18/04/2008 |
|
34.500 |
|
|
|
2006 |
KPMG AUDITORES SL |
02/04/2007 |
|
33.000 |
|
|
|
2005 |
ERNST & YOUNG SL |
07/04/2006 |
|
31.579 |
|
|
|
2004 |
ERNST & YOUNG SL |
20/05/2005 |
|
24.000 |
|
|
|
2003 |
PRICEWATERHOUSECOOPERS AUDITORES SL |
26/05/2004 |
|
27.128 |
|
|
|
2002 |
PRICEWATERHOUSECOOPERS AUDITORES SL |
25/04/2003 |
|
|
|
|
|
2001 |
PRICEWATERHOUSECOOPERS AUDITORES SL |
01/04/2002 |
|
|
|
|
|
2000 |
PRICEWATERHOUSECOOPERS AUDITORES SL |
02/04/2001 |
|
|
|
|
FINANCING SOURCES
Bank
At Year End 2009
|
Financial Entity |
NO ESPECIFICADA |
|
Type of product |
POLIZA DE CREDITO |
|
Limit granted |
6.400.000,00 Euros |
|
Balance at closure |
35.941,00 Euros |
|
Source |
Foot notes to the Balance 2009 of QUIMICA
SINTETICA SA |
At Year End 2007
|
Financial Entity |
NO ESPECIFICADA |
|
Type of product |
POLIZA DE CREDITO |
|
Short term amount |
212.484,00 Euros |
|
Limit granted |
4.658.000,00 Euros |
|
Balance at closure |
212.484,00 Euros |
|
Source |
Foot notes to the Balance 2007 of QUIMICA
SINTETICA SA |
|
Financial Entity |
NO ESPECIFICADA |
|
Type of product |
ARRENDAMIENTO FINANCIERO (LEASING) |
|
Short term amount |
82.758,00 Euros |
|
Balance at closure |
82.758,00 Euros |
|
Source |
Foot notes to the Balance 2007 of QUIMICA
SINTETICA SA |
At Year End 2006
|
Financial Entity |
NO ESPECIFICADA |
|
Type of product |
POLIZA DE CREDITO |
|
Short term amount |
480.990,00 Euros |
|
Limit granted |
4.850.000,00 Euros |
|
Balance at closure |
480.990,00 Euros |
|
Source |
Foot notes to the Balance 2006 of QUIMICA
SINTETICA SA |
|
Financial Entity |
NO ESPECIFICADA |
|
Type of product |
ARRENDAMIENTO FINANCIERO (LEASING) |
|
Limit granted |
755.000,00 Euros |
|
Balance at closure |
280.876,00 Euros |
|
Notes |
Contrato de leasing para la adquisición de máquinas. La duración
del contrato es de 4,5 años y ya se han amortizado 38 cuotas. El valor de la
opción de compra asciende a 16.270,00 euros. |
|
Source |
Foot notes to the Balance 2006 of QUIMICA
SINTETICA SA |
|
Financial Entity |
NO ESPECIFICADA |
|
Type of product |
ARRENDAMIENTO FINANCIERO (LEASING) |
|
Short term amount |
15.375,00 Euros |
|
Limit granted |
117.422,00 Euros |
|
Balance at closure |
15.375,00 Euros |
|
Notes |
Contrato de leasing para la adquisición de mobiliario. La
duración del contrato es de 4 años y ya se han amortizado 43 cuotas. El valor
de la opción de compra asciende a 2.555,00 euros. |
|
Source |
Foot notes to the Balance 2006 of QUIMICA
SINTETICA SA |
|
Financial Entity |
NO ESPECIFICADA |
|
Type of product |
PRESTAMO |
|
Short term amount |
420.026,00 Euros |
|
Long term amount |
420.026,00 Euros |
|
Balance at closure |
1.765.231,00 Euros |
|
Notes |
El vencimiento del préstamo está establecido en el año 2010. |
|
Source |
Foot notes to the Balance 2006 of QUIMICA
SINTETICA SA |
At Year End 2005
|
Financial Entity |
NO ESPECIFICADA |
|
Type of product |
POLIZA DE CREDITO |
|
Short term amount |
3.566.904,00 Euros |
|
Limit granted |
6.200.000,00 Euros |
|
Balance at closure |
3.566.904,00 Euros |
|
Source |
Foot notes to the Balance 2005 of QUIMICA
SINTETICA SA |
|
Financial Entity |
NO ESPECIFICADA |
|
Type of product |
PRESTAMO |
|
Short term amount |
479.747,00 Euros |
|
Long term amount |
479.747,00 Euros |
|
Balance at closure |
2.358.747,00 Euros |
|
Source |
Foot notes to the Balance 2005 of QUIMICA
SINTETICA SA |
|
Financial Entity |
NO ESPECIFICADA |
|
Type of product |
ARRENDAMIENTO FINANCIERO (LEASING) |
|
Short term amount |
262.403,00 Euros |
|
Long term amount |
262.403,00 Euros |
|
Balance at closure |
601.466,00 Euros |
|
Source |
Foot notes to the Balance 2005 of QUIMICA
SINTETICA SA |
At Year End 2004
|
Financial Entity |
NO ESPECIFICADA |
|
Type of product |
POLIZA DE CREDITO |
|
Limit granted |
4.102.024,00 Euros |
|
Balance at closure |
3.412.574,00 Euros |
|
Source |
Foot notes to the Balance 2004 of QUIMICA
SINTETICA SA |
|
Financial Entity |
BANCO BILBAO VIZCAYA ARGENTARIA, S.A. |
|
Type of product |
PRESTAMO |
|
Short term amount |
479.747,00 Euros |
|
Long term amount |
479.747,00 Euros |
|
Balance at closure |
2.838.493,00 Euros |
|
Notes |
INTERES DEL 3.25% |
|
Source |
Foot notes to the Balance 2004 of QUIMICA
SINTETICA SA |
|
Financial Entity |
NO ESPECIFICADA |
|
Type of product |
ARRENDAMIENTO FINANCIERO (LEASING) |
|
Short term amount |
262.009,00 Euros |
|
Long term amount |
262.009,00 Euros |
|
Balance at closure |
862.936,00 Euros |
|
Source |
Foot notes to the Balance 2004 of QUIMICA
SINTETICA SA |
Non-bank
At Year End 2011
|
Name |
CHEMO ESPAÑA SL |
|
Type of product |
SALDOS |
|
Debit balance |
13.973,00 Euros |
|
Credit Balance |
214.370,00 Euros |
|
Source |
Foot notes to the Balance 2011 of QUIMICA
SINTETICA SA |
|
Name |
CHEMO ESPAÑA SL |
|
Type of product |
CUENTA CORRIENTE |
|
Balance at closure |
70.554,00 Euros |
|
Source |
Foot notes to the Balance 2011 of QUIMICA
SINTETICA SA |
GUARANTEES
At Year End 2011
|
Guaranteed Company |
QUIMICA SINTETICA SA |
|
Guarantee Amount |
273.911,00 Euros |
|
Source |
Foot notes to the Balance 2011 of QUIMICA
SINTETICA SA |
At Year End 2010
|
Guaranteed Company |
QUIMICA SINTETICA SA |
|
Guarantee Amount |
333.546,00 Euros |
|
Notes |
Avales bancarios y otras garantías como avales contingentes. |
|
Source |
Foot notes to the Balance 2010 of QUIMICA
SINTETICA SA |
At Year End 2004
|
Guaranteed Company |
QUIMICA SINTETICA SA |
|
Guarantee Amount |
178.600,00 Euros |
|
Notes |
A FAVOR DE TERCEROS |
|
Source |
Foot notes to the Balance 2004 of QUIMICA
SINTETICA SA |
At Year End 2003
|
Guarantee Company |
BANCO SANTANDER CENTRAL HISPANO SA |
|
Guaranteed Company |
QUIMICA SINTETICA SA |
|
Guarantee Amount |
528.891,00 Euros |
|
Entity in charge of the management |
BANCO SANTANDER CENTRAL HISPANO, S.A. |
|
Notes |
A FAVOR DE SU PROVEEDOR |
|
Source |
Foot notes to the Balance 2003 of QUIMICA
SINTETICA SA |
|
Guarantee Company |
BANCO SANTANDER CENTRAL HISPANO SA |
|
Guaranteed Company |
QUIMICA SINTETICA SA |
|
Guarantee Amount |
92.820,00 Euros |
|
Entity in charge of the management |
BANCO SANTANDER CENTRAL HISPANO, S.A. |
|
Notes |
A FAVOR DE LA TESORERIA DE LA SEGURIDAD SOCIAL |
|
Source |
Foot notes to the Balance 2003 of QUIMICA
SINTETICA SA |
|
Guarantee Company |
BANCO SANTANDER CENTRAL HISPANO SA |
|
Guaranteed Company |
QUIMICA SINTETICA SA |
|
Guarantee Amount |
89.931,00 Euros |
|
Entity in charge of the management |
BANCO SANTANDER CENTRAL HISPANO, S.A. |
|
Notes |
A FAVOR DE LA ADMINISTRACION A.T. BARCELONA |
|
Source |
Foot notes to the Balance 2003 of QUIMICA
SINTETICA SA |
|
Guarantee Company |
BANCO SANTANDER CENTRAL HISPANO SA |
|
Guaranteed Company |
QUIMICA SINTETICA SA |
|
Guarantee Amount |
57.746,00 Euros |
|
Entity in charge of the management |
BANCO SANTANDER CENTRAL HISPANO, S.A. |
|
Notes |
A FAVOR DE HACIENDA |
|
Source |
Foot notes to the Balance 2003 of QUIMICA
SINTETICA SA |
|
Guarantee Company |
BANCO SANTANDER CENTRAL HISPANO SA |
|
Guaranteed Company |
QUIMICA SINTETICA SA |
|
Guarantee Amount |
12.020,00 Euros |
|
Entity in charge of the management |
BANCO SANTANDER CENTRAL HISPANO, S.A. |
|
Notes |
A FAVOR DE HACIENDA |
|
Source |
Foot notes to the Balance 2003 of QUIMICA
SINTETICA SA |
|
Guarantee Company |
BANCO SANTANDER CENTRAL HISPANO SA |
|
Guaranteed Company |
QUIMICA SINTETICA SA |
|
Guarantee Amount |
10.729,00 Euros |
|
Entity in charge of the management |
BANCO SANTANDER CENTRAL HISPANO, S.A. |
|
Notes |
A FAVOR DE HACIENDA |
|
Source |
Foot notes to the Balance 2003 of QUIMICA
SINTETICA SA |
|
Guarantee Company |
BANCO SANTANDER CENTRAL HISPANO SA |
|
Guaranteed Company |
QUIMICA SINTETICA SA |
|
Guarantee Amount |
6.840,00 Euros |
|
Entity in charge of the management |
BANCO SANTANDER CENTRAL HISPANO, S.A. |
|
Notes |
A FAVOR DE SU PROVEEDOR |
|
Source |
Foot notes to the Balance 2003 of QUIMICA
SINTETICA SA |
|
Guarantee Company |
BANCO SANTANDER CENTRAL HISPANO SA |
|
Guaranteed Company |
QUIMICA SINTETICA SA |
|
Guarantee Amount |
6.010,00 Euros |
|
Entity in charge of the management |
BANCO SANTANDER CENTRAL HISPANO, S.A. |
|
Notes |
A FAVOR DE HACIENDA |
|
Source |
Foot notes to the Balance 2003 of QUIMICA
SINTETICA SA |
|
Guarantee Company |
BANCO SANTANDER CENTRAL HISPANO SA |
|
Guaranteed Company |
QUIMICA SINTETICA SA |
|
Guarantee Amount |
2.164,00 Euros |
|
Entity in charge of the management |
BANCO SANTANDER CENTRAL HISPANO, S.A. |
|
Notes |
A FAVOR DE HACIENDA |
|
Source |
Foot notes to the Balance 2003 of QUIMICA
SINTETICA SA |
REGISTRY DATA
|
Mercantile Registry: |
BARCELONA |
|
Register Data: |
8 Hoja Registral: 52020 |
|
Date of formation: |
17/06/1950 |
|
Corporate Purpose published in the Borme: |
LA FABRICACION, COMPRA-VENTA, DISTRIBUCION Y TODA CLASE DE
NEGOCIOS, INCLUSO DE IMPORT-EXPORT. RELACIONADOS CON PRODUCTOS QUIMICOS Y FARMACEUTICOS,
TANTO EN SU ASPECTO INDUSTRIAL COMO COMERCIAL, Y EN TODAS SUS RAMAS.LA
GESTION DE VALORES DE ENTIDADES NO RESIDENTES . FECHA DE
PUBLICACION 07/03/2001 |
|
Registered Office: |
C/ GRAN VIA DE CARLES III, 98 7. -BARCELONA- |
|
Auditor / Auditing Firm / Year: |
BORJA GUINEA LOPEZ / KPMG AUDITORES SL /
2011BORJA GUINEA LOPEZ / KPMG AUDITORES SL /
2010BORJA GUINEA LOPEZ / KPMG AUDITORES SL /
2009BORJA GUINEA LOPEZ / KPMG AUDITORES SL /
2008BORJA GUINEA LOPEZ / KPMG AUDITORES SL /
2007BORJA GUINEA LOPEZ / KPMG AUDITORES SL /
2006MANUEL BACHILLER BAEZA / ERNST & YOUNG SL /
2005MANUEL BACHILLER BAEZA / ERNST & YOUNG SL /
2004JAVIER BERZOSA / PRICEWATERHOUSECOOPERS AUDITORES SL
/ 2003MIGUEL MARTIN RABADAN / PRICEWATERHOUSECOOPERS
AUDITORES SL / 2002MIGUEL MARTIN RABADAN /
PRICEWATERHOUSECOOPERS AUDITORES SL / 2001MIGUEL MARTIN RABADAN
/ PRICEWATERHOUSECOOPERS AUDITORES SL / 2000 |
|
Audit Opinion: |
02/04/2012 |
|
Auditing Firm fees: |
25.500,00 Euros |
CHRONOLOGICAL SUMMARY
Note: ![]() Important
Important ![]() Very Important
Very Important
|
1990 |
Appointments/ Re-elections (1) Cessations/ Resignations/ Reversals (1)
|
|
1991 |
Accounts deposit (ejer. 1989, 1990) Appointments/ Re-elections (2)
|
|
1992 |
Accounts deposit (ejer. 1991)
Appointments/ Re-elections (4) Cessations/ Resignations/ Reversals (3)
|
|
1993 |
Accounts deposit (ejer. 1992) Appointments/ Re-elections (3) Cessations/ Resignations/ Reversals (2) Modification of Powers (1)
|
|
1994 |
Accounts deposit (ejer. 1993) Appointments/ Re-elections (1) Cessations/ Resignations/ Reversals (1)
Errata (2) |
|
1995 |
Appointments/ Re-elections (1) Cessations/ Resignations/ Reversals (1) |
|
1996 |
Accounts deposit (ejer. 1994, 1995) Appointments/ Re-elections (2) Cessations/ Resignations/ Reversals (1)
|
|
1997 |
Accounts deposit (ejer. 1996) Appointments/ Re-elections (1)
|
|
1998 |
Appointments/ Re-elections (1) |
|
1999 |
Accounts deposit (ejer. 1997) Appointments/ Re-elections (2)
|
|
2000 |
Accounts deposit (ejer. 1998) Appointments/ Re-elections (5)
Cessations/ Resignations/ Reversals (1)
Other Concepts/ Events (1)
|
|
2001 |
Accounts deposit (ejer. 1999, 2000) Appointments/ Re-elections (2)
|
|
2002 |
Accounts deposit (ejer. 2001) Appointments/ Re-elections (3) Cessations/ Resignations/ Reversals (2) |
|
2003 |
Accounts deposit (ejer. 2002) Appointments/ Re-elections (2) Cessations/ Resignations/ Reversals (2) Errata (1) |
|
2004 |
Accounts deposit (ejer. 2003) Appointments/ Re-elections (3) Cessations/ Resignations/ Reversals (2) |
|
2005 |
Appointments/ Re-elections (4) Cessations/ Resignations/ Reversals (3)
Errata (2)
Other Concepts/ Events (2) |
|
2006 |
Accounts deposit (ejer. 2004) Appointments/ Re-elections (6) Cessations/ Resignations/ Reversals (2) |
|
2007 |
Accounts deposit (ejer. 2005, 2006) Appointments/ Re-elections (4) Cessations/ Resignations/ Reversals (3) |
|
2008 |
Accounts deposit (ejer. 2007) Appointments/ Re-elections (3) Cessations/ Resignations/ Reversals (3) |
|
2009 |
Accounts deposit (ejer. 2008) Appointments/ Re-elections (6) Cessations/ Resignations/ Reversals (5) |
|
2010 |
Appointments/ Re-elections (2) |
|
2011 |
Accounts deposit (ejer. 2009, 2010) Appointments/ Re-elections (6) Cessations/ Resignations/ Reversals (6) |
|
2012 |
Accounts deposit (ejer. 2011) Appointments/ Re-elections (4) Cessations/ Resignations/ Reversals (3) Other Concepts/ Events (1) |
|
2013 |
Appointments/ Re-elections (1) Cessations/ Resignations/ Reversals (1) |
|
2014 |
Appointments/ Re-elections (1) |
MAIN HISTORIC CHANGES
|
Concept |
Publication |
Act |
Date |
|
|
|
|
|
|
Corporate Purpose Changes: |
LA FABRICACION, COMPRA-VENTA, DISTRIBUCION Y TODA CLASE DE
NEGOCIOS, INCLUSO DE IMPORT-EXPORT., RELACIONADOS CON PRODUCTOS QUIMICOS Y FARMACEUTICOS,
TANTO EN SU ASPECTO INDUSTRIAL COMO COMERCIAL, Y EN TODAS SUS RAMAS. |
Corporate Purpose Change |
31/05/1996 |
BREAKDOWN OF OWNERS EQUITY
|
Current Notarised Capital: |
2.007.380,43 EUROS |
|
Current Paid-up Capital: |
2.007.380,43 EUROS |
|
Nominal value: |
48,08 EUROS |
|
Shares: |
41.751 |
|
Source: |
BORME / 2011 |
UPDATED EVOLUTION
OF THE SUBSCRIBED AND PAID-IN CAPITAL
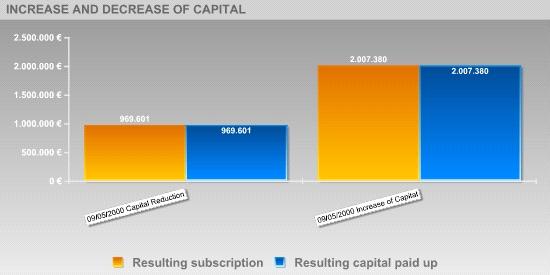
|
Inscription date |
Type of Registration |
Capital Subscribed |
Paid up capital |
Underwritten result |
Disbursed Result |
|
09/05/2000 |
Increase of Capital |
1.037.779,62€ |
1.037.779,62€ |
2.007.380,43€ |
2.007.380,43€ |
|
09/05/2000 |
Capital Reduction |
-1.037.779,62€ |
-1.037.779,62€ |
969.600,81€ |
969.600,81€ |
|
08/06/1991 |
Capital call payment |
- € |
375.824,89€ |
- € |
- € |
|
31/07/1990 |
Capital call payment |
- € |
98.974,67€ |
- € |
- € |
ACTIVE SOCIAL BODIES
Órganos Sociales
Activos - Total: 8
|
Cargo publicado |
Nombre Órgano Social |
Fecha Nombramiento |
Otros Cargos en esta Sociedad |
|
SINGLE PARTNER |
CHEMO ESPAÑA SOCIEDAD LIMITADA |
16/12/2005 |
1 |
|
PRESIDENT |
MANUEL JESUS GREGORIO FERNANDEZ PALENCIA |
21/10/2013 |
6 |
|
MEMBER OF THE BOARD |
FRANCISCO JAVIER MORAN IMAZ |
21/10/2013 |
16 |
|
MEMBER OF THE BOARD |
IGNACIO PONCE GUTIERREZ |
21/10/2013 |
3 |
|
MEMBER OF THE BOARD |
MANUEL JESUS GREGORIO FERNANDEZ PALENCIA |
21/10/2013 |
6 |
|
NON CONSELLOR SECRETARY |
ISABEL ALCALDE GIRAUDO |
21/10/2013 |
22 |
|
VICE SECRETARY |
FRANCISCO JAVIER MORAN IMAZ |
21/10/2013 |
16 |
|
ACCOUNTS' AUDITOR / HOLDER |
KPMG AUDITORES SOCIEDAD LIMITADAS |
14/01/2014 |
4 |
HISTORICAL SOCIAL BODIES
Formerly Active Governing Bodies - Total: 26
|
Social Body's Name |
Post published |
End Date |
Other Positions in this Company |
|
ATTILIO CALZOLARI |
MEMBER OF THE BOARD |
24/08/2007 |
15 |
|
|
MEMBER OF THE BOARD |
11/08/2008 |
|
|
|
MEMBER OF THE BOARD |
14/08/2009 |
|
|
|
MEMBER OF THE BOARD |
27/08/2010 |
|
|
|
MEMBER OF THE BOARD |
03/05/2011 |
|
|
CARLOS ALBERTO CAGNI GONZALEZ |
MEMBER OF THE BOARD |
31/08/1992 |
11 |
|
|
MEMBER OF THE BOARD |
16/06/1993 |
|
|
|
MEMBER OF THE BOARD |
18/10/1995 |
|
|
|
NON CONSELLOR SECRETARY |
02/10/1990 |
|
|
|
SECRETARY |
31/08/1992 |
|
|
|
SECRETARY |
16/06/1993 |
|
|
CARLOS LENS CABRERA |
MEMBER OF THE BOARD |
16/06/1993 |
5 |
|
|
PRESIDENT |
16/06/1993 |
|
|
CARLOS PICORNELL DARDER |
MEMBER OF THE BOARD |
18/10/1995 |
22 |
|
|
MEMBER OF THE BOARD |
29/08/1996 |
|
|
|
MEMBER OF THE BOARD |
04/09/1997 |
|
|
|
MEMBER OF THE BOARD |
03/09/1998 |
|
|
|
MEMBER OF THE BOARD |
28/07/1999 |
|
|
|
MEMBER OF THE BOARD |
09/09/2000 |
|
|
|
MEMBER OF THE BOARD |
17/09/2001 |
|
|
|
MEMBER OF THE BOARD |
05/09/2002 |
|
|
|
PRESIDENT |
18/10/1995 |
|
|
|
PRESIDENT |
29/08/1996 |
|
|
|
PRESIDENT |
04/09/1997 |
|
|
|
PRESIDENT |
03/09/1998 |
|
|
|
PRESIDENT |
28/07/1999 |
|
|
|
PRESIDENT |
09/09/2000 |
|
|
|
PRESIDENT |
17/09/2001 |
|
|
|
PRESIDENT |
05/09/2002 |
|
|
COOPERS LYBRAND SOCIEDAD ANONIMA |
ACCOUNTS' AUDITOR / HOLDER |
07/03/2000 |
1 |
|
DER KNAAP S BESLOTEN VENNOOTSCHAP |
SINGLE PARTNER |
16/12/2005 |
1 |
|
ERNST AND YOUNG SOCIEDAD LIMITADA |
ACCOUNTS' AUDITOR / HOLDER |
12/02/2007 |
1 |
|
EUGENIO PALLUCCA |
MEMBER OF THE BOARD |
01/10/2003 |
6 |
|
|
MEMBER OF THE BOARD |
27/08/2004 |
|
|
|
MEMBER OF THE BOARD |
28/11/2005 |
|
|
|
MEMBER OF THE BOARD |
01/06/2006 |
|
|
FRANCISCO JAVIER MORAN IMAZ |
MEMBER OF THE BOARD |
28/11/2005 |
16 |
|
|
MEMBER OF THE BOARD |
02/08/2006 |
|
|
|
MEMBER OF THE BOARD |
24/08/2007 |
|
|
|
MEMBER OF THE BOARD |
11/08/2008 |
|
|
|
MEMBER OF THE BOARD |
24/02/2009 |
|
|
|
MEMBER OF THE BOARD |
27/08/2010 |
|
|
|
MEMBER OF THE BOARD |
08/08/2011 |
|
|
|
MEMBER OF THE BOARD |
31/07/2012 |
|
|
|
MEMBER OF THE BOARD |
21/10/2013 |
|
|
|
VICE SECRETARY |
14/08/2009 |
|
|
|
VICE SECRETARY |
27/08/2010 |
|
|
|
VICE SECRETARY |
08/08/2011 |
|
|
|
VICE SECRETARY |
31/07/2012 |
|
|
|
VICE SECRETARY |
21/10/2013 |
|
|
FULVIO BENIGNI |
MEMBER OF THE BOARD |
31/08/1992 |
7 |
|
HUGO ARNOLDO SIGMAN POMERANT |
MEMBER OF THE BOARD |
02/10/1990 |
6 |
|
|
MEMBER OF THE BOARD |
31/08/1992 |
|
|
|
CHIEF EXECUTIVE OFFICER |
31/08/1992 |
|
|
|
PRESIDENT |
02/10/1990 |
|
|
|
PRESIDENT |
31/08/1992 |
|
|
IGNACIO MUT PASOS |
MEMBER OF THE BOARD |
02/01/2004 |
2 |
|
ISABEL ALCALDE GIRAUDO |
NON CONSELLOR SECRETARY |
29/08/1996 |
22 |
|
|
NON CONSELLOR SECRETARY |
04/09/1997 |
|
|
|
NON CONSELLOR SECRETARY |
03/09/1998 |
|
|
|
NON CONSELLOR SECRETARY |
28/07/1999 |
|
|
|
NON CONSELLOR SECRETARY |
09/09/2000 |
|
|
|
NON CONSELLOR SECRETARY |
17/09/2001 |
|
|
|
NON CONSELLOR SECRETARY |
05/09/2002 |
|
|
|
NON CONSELLOR SECRETARY |
01/10/2003 |
|
|
|
NON CONSELLOR SECRETARY |
27/08/2004 |
|
|
|
NON CONSELLOR SECRETARY |
28/11/2005 |
|
|
|
NON CONSELLOR SECRETARY |
02/08/2006 |
|
|
|
NON CONSELLOR SECRETARY |
24/08/2007 |
|
|
|
NON CONSELLOR SECRETARY |
11/08/2008 |
|
|
|
NON CONSELLOR SECRETARY |
14/08/2009 |
|
|
|
NON CONSELLOR SECRETARY |
27/08/2010 |
|
|
|
NON CONSELLOR SECRETARY |
08/08/2011 |
|
|
|
NON CONSELLOR SECRETARY |
31/07/2012 |
|
|
|
NON CONSELLOR SECRETARY |
21/10/2013 |
|
|
JOSE MARIA GELPI VINTRO |
MEMBER OF THE BOARD |
29/08/1996 |
17 |
|
|
MEMBER OF THE BOARD |
04/09/1997 |
|
|
|
MEMBER OF THE BOARD |
03/09/1998 |
|
|
|
MEMBER OF THE BOARD |
28/07/1999 |
|
|
|
MEMBER OF THE BOARD |
17/09/2001 |
|
|
|
MEMBER OF THE BOARD |
05/09/2002 |
|
|
|
MEMBER OF THE BOARD |
01/10/2003 |
|
|
|
MEMBER OF THE BOARD |
27/08/2004 |
|
|
|
MEMBER OF THE BOARD |
14/01/2005 |
|
|
|
PRESIDENT |
01/10/2003 |
|
|
|
PRESIDENT |
27/08/2004 |
|
|
|
PRESIDENT |
14/01/2005 |
|
|
JOSE MARIA GELPI VITRO |
MEMBER OF THE BOARD |
09/09/2000 |
1 |
|
KENNETH CAMERON |
MEMBER OF THE BOARD |
02/10/1990 |
3 |
|
|
MEMBER OF THE BOARD |
31/08/1992 |
|
|
|
MEMBER OF THE BOARD |
16/06/1993 |
|
|
KPMG AUDITORES SOCIEDAD LIMITADAS |
ACCOUNTS' AUDITOR / HOLDER |
22/12/2010 |
4 |
|
|
ACCOUNTS' AUDITOR / HOLDER |
03/02/2011 |
|
|
|
ACCOUNTS' AUDITOR / HOLDER |
14/01/2014 |
|
|
LUIS YAGUE GIL |
MEMBER OF THE BOARD |
02/10/1990 |
3 |
|
|
CHIEF EXECUTIVE OFFICER |
02/10/1990 |
|
|
MANUEL JESUS GREGORIO FERNANDEZ PALENCIA |
MEMBER OF THE BOARD |
08/08/2011 |
6 |
|
|
MEMBER OF THE BOARD |
31/07/2012 |
|
|
|
MEMBER OF THE BOARD |
21/10/2013 |
|
|
PAOLO OLIGERI |
MEMBER OF THE BOARD |
28/11/2005 |
13 |
|
|
MEMBER OF THE BOARD |
02/08/2006 |
|
|
|
MEMBER OF THE BOARD |
24/08/2007 |
|
|
|
MEMBER OF THE BOARD |
18/03/2008 |
|
|
|
PRESIDENT |
28/11/2005 |
|
|
|
PRESIDENT |
02/08/2006 |
|
|
|
PRESIDENT |
24/08/2007 |
|
|
|
PRESIDENT |
18/03/2008 |
|
|
PEDRO ANDRES REBOLLO |
MEMBER OF THE BOARD |
27/08/2004 |
25 |
|
|
MEMBER OF THE BOARD |
28/11/2005 |
|
|
|
MEMBER OF THE BOARD |
02/08/2006 |
|
|
|
MEMBER OF THE BOARD |
24/08/2007 |
|
|
|
MEMBER OF THE BOARD |
11/08/2008 |
|
|
|
MEMBER OF THE BOARD |
14/08/2009 |
|
|
|
MEMBER OF THE BOARD |
27/08/2010 |
|
|
|
MEMBER OF THE BOARD |
08/08/2011 |
|
|
|
MEMBER OF THE BOARD |
31/07/2012 |
|
|
|
MEMBER OF THE BOARD |
21/10/2013 |
|
|
|
PRESIDENT |
11/08/2008 |
|
|
|
PRESIDENT |
14/08/2009 |
|
|
|
PRESIDENT |
27/08/2010 |
|
|
|
PRESIDENT |
08/08/2011 |
|
|
|
PRESIDENT |
31/07/2012 |
|
|
|
PRESIDENT |
21/10/2013 |
|
|
PRICEWATERHAUSECOOPERS AUDITORES SOCIEDAD LIMITADA |
ACCOUNTS' AUDITOR / HOLDER |
17/09/2001 |
4 |
|
|
ACCOUNTS' AUDITOR / HOLDER |
05/09/2002 |
|
|
|
ACCOUNTS' AUDITOR / HOLDER |
20/01/2004 |
|
|
|
ACCOUNTS' AUDITOR / HOLDER |
03/02/2005 |
|
|
PRICEWATERHOUSECOOPERS SOCIEDAD LIMITADA |
ACCOUNTS' AUDITOR / HOLDER |
09/09/2000 |
1 |
|
ROBERTO CHARLES FELDER |
MEMBER OF THE BOARD |
01/10/2003 |
1 |
|
SANTIAGO MIGUEL CARSI ZEGRI |
MEMBER OF THE BOARD |
18/10/1995 |
16 |
|
|
MEMBER OF THE BOARD |
29/08/1996 |
|
|
|
MEMBER OF THE BOARD |
04/09/1997 |
|
|
|
MEMBER OF THE BOARD |
03/09/1998 |
|
|
|
MEMBER OF THE BOARD |
28/07/1999 |
|
|
|
MEMBER OF THE BOARD |
09/09/2000 |
|
|
|
MEMBER OF THE BOARD |
17/09/2001 |
|
|
|
MEMBER OF THE BOARD |
05/09/2002 |
|
|
|
MEMBER OF THE BOARD |
02/11/2002 |
|
|
|
SECRETARY |
18/10/1995 |
|
|
SILVIA GOLD TURJANSKY |
MEMBER OF THE BOARD |
02/10/1990 |
2 |
|
|
VICE CHAIRMAN |
02/10/1990 |
|
VINCULACIONES Y ANALISIS DE LA
INFLUENCIA
Summary of
business environment influence:
PROBABILITY OF
DEFAULT
|
|
TOTAL |
Maximum |
High |
Moderate |
Minimal |
Unclassified |
|
Shareholders |
1 |
|
|
|
|
1 |
|
Companies it participates in |
2 |
|
|
|
|
2 |
|
Companies' split-ups, takeovers and mergers |
2 |
2 |
|
|
|
|
|
Companies with granted credits |
1 |
|
|
|
|
1 |
|
Companies linked by corporate bodies |
3 |
|
1 |
|
2 |
|
|
Other relations |
1 |
|
|
|
|
1 |
Full description
of business environment influence :
Shareholders
|
Entity |
Capital share |
Status |
Size |
Liquidity |
Solvency |
Indebtedness level |
Probability of Default |
|
CHEMO ESPAÑA SL |
100 % |
ACTIVE |
LARGE |
0.35 |
0.73 |
2.82 |
|
Companies it participates in
|
Entity |
Capital share |
Status |
Size |
Liquidity |
Solvency |
Indebtedness level |
Probability of Default |
|
CHEMSOURCE CORPORATION (PUERTO RICO) |
25.37 % |
|
|
|
|
|
|
|
IVAX CORPORATION |
0.16 % |
|
|
|
|
|
|
Companies' split-ups, takeovers and mergers
Taken over companies
|
Entity |
Status |
Size |
Liquidity |
Solvency |
Indebtedness level |
Probability of Default |
|
QS ALCALA INMOBILIARIA SL |
TERMINATION |
|
|
|
|
Máximo |
|
INTEXIM SA |
TERMINATION |
SMALL |
0.12 |
0.28 |
2.01 |
Máximo |
Companies with granted credits
|
Entity |
Status |
Size |
Credit Maturity Date |
Balance at Loan End Date |
Liquidity |
Solvency |
Indebtedness level |
Probability of Default |
|
CHEMO ESPAÑA SL |
ACTIVE |
LARGE |
31/12/2018 |
9.235.000 |
0.35 |
0.73 |
2.82 |
|
Companies linked by corporate bodies
Correlations by corporate bodies and addresses
|
Entity |
Capital share |
Status |
Size |
Liquidity |
Solvency |
Indebtedness level |
Probability of Default |
|
UNIVERSAL FARMA SL |
|
ACTIVE |
SMALL |
0.00 |
2.45 |
0.69 |
Elevado |
|
LABORATORIOS LICONSA SA |
|
ACTIVE |
LARGE |
0.00 |
1.44 |
0.89 |
Mínimo |
|
CHEMO IBERICA SA |
|
ACTIVE |
MEDIUM |
0.01 |
0.80 |
0.83 |
Mínimo |
Other relations
|
Entity |
Status |
Size |
Liquidity |
Solvency |
Indebtedness level |
Probability of Default |
|
KEVILMARE ESPAÑA SL |
ACTIVE WITH PARTIAL DIVISION OF CAPITAL |
LARGE |
0.00 |
0.47 |
0.18 |
|
QUALITY AND ENVIRONMENTAL
CERTIFICATIONS
Quality
Certificate
|
Regulation |
Certificate |
Scope |
Publication Source |
|
UNE-EN ISO 9001:2000 |
ER-0217/1998 |
EL DISEÑO Y EL DESARROLLO DE RUTAS DE SÍNTESIS Y LA PRODUCCIÓN
DE PRINCIPIOS ACTIVOS FARMACÉUTICOS. |
AENOR |
REMUNERATION
WAGES AND SALARIES EARNED BY MEMBERS OF THE BOARD OF DIRECTORS DURING THE FISCAL YEAR 2011 AMOUNT TO 0,00 EUROS OF REMUNERATION IN THE FORM OF WAGES AND PROFESSIONAL FEES.
DETALLE DE SUBVENCIONES
APARECIDAS EN BOLETINES Y DIARIOS PUBLICOS OFICIALES
As Published 2010
|
Entity |
CONSEJERÍA DE ECONOMÍA Y HACIENDA. INSTITUTO MADRILEÑO DE
DESARROLLO (IMADE). COMUNIDAD AUTONOMA DE MADRID |
|
|
18/02/2010 |
|
|
ORDEN DE 30 DE DICIEMBRE DE 2008,
POR LA QUE SE MODIFICA LA ORDEN 360/2006, DE 17 DE ENERO, POR LA QUE SE REGULA
EL PLAN DE INNOVACIÓN EMPRESARIAL DE LA COMUNIDAD DE MADRID (2006-2009) Y SE
REALIZA LA CONVOCATORIA PARA EL AÑO 2009 (BOLETÍN OFICIAL DE LA COMUNIDAD DE
MADRID DE 26 DE ENERO DE 2009). |
|
|
SUBSIDY AWARDED |
|
|
INVESTIGACIÓN Y DESARROLLO |
|
|
151.432,04 Euros |
|
|
0,00 Euros |
|
|
0,00 Euros |
|
Entity |
MINISTERIO DE INDUSTRIA, TURISMO Y COMERCIO |
|
|
19/04/2010 |
|
|
RESOLUCIÓN DE 6 DE ABRIL DE 2010,
DE LA OFICINA ESPAÑOLA DE PATENTES Y MARCAS,POR LA QUE SE PUBLICAN LAS AYUDAS
CONCEDIDAS EN LA MODALIDAD DE SUBVENCIÓN PARA EL FOMENTO DE LAS SOLICITUDES
DE PATENTES EN EL EXTERIOR. |
|
|
SUBSIDY AWARDED |
|
|
1.797,49 Euros |
|
|
0,00 Euros |
|
|
0,00 Euros |
|
|
IDENTIFICACION DEL PROYECTO:FPE-0525 |
As Published 2009
|
Entity |
MINISTERIO DE INDUSTRIA, TURISMO Y COMERCIO |
|
|
06/04/2009 |
|
|
RESOLUCIÓN DE 23 DE MARZO DE 2009,
DE LA OFICINA ESPAÑOLA DE PATENTES Y MARCAS, POR LA QUE SE PUBLICAN LAS
AYUDAS CONCEDIDAS EN LA MODALIDAD DE SUBVENCIÓN PARA EL FOMENTO DE LAS
SOLICITUDES DE PATENTES EN EL EXTERIOR. |
|
|
SUBSIDY AWARDED |
|
|
6.226,72 Euros |
|
|
0,00 Euros |
|
|
0,00 Euros |
|
|
IDENTIFICACION DEL PROYECTO:FPE-0072 |
NEWS CLIPPINGS
News published in daily newspapers or magazines
|
la verdad |
19/03/2013 |
|
Alcalá recalificará suelo industrial para evitar cierre de
Química Sintética |
|
SECTORS OF INTEREST THAT HAVE
CONSULTED THIS ENTERPRISE
|
Sector |
2003 (30) |
2004 (36) |
2005 (30) |
2006 (41) |
2007 (67) |
2008 (44) |
2009 (24) |
2010 (32) |
2011 (44) |
2012 (37) |
2013 (50) |
2014 (5) |
|
|
INSURANCE AND FINANCIAL
SERVICES |
5 |
7 |
6 |
23 |
50 |
30 |
16 |
10 |
15 |
10 |
11 |
|
|
|
MISCELLANEOUS SECTORS |
10 |
7 |
6 |
|
6 |
|
2 |
4 |
3 |
3 |
1 |
4 |
|
|
ENERGY |
|
3 |
2 |
|
|
|
|
|
6 |
8 |
12 |
|
|
|
LAWYERS |
|
2 |
2 |
8 |
4 |
|
2 |
|
|
|
2 |
|
|
|
WHOLESALERS AND MIDDLEMEN |
2 |
|
2 |
|
|
|
|
|
4 |
4 |
5 |
1 |
|
|
MARKETING/PUBLICITY AND
PUBLIC RELATIONS |
|
|
|
|
|
|
1 |
1 |
4 |
5 |
7 |
|
|
|
AUDITORS, ECONOMISTS AND
CONSULTANTS |
|
4 |
4 |
|
2 |
|
|
|
2 |
5 |
|
|
|
|
INDIVIDUALS |
|
|
|
5 |
|
2 |
2 |
|
4 |
|
4 |
|
|
|
CHEMISTRY |
4 |
6 |
|
|
2 |
|
|
|
|
|
2 |
|
|
|
AGENCIES AND CONSULTANCIES |
|
|
2 |
|
|
1 |
|
2 |
4 |
|
|
|
|
|
BUILDING INDUSTRY / REAL
ESTATE AND PUBLIC WORKS |
5 |
|
|
|
|
2 |
|
2 |
|
|
|
|
|
|
FOOD SECTOR, BEVERAGES AND
TOBACCO |
|
|
|
|
|
5 |
|
2 |
|
|
|
|
|
|
PRESS, EDITORIAL AND NEWS
AGENCIES |
|
7 |
|
|
|
|
|
|
|
|
|
|
|
|
MANUFACTURE, REPAIR AND RENT
OF CONSUMER GOODS |
|
|
2 |
2 |
|
|
|
3 |
|
|
|
|
|
|
COMPUTER SCIENCE, OFFIMATIC
AND ELECTRONIC |
3 |
|
|
|
|
1 |
|
2 |
|
|
|
|
|
|
MANUFACTURE AND RENT OF MACHINERY,
ELECTRIC MATERIAL AND PRECISSION EQUIPMENT |
|
|
|
|
|
2 |
|
|
|
|
4 |
|
|
|
TELECOMMUNICATION |
|
|
|
|
|
|
|
2 |
|
|
2 |
|
|
|
TRADE REPORTS |
1 |
|
|
1 |
1 |
1 |
|
|
|
|
|
|
|
|
HEALTH |
|
|
4 |
|
|
|
|
|
|
|
|
|
|
|
GRAPHIC ARTS, EDITION,
REPRODUCTION |
|
|
|
|
|
|
|
2 |
|
|
|
|
|
|
ASSOCIATIONS, ORGANISATIONS,
POLITICAL PARTIES |
|
|
|
|
|
|
|
2 |
|
|
|
|
|
|
VEHICLES, SPARE PARTS AND
ACCESSORIES |
|
|
|
|
|
|
|
|
|
2 |
|
|
|
|
INVESTIGATORS/BAD DEBTS
CHARGE/SECURITY |
|
|
|
|
2 |
|
|
|
|
|
|
|
|
|
HOTEL MANAGEMENT AND TOURISM |
|
|
|
|
|
|
|
|
2 |
|
|
|
|
|
OTHER BUSINESS ACTIVITIES |
|
|
|
2 |
|
|
|
|
|
|
|
|
|
|
PUBLIC ADMINISTRATION |
|
|
|
|
|
|
1 |
|
|
|
|
|
|
FOREIGN EXCHANGE RATES
|
Currency |
Unit
|
Indian Rupees |
|
US Dollar |
1 |
Rs.62.48 |
|
UK Pound |
1 |
Rs.102.95 |
|
Euro |
1 |
Rs.84.60 |
INFORMATION DETAILS
|
Report Prepared
by : |
MNL |
RATING EXPLANATIONS
|
RATING |
STATUS |
PROPOSED CREDIT LINE |
|
|
>86 |
Aaa |
Possesses an extremely sound financial base with the strongest
capability for timely payment of interest and principal sums |
Unlimited |
|
71-85 |
Aa |
Possesses adequate working capital. No caution needed for credit
transaction. It has above average (strong) capability for payment of interest
and principal sums |
Large |
|
56-70 |
A |
Financial & operational base are regarded healthy. General unfavourable
factors will not cause fatal effect. Satisfactory capability for payment of
interest and principal sums |
Fairly Large |
|
41-55 |
Ba |
Overall operation is considered normal. Capable to meet normal
commitments. |
Satisfactory |
|
26-40 |
B |
Capability to
overcome financial difficulties seems comparatively below average. |
Small |
|
11-25 |
Ca |
Adverse factors are apparent. Repayment of interest and principal sums
in default or expected to be in default upon maturity |
Limited with full
security |
|
<10 |
C |
Absolute credit risk exists. Caution needed to be exercised |
Credit not
recommended |
|
-- |
NB |
New Business |
-- |
This score serves as a reference to assess SC’s credit risk and
to set the amount of credit to be extended. It is calculated from a composite
of weighted scores obtained from each of the major sections of this report. The
assessed factors and their relative weights (as indicated through %) are as
follows:
Financial
condition (40%) Ownership
background (20%) Payment
record (10%)
Credit history
(10%) Market trend
(10%) Operational
size (10%)
This report is issued at your request without any
risk and responsibility on the part of MIRA INFORM PRIVATE LIMITED (MIPL)
or its officials.