MIRA
INFORM REPORT
|
Report Date : |
03.02.2014 |
IDENTIFICATION DETAILS
|
Name : |
STICHTING INTERNATIONAL DISPENSARY
ASSOCIATION |
|
|
|
|
Registered Office : |
Slochterweg 35 1027AA Amsterdam Netherlands |
|
|
|
|
Country : |
Netherland |
|
|
|
|
Financials (as on) : |
31.12.2012 |
|
|
|
|
Date of Incorporation : |
21.11.1982 |
|
|
|
|
Reg. No.: |
33170905 |
|
|
|
|
Legal Form : |
Stichting |
|
|
|
|
Line of Business : |
Wholesale of pharmaceutical goods (46461) |
|
|
|
|
No. of Employees : |
166 |
RATING & COMMENTS
|
MIRA’s Rating : |
Ba |
|
RATING |
STATUS |
PROPOSED CREDIT LINE |
|
|
41-55 |
Ba |
Overall operation is considered normal. Capable to meet normal
commitments. |
Satisfactory |
|
Status : |
Satisfactory |
|
|
|
|
Payment Behaviour : |
No Complaints |
|
|
|
|
Litigation : |
Clear |
NOTES :
Any query related to this report can be made
on e-mail : infodept@mirainform.com
while quoting report number, name and date.
ECGC Country Risk Classification List – September 30, 2013
|
Country Name |
Previous Rating (30.06.2013) |
Current Rating (30.09.2013) |
|
Netherland |
A1 |
A1 |
|
Risk Category |
ECGC
Classification |
|
Insignificant |
A1 |
|
Low |
A2 |
|
Moderate |
B1 |
|
High |
B2 |
|
Very High |
C1 |
|
Restricted |
C2 |
|
Off-credit |
D |
NETHERLAND - ECONOMIC OVERVIEW
The Dutch economy is the sixth-largest economy in the
euro-zone and is noted for its stable industrial relations, moderate unemployment
and inflation, a sizable trade surplus, and an important role as a European
transportation hub. Industrial activity is predominantly in food processing,
chemicals, petroleum refining, and electrical machinery. A highly mechanized
agricultural sector employs only 2% of the labor force but provides large
surpluses for the food-processing industry and for exports. The Netherlands,
along with 11 of its EU partners, began circulating the euro currency on 1
January 2002. After 26 years of uninterrupted economic growth, the Dutch
economy - highly dependent on an international financial sector and
international trade - contracted by 3.5% in 2009 as a result of the global
financial crisis. The Dutch financial sector suffered, due in part to the high
exposure of some Dutch banks to U.S. mortgage-backed securities. In 2008, the
government nationalized two banks and injected billions of dollars of capital
into other financial institutions, to prevent further deterioration of a
crucial sector. The government also sought to boost the domestic economy by
accelerating infrastructure programs, offering corporate tax breaks for
employers to retain workers, and expanding export credit facilities. The
stimulus programs and bank bailouts, however, resulted in a government budget
deficit of 5.3% of GDP in 2010 that contrasted sharply with a surplus of 0.7%
in 2008. The government of Prime Minister Mark RUTTE began implementing fiscal
consolidation measures in early 2011, mainly reductions in expenditures, which
resulted in an improved budget deficit in 2011. In 2012 tax revenues dropped
nearly 9%, GDP contracted, and the budget deficit deteriorated. Although
jobless claims continued to grow, the unemployment rate remained relatively low
at 6.8 percent.
|
Source
: CIA |
Summary
|
Company
name Operative address |
STICHTING
INTERNATIONAL DISPENSARY ASSOCIATION Slochterweg 35 1027AA Amsterdam Netherlands |
|
Legal form Registration
number VAT-number |
Stichting 33170905 002956184 |
|
Year |
2012 |
|
Mutation |
2011 |
|
Mutation |
2010 |
|
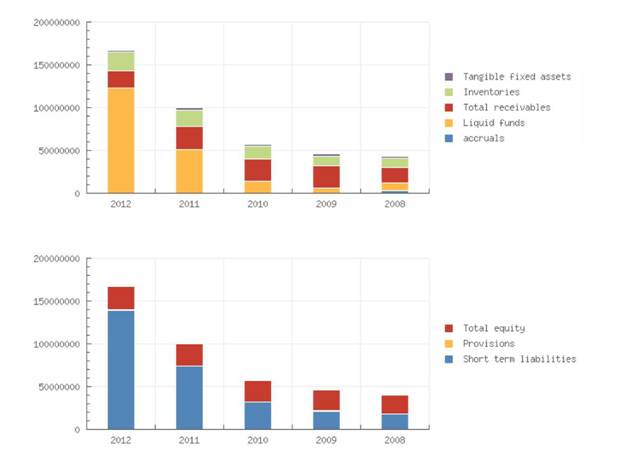
Fixed
assets |
2.392.000 |
|
5,61 |
2.265.000 |
|
-2,62 |
2.326.000 |
|
Total
receivables |
20.298.000 |
|
-24,04 |
26.721.000 |
|
4,90 |
25.474.000 |
|
|
|||||||
|
Total
equity |
27.308.000 |
|
8,43 |
25.184.000 |
|
0,38 |
25.089.000 |
|
Short term
liabilities |
139.159.000 |
* |
87,02 |
74.408.000 |
|
131,82 |
32.098.000 |
|
|
|||||||
|
Net result |
2.124.000 |
* |
2.135,79 |
95.000 |
|
-89,71 |
923.000 |
|
|
|||||||
|
Working
capital |
25.568.000 |
|
11,17 |
23.000.000 |
|
0,70 |
22.840.000 |
|
Quick ratio |
1,03 |
|
-1,90 |
1,05 |
|
-14,63 |
1,23 |
Contact information
Company name Stichting
International Dispensary Association
Trade names Stichting
International Dispensary Association IDA Foundation
IDA
HIV/AIDS Group
Stichting
I.D.A.
Operative address Slochterweg
35
1027AA Amsterdam
Netherlands
Correspondence address Postbus
37098
1030AB Amsterdam
Netherlands
Telephone number 020
4033051
Fax number 020
4031854
Email address info@idafoundation.org
Website www.idafoundation.org
Registration
Registration number 33170905
Registered in Kamer van
Koophandel Amsterdam
Branch number 000010277897
VAT-number 002956184
Status Active
Memorandum 1972-11-21
Establishment date 1982-11-21
Legal form Stichting
Last proposed admendment 2004-11-30
Activities
SBI Wholesale of
pharmaceutical goods (46461)
Exporter No
Importer No
Goal Groothandel in
medicijnen voor ontwikkelingslanden
Relations
Companies on same address
Stichting Ida Charity Foundation
Registration number: 412119530000
IDA International Holding B.V.
Registration number: 342260630000
IDA International Services B.V.
Registration number: 342260740000
IDA
International Participatie B.V.
Registration number: 342260810000age
ment
E.J. de Voogd (Edwin Johannes)
Netherlands
Competence: Fully authorized
Function: Manager
Starting date: 2007-12-01
Date of birth: 1961-02-21, Middelburg, NL
J.M.J. Blom (Johannes Maria Jacobus)
Netherlands
Competence: Jointly authorized
Function: Chairman
Starting date: 2007-12-01
Date of birth: 1943-05-14, Tilburg, NL
W.J.G. Gort-Krist (Wendelina Jantina
Grietje)
Netherlands
Competence: Limited authorization
Function: Proxy
Starting date: 1999-07-01
Date of birth: 1952-12-12, Termunten, NL
P. Roelofs (Peter)
Netherlands
Competence: Limited authorization
Function: Proxy
Starting date: 2005-05-02
Date of birth: 1965-10-17, Hattem, NL
P.C.J. Seure (Petrus Cornelis Johannes)
Netherlands
Competence: Limited authorization
Function: Proxy
Starting date: 2007-03-01
Date of birth: 1969-03-08, Harmelen, NL
W.O. Schimmel (Willem Otto)
Netherlands
Competence: Limited authorization
Function: Proxy
Starting date: 2007-03-01
Date of birth: 1966-05-27, Apeldoorn, NL
V. Segovia Sman (Vicente)
Netherlands
Competence: Limited authorization
Function: Proxy
Starting date: 2008-06-13
Date of birth: 1969-01-21, Wormerveer, NL
M. Neve (Maarten)
Netherlands
Competence: Limited authorization
Function: Proxy
Starting date: 2009-01-01
Date of birth: 1972-12-29, Velsen, NL
G. van der Meijden-Slijkhuis (Geertrui)
Netherlands
Competence: Limited authorization
Function: Proxy
Starting date: 2009-01-12
Date of birth: 1967-01-11, Castricum, NL
Active management
S.Y. Ng (Suit Yi)
Netherlands
Competence: Limited authorization
Function: Proxy
Starting date: 2009-01-12
Date of birth: 1978-08-19, Amsterdam, NL
J.M. van Engen (Joost Martijn)
Netherlands
Competence: Limited authorization
Function: Proxy
Starting date: 2009-01-01
Date of birth: 1974-02-21, Heiloo, NL
M.J. de Goeje (Michaël Jan)
Netherlands
Competence: Limited authorization
Function: Proxy
Starting date: 2009-02-01
Date of birth: 1955-07-23, Delft, NL
V. Jansen-Klaassen (Vanessa)
Netherlands
Competence: Limited authorization
Function: Proxy
Starting date: 2010-01-01
Date of birth: 1980-08-18, Heerhugowaard, NL
C.Y. Lepargneur (Caroline Yvonne)
Netherlands
Competence: Limited authorization
Function: Proxy
Starting date: 2010-01-01
Date of birth: 1977-10-10, Toul, FR
D. Morais da Silva (Denise)
Netherlands
Competence: Limited authorization
Function: Proxy
Starting date: 2010-01-01
Date of birth: 1980-06-21, Belo Horizonte,
BR
N.P.M. Bablon (Nicolas Pierre Marie)
Netherlands
Competence: Limited authorization
Function: Proxy
Starting date: 2010-01-01
Date of birth: 1969-05-09, Lille, FR
M. Brdar (Mirko)
Netherlands
Competence: Limited authorization
Function: Proxy
Starting date: 2010-09-27
Date of birth: 1966-09-30, Amsterdam, NL
A. Kraaijeveld (Adriaan)
Netherlands
Function: Member of the Board of Trustees
Starting date: 2004-11-30
Date of birth: 1958-01-12, Breda, NL
M.W. Günsberg (Marek Willem)
Netherlands
Function: Member of the Board of Trustees
Starting date: 2004-11-30
Date of birth: 1948-10-02, Oldenzaal, NL
W.J. Bannenberg (Willibrord Jozef)
Netherlands
Function: Member of the Board of Trustees
Starting date: 2004-11-30
Date of birth: 1952-12-06, Naaldwijk, NL
A.C.W. ten Bruggencate (Albert Cornelis
Willem)
Netherlands
Function: Member of the Board of Trustees
Starting date: 2009-06-11
Date of birth: 1947-06-09, De Bilt, NL
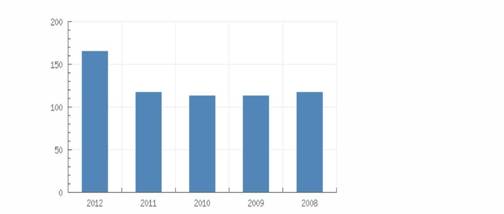
Employees
Year 2012 2011 2010
2009 2008
Total 166
118 114
114 118
Key Figures
|
Score
Description |
8 Payments made under regular condition |
|
|
|
|
|
|
|||||
|
|
|||||
|
Year |
2012 |
2011 |
2010 |
2009 |
2008 |
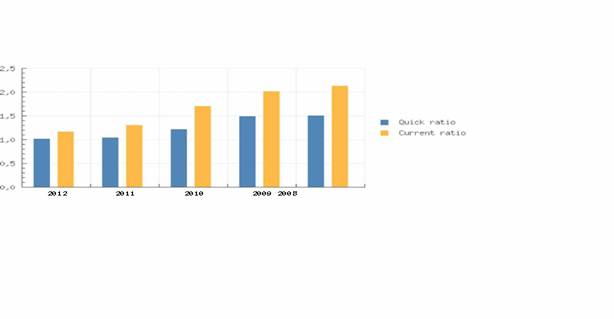
|
Quick ratio |
1,03 |
1,05 |
1,23 |
1,50 |
1,51 |
|
Current
ratio |
1,18 |
1,31 |
1,71 |
2,02 |
2,14 |
|
|
|||||
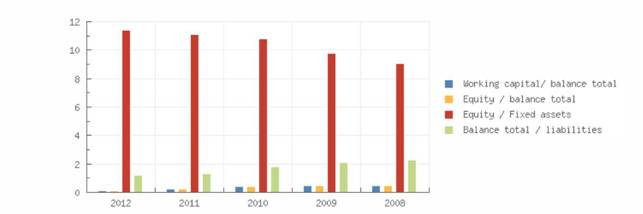
|
Working
capital/ balance total |
0,15 |
0,23 |
0,40 |
0,48 |
0,50 |
|
Equity /
balance total |
0,16 |
0,25 |
0,44 |
0,53 |
0,56 |
|
Equity /
Fixed assets |
11,42 |
11,12 |
10,79 |
9,78 |
9,06 |
|
Equity /
liabilities |
0,20 |
0,34 |
0,78 |
1,12 |
1,28 |
|
Balance
total / liabilities |
1,20 |
1,34 |
1,78 |
2,12 |
2,28 |
|
|
|||||
|
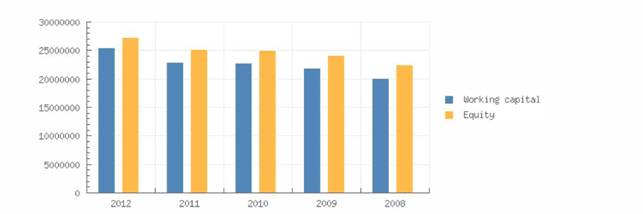
Working
capital |
25.568.000 |
23.000.000 |
22.840.000 |
21.912.000 |
20.097.000 |
|
Equity |
27.308.000 |
25.184.000 |
25.089.000 |
24.166.000 |
22.514.000 |
|
Mutation
equity |
8,43 |
0,38 |
3,82 |
7,34 |
14,77 |
|
Mutation
short term liabilities |
87,02 |
131,82 |
49,95 |
21,29 |
-15,71 |
|
|
|||||
|
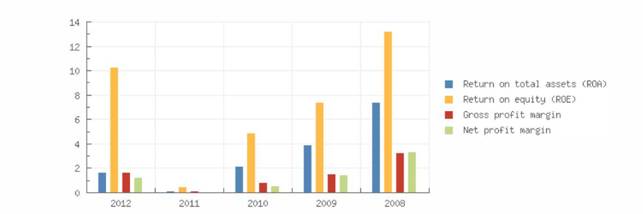
Return on
total assets (ROA) |
1,69 |
0,12 |
2,14 |
3,93 |
7,41 |
|
Return on
equity (ROE) |
10,32 |
0,47 |
4,88 |
7,45 |
13,23 |
|
Gross
profit margin |
1,67 |
0,11 |
0,81 |
1,57 |
3,26 |
|
Net profit
margin |
1,23 |
0,06 |
0,59 |
1,48 |
3,34 |
|
|
|||||
|
Year |
2012 |
2011 |
2010 |
2009 |
2008 |
|
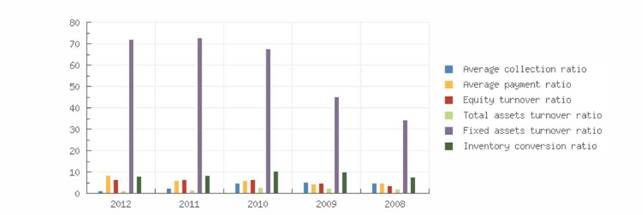
Average collection ratio |
1,24 |
2,22 |
4,91 |
5,21 |
4,85 |
|
Average payment ratio |
8,48 |
6,17 |
6,19 |
4,22 |
4,69 |
|
Equity turnover ratio |
6,31 |
6,55 |
6,28 |
4,62 |
3,80 |
|
Total assets turnover ratio |
1,03 |
1,65 |
2,75 |
2,44 |
2,13 |
|
Fixed assets turnover ratio |
72,00 |
72,80 |
67,78 |
45,12 |
34,46 |
|
Inventory conversion ratio |
8,01 |
8,45 |
10,28 |
10,01 |
7,69 |
|
|
|||||
|
Turnover |
172.219.000 |
164.896.000 |
157.666.000 |
111.542.000 |
85.590.000 |
|
Gross margin |
13.915.000 |
10.240.000 |
10.488.000 |
10.849.000 |
|
|
Operating result |
2.872.000 |
184.000 |
1.276.000 |
1.756.000 |
2.792.000 |
|
Net result after taxes |
2.124.000 |
95.000 |
923.000 |
1.652.000 |
2.856.000 |
|
|
|||||
|
Cashflow |
2.448.000 |
417.000 |
1.278.000 |
2.031.000 |
3.278.000 |
|
Gross profit |
|
164.896.000 |
157.666.000 |
111.542.000 |
85.590.000 |
|
EBIT |
2.872.000 |
184.000 |
1.276.000 |
1.756.000 |
2.792.000 |
|
EBITDA |
3.196.000 |
506.000 |
1.631.000 |
2.135.000 |
3.214.000 |
Summary
The 2012 financial result structure is a postive working captial of
25.568.000 euro, which is in agreement with 15 % of the total assets of the
company.
The working capital has increase with 11.17 % compared to previous year.
The ratio with respect to the total assets of the company has however,
declined.
The improvement between 2011 and 2012 has mainly been caused by a
current liabilities reduction.
The current ratio of the company in 2012 was 1.18. When the current
ratio is below 1.5, the company may have problems meeting its short-term
obligations.
The quick ratio in 2012 of the company was 1.03. A company with a Quick
Ratio of more than 1 can currently pay back its current liabilities.
The 2011 financial result structure is a postive working captial of
23.000.000 euro, which is in agreement with 23 % of the total assets of the
company.
The working capital remained unchanged compared to previous year. The
ratio with respect to the total assets of the company has however, declined.
The unchanged capital can be explained by a decrease in current assets
and an increase in current liabilities.
The current ratio of the company in 2011 was 1.31. When the current
ratio is below 1.5, the company may have problems meeting its short-term obligations.
The quick ratio in 2011 of the company was 1.05. A company with a Quick
Ratio of more than 1 can currently pay back its current liabilities.
Financial statement
Type of annual account Consolidated
Annual account Stichting International Dispensary Association
Slochterweg 35
1027AA Amsterdam
Netherlands
Registration number: 331709050000
|
Year |
2012 |
2011 |
2010 |
2009 |
2008 |
|
End date |
2012-12-31 |
2011-12-31 |
2010-12-31 |
2009-12-31 |
2008-12-31 |
|
Other tangible fixed assets |
|
|
|
|
2.484.000 |
|
Tangible fixed assets |
2.392.000 |
2.265.000 |
2.326.000 |
2.472.000 |
2.484.000 |
|
Fixed assets |
2.392.000 |
2.265.000 |
2.326.000 |
2.472.000 |
2.484.000 |
|
|
|||||
|
Inventories |
21.492.000 |
19.523.000 |
15.342.000 |
11.148.000 |
11.128.000 |
|
Accounts receivable |
16.900.000 |
|
24.452.000 |
25.428.000 |
14.992.000 |
|
Other receivables |
3.398.000 |
|
1.022.000 |
1.031.000 |
3.249.000 |
|
Total receivables |
20.298.000 |
26.721.000 |
25.474.000 |
26.459.000 |
18.241.000 |
|
Liquid funds |
122.937.000 |
51.164.000 |
14.122.000 |
5.711.000 |
8.376.000 |
|
accruals |
|
|
|
|
3.249.000 |
|
Current assets |
164.727.000 |
97.408.000 |
54.938.000 |
43.318.000 |
37.745.000 |
|
Total assets |
167.119.000 |
99.673.000 |
57.264.000 |
45.790.000 |
40.229.000 |
|
|
|||||
|
Total equity |
27.308.000 |
25.184.000 |
25.089.000 |
24.166.000 |
22.514.000 |
|
Provisions |
652.000 |
81.000 |
77.000 |
218.000 |
67.000 |
|
Accounts payable |
10.578.000 |
15.635.000 |
18.504.000 |
10.697.000 |
6.705.000 |
|
Other short term liabilities |
128.581.000 |
58.773.000 |
13.594.000 |
10.709.000 |
10.943.000 |
|
Short term liabilities |
139.159.000 |
74.408.000 |
32.098.000 |
21.406.000 |
17.648.000 |
|
Total short and long term
liabilities |
139.811.000 |
74.489.000 |
32.175.000 |
21.624.000 |
17.648.000 |
|
Total liabilities |
167.119.000 |
99.673.000 |
57.264.000 |
45.790.000 |
40.229.000 |
Summary The total assets of the company increased with 67.67 % between 2011 and
2012.
The fixed asset
growth of 5.61 % is lower than the total asset growth.
The asset growth
has mainly been financed by a debt increase of 8.43 %. The Net Worth,
however, grew with
87.69 %.
In 2012 the assets
of the company were 1.43 % composed of fixed assets and 98.57 % by current
assets. The assets are being financed by an equity of 16.34 %, and total debt
of 83.66 %.
The total assets
of the company increased with 74.06 % between 2010 and 2011.
Despite the assets
growth, the non current assets decreased with -2.62 %.
The asset growth
is explained by a reduction of 131.51 % of the company's indebtness, this
while, the Net Worth remains unchanged.
In 2011 the assets
of the company were 2.27 % composed of fixed assets and 97.73 % by current
assets. The assets are being financed by an equity of 25.27 %, and total debt
of 74.73 %.
|
Year |
2012 |
2011 |
2010 |
2009 |
2008 |
|
Revenues |
172.219.000 |
164.900.000 |
157.675.000 |
111.772.000 |
86.197.000 |
|
Other operating income |
|
4.000 |
9.000 |
230.000 |
607.000 |
|
Net turnover |
172.219.000 |
164.896.000 |
157.666.000 |
111.542.000 |
85.590.000 |
|
|
|||||
|
Gross margin |
13.915.000 |
10.240.000 |
10.488.000 |
10.849.000 |
|
|
|
|||||
|
Wages and salaries |
7.340.000 |
6.533.000 |
6.456.000 |
6.571.000 |
5.979.000 |
|
Amorization and depreciation |
324.000 |
322.000 |
355.000 |
379.000 |
422.000 |
|
Sales |
158.304.000 |
154.656.000 |
147.178.000 |
100.693.000 |
|
|
other operating costs |
3.379.000 |
3.205.000 |
2.410.000 |
2.373.000 |
2.793.000 |
|
Raw materials and
consumables |
|
|
|
|
74.211.000 |
|
Operating expenses |
169.347.000 |
164.716.000 |
156.399.000 |
110.016.000 |
83.405.000 |
|
Year |
2012 |
2011 |
2010 |
2009 |
2008 |
|
Operating result |
2.872.000 |
184.000 |
1.276.000 |
1.756.000 |
2.792.000 |
|
|
|||||
|
Financial income |
160.000 |
88.000 |
100.000 |
181.000 |
349.000 |
|
Financial expenses |
213.000 |
153.000 |
152.000 |
137.000 |
162.000 |
|
Financial result |
-53.000 |
-65.000 |
-52.000 |
44.000 |
187.000 |
|
Result on ordinary
operations before taxes |
2.819.000 |
119.000 |
1.224.000 |
1.800.000 |
2.979.000 |
|
|
|||||
|
Taxation on the result of
ordinary activities |
695.000 |
24.000 |
301.000 |
148.000 |
123.000 |
|
Result of ordinary
activities after taxes |
2.124.000 |
95.000 |
923.000 |
1.652.000 |
2.856.000 |
|
|
|||||
|
Net result |
2.124.000 |
95.000 |
923.000 |
1.652.000 |
2.856.000 |
Summary The
turnover of the company grew with 4.44 % between 2011 and 2012.
The gross profit
of the company grew with 35.89 % between 2011 and 2012.
The operating
result of the company grew with 1460.87 % between 2011 and 2012. This
evolution implies an
increase of the company's economic profitability.
The result of
these changes is an increase of the company's Economic Profitability of
1308.33 % of the
analysed period, being equal to 2011 % in the year 2012.
Despite the growth
the assets turnover decreased, whose index evolved with -37.58 % to a level of
1.03.
The Net Result of
the company decreased by 2135.79 % between 2011 and 2012.
The company's
Financial Profitability has been negatively affected by the financial
activities in comparison to the EBITs behaviour. The result of these variations
is a profitability reduction of 2095.74 % of the analysed period, being 10.32 %
in the year 2012.
The company's
financial structure has slowed down its financial profitability.
The turnover of
the company grew with 4.59 % between 2010 and 2011.
The gross profit
of the company decreased by -2.36 % between 2010 and 2011.
The operating
result of the company declined with -85.58 % between 2010 and 2011. This
evolution implies an decrease of the company's economic profitability.
The result of
these changes is a reduction of the company's Economic Profitability of -94.39
% of the analysed period, being equal to 2010 % in the year 2011.
This fall has
contributed to a asset turnover decrease, whose index evolved from -40 to a
level of 1.65.
The Net Result of
the company increased by -89.71 % between 2010 and 2011.
The company's
Financial Profitability has been positively affected by the financial
activities in comparison to the EBITs behaviour. The result of these variations
is a profitability increase of -90.37 % of the analysed period, being 0.47 % in
the year 2011.
The company's
financial profitability has been positively affected by its financial
structure.
Analysis
Branch (SBI) Groothandel
en Wholesale on a fee or contract basis (niet in auto’s en motorfietsen) (46)
Region Groot Amsterdam
In the Netherlands
107516 of the companies are registered with the SBI code 46
In the region
Groot Amsterdam 10265 of the companies are registered with the SBI code 46
In the Netherlands
2108 of the bankrupcties are published within this sector
In the region
Groot Amsterdam 192 of the bankruptcies are published within this sector
The risk of this
specific sector in the Netherlands is normal
The risk of this
specific sector in the region Groot Amsterdam is normal
Company structure
Relations 5
Stichting International Dispensary Association
Slochterweg 35
1027AA Amsterdam
Netherlands
Registration number: 331709050000
·
Ida ARV Procurement Services B.V.
Slochterweg 35
1027AA AMSTERDAM
Netherlands
Registration number: 341969850000
·
IDA International Holding B.V.
Slochterweg 35
1027AA AMSTERDAM
Netherlands
Registration
number: 342260630000
FOREIGN EXCHANGE RATES
|
Currency |
Unit
|
Indian Rupees |
|
US Dollar |
1 |
Rs.62.48 |
|
|
1 |
Rs.102.95 |
|
Euro |
1 |
Rs.84.60 |
INFORMATION DETAILS
|
Report Prepared
by : |
SDA |
RATING EXPLANATIONS
|
RATING |
STATUS |
PROPOSED CREDIT LINE |
|
|
>86 |
Aaa |
Possesses an extremely sound financial base with the strongest
capability for timely payment of interest and principal sums |
Unlimited |
|
71-85 |
Aa |
Possesses adequate working capital. No caution needed for credit transaction.
It has above average (strong) capability for payment of interest and
principal sums |
Large |
|
56-70 |
A |
Financial & operational base are regarded healthy. General unfavourable
factors will not cause fatal effect. Satisfactory capability for payment of
interest and principal sums |
Fairly Large |
|
41-55 |
Ba |
Overall
operation is considered normal. Capable to meet normal commitments. |
Satisfactory |
|
26-40 |
B |
Capability to overcome financial difficulties seems comparatively
below average. |
Small |
|
11-25 |
Ca |
Adverse factors are apparent. Repayment of interest and principal sums
in default or expected to be in default upon maturity |
Limited with full
security |
|
<10 |
C |
Absolute credit risk exists. Caution needed to be exercised |
Credit not
recommended |
|
-- |
NB |
New Business |
-- |
This score serves as a reference to assess SC’s credit risk and
to set the amount of credit to be extended. It is calculated from a composite
of weighted scores obtained from each of the major sections of this report. The
assessed factors and their relative weights (as indicated through %) are as
follows:
Financial
condition (40%) Ownership
background (20%) Payment
record (10%)
Credit history
(10%) Market trend
(10%) Operational
size (10%)
This report is issued at your request without any
risk and responsibility on the part of MIRA INFORM PRIVATE LIMITED (MIPL)
or its officials.