MIRA
INFORM REPORT
|
Report Date : |
15.02.2014 |
IDENTIFICATION DETAILS
|
Name : |
TROUW NUTRITION NEDERLAND
B.V. |
|
|
|
|
Registered Office : |
Nijverheidsweg 2 3881LA
Putten |
|
|
|
|
Country : |
Netherlands |
|
|
|
|
Financials (as on) : |
31.12.2012 |
|
|
|
|
Date of Incorporation : |
28.12.1972 |
|
|
|
|
Com. Reg. No.: |
08013919 |
|
|
|
|
Legal Form : |
Besloten Vennootschap |
|
|
|
|
Line of Business : |
·
Manufacturer of prepared feeds for
farm animals (1091) ·
Manufacturer of prepared pet foods
(1092) · Wholesaler of other food n.e.c. (46383) |
|
|
|
|
No of Employees : |
Not Available |
RATING & COMMENTS
|
MIRA’s Rating : |
Ba |
|
RATING |
STATUS |
PROPOSED CREDIT LINE |
|
|
41-55 |
Ba |
Overall operation is considered normal. Capable to meet normal
commitments. |
Satisfactory |
|
Status : |
Satisfactory |
|
|
|
|
Payment Behaviour : |
No Complaints |
|
|
|
|
Litigation : |
Clear |
NOTES :
Any query related to this report can be made
on e-mail : infodept@mirainform.com
while quoting report number, name and date.
ECGC Country Risk Classification List – december 01, 2013
|
Country Name |
Previous Rating (30.09.2013) |
Current Rating (01.12.2013) |
|
Netherlands |
A1 |
A1 |
|
Risk Category |
ECGC
Classification |
|
Insignificant |
A1 |
|
Low |
A2 |
|
Moderate |
B1 |
|
High |
B2 |
|
Very High |
C1 |
|
Restricted |
C2 |
|
Off-credit |
D |
NETHERLANDS - ECONOMIC OVERVIEW
The Dutch economy is the
sixth-largest economy in the euro-zone and is noted for its stable industrial relations,
moderate unemployment and inflation, a sizable trade surplus, and an important
role as a European transportation hub. Industrial activity is predominantly in
food processing, chemicals, petroleum refining, and electrical machinery. A
highly mechanized agricultural sector employs only 2% of the labor force but
provides large surpluses for the food-processing industry and for exports. The
Netherlands, along with 11 of its EU partners, began circulating the euro
currency on 1 January 2002. After 26 years of uninterrupted economic growth,
the Dutch economy - highly dependent on an international financial sector and
international trade - contracted by 3.5% in 2009 as a result of the global
financial crisis. The Dutch financial sector suffered, due in part to the high
exposure of some Dutch banks to U.S. mortgage-backed securities. In 2008, the
government nationalized two banks and injected billions of dollars of capital
into other financial institutions, to prevent further deterioration of a
crucial sector. The government also sought to boost the domestic economy by
accelerating infrastructure programs, offering corporate tax breaks for
employers to retain workers, and expanding export credit facilities. The
stimulus programs and bank bailouts, however, resulted in a government budget
deficit of 5.3% of GDP in 2010 that contrasted sharply with a surplus of 0.7%
in 2008. The government of Prime Minister Mark RUTTE began implementing fiscal
consolidation measures in early 2011, mainly reductions in expenditures, which
resulted in an improved budget deficit in 2011. In 2012 tax revenues dropped
nearly 9%, GDP contracted, and the budget deficit deteriorated. Although
jobless claims continued to grow, the unemployment rate remained relatively low
at 6.8 percent.
|
Source
: CIA |
Summary
|
||
|
Company name |
Trouw Nutrition Nederland
B.V. |
|
|
Operative address |
Nijverheidsweg 2 3881LA
Putten Netherlands |
|
|
Legal form
|
Besloten Vennootschap |
|
|
Registration number |
KvK-nummer: 08013919 |
|
|
VAT-number
|
001220093 |
|
|
Year |
2012 |
|
Mutation |
2011 |
|
Mutation |
2010 |
|
Fixed assets |
1.143.900.000 |
|
9,53 |
1.044.400.000 |
|
4,44 |
1.000.000.000 |
|
Total receivables |
1.040.800.000 |
|
0,91 |
1.031.400.000 |
|
25,19 |
823.900.000 |
|
|
|||||||
|
Total equity |
972.000.000 |
|
11,15 |
874.500.000 |
|
8,04 |
809.400.000 |
|
Short term liabilities |
1.314.800.000 |
|
5,10 |
1.251.000.000 |
|
2,04 |
1.226.000.000 |
|
|
|||||||
|
Net result |
177.600.000 |
t |
35,36 |
131.201.000 |
|
16,11 |
113.001.000 |
|
|
|||||||
|
Working capital |
359.100.000 |
* |
41,38 |
254.000.000 |
t |
84,46 |
137.700.000 |
|
Quick ratio |
0,99 |
|
2,06 |
0,97 |
|
12,79 |
0,86 |

Contact information
|
Company name |
Trouw Nutrition Nederland B.V. |
|
Trade names |
Trouw Nutrition Nederland B.V. |
|
|
Trouw Nutrition |
|
|
Farmix |
|
|
Nordos |
|
|
Farm-O-San |
|
|
|
|
Operative
address |
Nijverheidsweg 2 |
|
|
3881LA Putten |
|
|
Netherlands |
|
|
|
|
Correspondence
address |
Postbus 40 |
|
|
3880AA Putten |
|
|
Netherlands |
|
|
|
|
Telephone number |
0341371611 |
|
Fax number |
0341371600 |
|
Email address |
|
|
Website |
Registration
|
Registration
number |
KvK-nummer: 08013919 |
|
Branch number |
000020000634 |
|
VAT-number |
001220093 |
|
|
|
|
Status |
Active |
|
First
registration company register |
1973-02-07 |
|
Memorandum |
1972-12-28 |
|
Establishment
date |
1972-12-28 |
|
|
|
|
Legal form |
Besloten Vennootschap |
|
Last proposed
admendment |
1997-01-15 |
Activities
|
SBI |
Manufacture of prepared feeds for farm
animals (1091) |
|
|
Manufacture of prepared pet foods (1092) |
|
|
Wholesale of other food n.e.c. (46383) |
|
|
|
|
Exporter |
No |
|
Importer |
No |
|
|
|
|
Goal |
De fabricage en verwerking van- en de handel in voedingsmiddelen voor
mens en dier, chemische en andere voedingsstoffen, andere chemische produkten
en preparaten en daaraan verwante artikelen, stoffen en preparaten, zulks
zowel voor eigen rekening als voor rekening van derden, het deelnemen in, het
voeren van beheer over en het verlenen van diensten aan andere ondernemingen
van welke aard ook, alsmede holding |
|
|
|
|
|
|
|
|
|
|
|
Relations
|
Shareholders |
Nutreco
Nederland B.V. |
|
|
Veerstraat 38 |
|
|
5831JN Boxmeer |
|
|
Netherlands |
|
|
Registration number: 160587210000 |
|
|
Percentage: 100.00% |
|
|
|
|
Companies on
same address |
Trouw Nutrition
International B.V. |
|
|
Registration number: 081184330000 |
|
|
|
|
Liability
statements |
Nutreco N.V. |
|
|
Veerstraat 38 |
|
|
5831JN Boxmeer |
|
|
Netherlands |
|
|
Registration number: 160743050000 |
|
|
date of issue: 1997-08-06 |
|
|
Starting date: 1995-01-01 |
Management
|
Active
management |
H.
de Wildt (Harm) |
|
|
Netherlands |
|
|
Competence: Fully authorized |
|
|
Function: Manager |
|
|
Starting date: 2011-07-01 |
|
|
Date of birth: 1962-10-23, Velsen, NL |
|
|
Involved with the following companies |
|
|
|
|
|
• Trouw Nutrition Hifeed B.V. |
|
|
Veerstraat 38 |
|
|
5831JN Boxmeer |
|
|
Netherlands |
|
|
Registration number: 380215070000 |
|
|
Function: Manager |
|
|
|
|
|
• Nutreco Nederland B.V. |
|
|
Veerstraat 38 |
|
|
5831JN Boxmeer |
|
|
Netherlands |
|
|
Registration number: 160587210000 |
|
|
Function: Managing Director |
|
|
|
|
|
W.F. Kernkamp
(Willem Frederik) |
|
|
Netherlands |
|
|
Competence: Fully authorized |
|
|
Function: Manager |
|
|
Starting date: 2014-01-01 |
|
|
Date of birth: 1958-06-09, Leiden, NL |
|
|
Involved with the following companies |
|
|
|
|
|
• Sloten B.V. |
|
|
Antwerpenweg 7 |
|
|
7418CR Deventer |
|
|
Netherlands |
|
|
Registration number: 380241280000 |
|
|
Function: Manager |
|
|
|
|
|
E. van Dijk
(Eddy) |
|
|
Netherlands |
|
|
Competence: Limited authorization |
|
|
Function: Proxy |
|
|
Starting date: 2000-01-01 |
|
|
Date of birth: 1966-10-12, Ermelo, NL |
|
|
|
|
|
J.M. Bas (Jacob
Marinus) |
|
|
Netherlands |
|
|
Competence: Limited authorization |
|
|
Function: Proxy |
|
|
Starting date: 2002-05-15 |
|
|
Date of birth: 1966-08-21, Rotterdam, NL |
|
|
|
|
|
A.M.P.W. van den
Hurk (Adrianus Marcus Petrus Walteru) |
|
|
Netherlands |
|
|
Competence: Limited authorization |
|
|
Function: Proxy |
|
|
Starting date: 2002-11-01 |
|
|
Date of birth: 1965-07-27,
's-Hertogenbosch, NL |
|
|
|
|
|
R. van Emous
(Rudolf) |
|
|
Netherlands |
|
|
Competence: Limited authorization |
|
|
Function: Proxy |
|
|
Starting date: 2006-01-01 |
|
|
Date of birth: 1977-09-20, Ermelo, NL |
|
|
|
|
|
J. van
Donkersgoed (Johnny) |
|
|
Netherlands |
|
|
Competence: Limited authorization |
|
|
Function: Proxy |
|
|
Starting date: 2006-11-01 |
|
|
Date of birth: 1973-08-06, Ermelo, NL |
|
|
|
|
|
R. Ouwerkerk
(Rene) |
|
|
Netherlands |
|
|
Competence: Limited authorization |
|
|
Function: Proxy |
|
|
Starting date: 2009-02-01 |
|
|
Date of birth: 1952-05-19, Velsen, NL |
|
|
|
|
|
M.W. de Boer (Marcel
Wilt) |
|
|
Netherlands |
|
|
Competence: Limited authorization |
|
|
Function: Proxy |
|
|
Starting date: 2009-05-01 |
|
|
Date of birth: 1971-12-30, Apeldoorn, NL |
Payments
|
Score |
7,7 |
|
Description |
Payments made under regular condition |
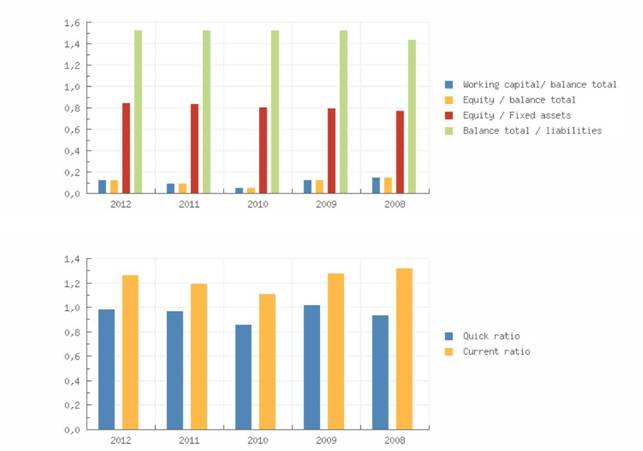
Key figures
|
Year |
2012 |
2011 |
2010 |
2009 |
2008 |
|
Quick ratio |
0,99 |
0,97 |
0,86 |
1,02 |
0,94 |
|
Current ratio |
1,27 |
1,20 |
1,11 |
1,28 |
1,32 |
|
|
|||||
|
Working capital/ balance
total |
0,13 |
0,10 |
0,06 |
0,13 |
0,15 |
|
Equity / balance total |
0,34 |
0,34 |
0,34 |
0,34 |
0,30 |
|
Equity / Fixed assets |
0,85 |
0,84 |
0,81 |
0,80 |
0,78 |
|
Equity / liabilities |
0,53 |
0,52 |
0,52 |
0,53 |
0,43 |
|
Balance total / liabilities |
1,53 |
1,53 |
1,53 |
1,53 |
1,44 |
|
|
|||||
|
Working capital |
359.100.100 |
254.000.000 |
137.700.000 |
267.800.000 |
324.600.000 |
|
Equity |
972.000.000 |
874.500.000 |
809.400.000 |
730.200.000 |
655.000.000 |
|
Mutation equity |
11,15 |
8,04 |
10,85 |
11,48 |
1,80 |
|
Year |
2012 |
2011 |
2010 |
2009 |
2008 |
|
Mutation short term
liabilities |
5,10 |
2,04 |
30,36 |
-7,99 |
17,63 |
|
|
|||||
|
Return on total assets (ROA) |
7,52 |
7,01 |
6,57 |
6,33 |
6,54 |
|
Return on equity (ROE) |
21,79 |
20,43 |
19,19 |
18,43 |
21,83 |
|
Gross profit margin |
4,49 |
4,15 |
3,82 |
3,65 |
3,48 |
|
Net profit margin |
3,40 |
2,78 |
2,29 |
2,06 |
2,32 |
|
|
|||||
|
Average collection ratio |
3,98 |
3,77 |
4,03 |
4,80 |
4,84 |
|
Average payment ratio |
5,02 |
4,58 |
6,00 |
6,23 |
6,73 |
|
Equity turnover ratio |
5,38 |
5,40 |
6,10 |
6,18 |
7,55 |
|
Total assets turnover ratio |
1,86 |
1,85 |
2,09 |
2,12 |
2,26 |
|
Fixed assets turnover ratio |
4,57 |
4,52 |
4,94 |
4,92 |
5,88 |
|
Inventory conversion ratio |
14,13 |
15,91 |
15,99 |
17,97 |
12,86 |
|
|
|||||
|
Turnover |
5.229.100.000 |
4.721.100.000 |
4.939.700.000 |
4.511.700.000 |
4.943.100.000 |
|
Operating result |
234.600.000 |
196.100.000 |
188.900.000 |
164.800.000 |
172.100.000 |
|
Net result after taxes |
177.600.000 |
131.201.000 |
113.001.000 |
93.001.000 |
114.800.000 |
|
|
|||||
|
Cashflow |
|
|
|
|
176.200.000 |
|
Gross profit |
5.239.200.000 |
|
4.946.900.000 |
4.516.000.000 |
966.700.000 |
|
EBIT |
234.600.000 |
196.100.000 |
188.900.000 |
164.800.000 |
172.100.000 |
|
EBITDA |
|
|
|
|
233.500.000 |
|
Summary |
The 2012 financial result structure is a postive working captial of 359.100.000
euro, which is in agreement with 13 % of the total assets of the company. |
|
|
|
The working capital has increased with 41.38 % compared to previous
year. The ratio, with respect to the total assets of the company has however,
increased. |
|
|
|
The improvement between 2011 and 2012 has mainly been caused by an
increase of the current assets. |
|
|
|
The current ratio of the company in 2012 was 1.27. When the current
ratio is below 1.5, the company may have problems meeting its short-term
obligations. |
|
|
|
The quick ratio in 2012 of the company was 0.99. A company with a
Quick Ratio of less than |
|
|
|
1 cannot currently pay back its current liabilities. |
|
|
|
|
|
|
|
The 2011 financial result structure is a positive working capital of 254.000.000
euro, which is in agreement with 10 % of the total assets of the company. |
|
|
|
The working capital has increased with 84.46 % compared to previous
year. The ratio, with respect to the total assets of the company has however,
increased. |
|
|
|
The improvement between 2010 and 2011 has mainly been caused by an
increase of the current assets. |
|
|
|
The current ratio of the company in 2011 was 1.2. When the current
ratio is below 1.5, the company may have problems meeting its short-term
obligations. |
|
|
|
The quick ratio in 2011 of the company was 0.97. A company with a
Quick Ratio of less than |
|
|
|
1 cannot currently pay back its current liabilities. |
|
Financial statement
|
Type of annual
account |
Consolidated |
|
Annual account |
Nutreco N.V. |
|
|
Veerstraat 38 |
|
|
5831JN Boxmeer |
|
|
Netherlands |
|
|
Registration number: 160743050000 |
Balance
|
Year |
2012 |
2011 |
2010 |
2009 |
2008 |
|
|
End date |
2012-12-31 |
2011-12-31 |
2010-12-31 |
2009-12-31 |
2008-12-31 |
|
|
Goodwill |
|
|
|
|
176.000.000 |
|
|
Intangible fixed assets |
408.100.000 |
360.500.000 |
347.300.000 |
310.400.000 |
286.200.000 |
|
|
Real estate |
|
|
|
|
213.300.000 |
|
|
Plant and machinery |
|
|
|
|
208.700.000 |
|
|
Other tangible fixed assets |
|
|
|
|
45.000.000 |
|
|
Tangible fixed assets |
639.600.000 |
583.300.000 |
564.600.000 |
517.100.000 |
478.100.000 |
|
|
Associated and affliated
companies |
|
|
|
|
14.400.000 |
|
|
Other financial fixed assets |
|
|
|
|
62.300.000 |
|
|
Financial fixed assets |
96.200.000 |
100.600.000 |
88.100.000 |
89.500.000 |
76.700.000 |
|
|
Fixed assets |
1.143.900.000 |
1.044.400.000 |
1.000.000.000 |
917.000.000 |
841.000.000 |
|
|
|
||||||
|
Inventories |
370.100.000 |
296.800.000 |
309.000.000 |
251.000.000 |
384.300.000 |
|
|
Year |
2012 |
2011 |
2010 |
2009 |
2008 |
|
End date |
2012-12-31 |
2011-12-31 |
2010-12-31 |
2009-12-31 |
2008-12-31 |
|
Accounts receivable |
357.400.000 |
742.000.000 |
601.400.000 |
540.800.000 |
601.700.000 |
|
Other receivables |
683.400.000 |
289.400.000 |
222.500.000 |
183.900.000 |
132.500.000 |
|
Total receivables |
1.040.800.000 |
1.031.400.000 |
823.900.000 |
724.700.000 |
734.200.000 |
|
Liquid funds |
263.000.000 |
176.800.000 |
230.800.000 |
232.600.000 |
228.300.000 |
|
accruals |
|
|
|
|
132.500.000 |
|
Current assets |
1.673.900.000 |
1.505.000.000 |
1.363.700.000 |
1.208.300.000 |
1.346.800.000 |
|
Total assets |
2.817.800.000 |
2.549.400.000 |
2.363.700.000 |
2.125.300.000 |
2.187.800.000 |
|
|
|||||
|
Minority interests |
9.100.000 |
8.700.000 |
10.200.000 |
10.500.000 |
10.500.000 |
|
Total equity |
972.000.000 |
874.500.000 |
809.400.000 |
730.200.000 |
655.000.000 |
|
Provisions |
|
33.200.000 |
26.000.000 |
19.000.000 |
12.200.000 |
|
Long term interest yielding
debt |
521.900.000 |
382.000.000 |
292.100.000 |
425.100.000 |
412.500.000 |
|
Financial debts |
|
|
|
|
301.300.000 |
|
Tax liabilities |
|
|
|
|
11.900.000 |
|
Other long term liabilities |
|
|
|
|
9.000.000 |
|
Long term liabilities |
521.900.000 |
382.000.000 |
292.100.000 |
425.100.000 |
487.900.000 |
|
Accounts payable |
1.204.600.000 |
1.044.800.000 |
678.800.000 |
546.900.000 |
625.400.000 |
|
Liabilities towards credit
institutes |
|
|
|
|
96.300.000 |
|
Short term interest yielding
debt |
|
|
|
|
96.300.000 |
|
Tax liabilities |
|
|
|
|
27.500.000 |
|
Other short term liabilities |
110.200.000 |
206.200.000 |
547.200.000 |
393.600.000 |
273.000.000 |
|
Short term liabilities |
1.314.800.000 |
1.251.000.000 |
1.226.000.000 |
940.500.000 |
1.022.200.000 |
|
Total short and long term liabilities |
1.836.700.000 |
1.666.200.000 |
1.544.100.000 |
1.384.600.000 |
1.522.300.000 |
|
Total liabilities |
2.817.800.000 |
2.549.400.000 |
2.363.700.000 |
2.125.300.000 |
2.187.800.000 |
|
Summary |
The total assets of the company increased
with 10.53 % between 2011 and 2012. |
|
|
The fixed asset growth of 9.53 % is lower
than the total asset growth. |
|
|
|
|
|
The asset growth has mainly been financed
by a Net Worth increase of 11.15 %. Debt, however, grew with 10.23 %. |
|
|
|
|
|
In 2012 the assets of the company were 40.6
% composed of fixed assets and 59.4 % by current assets. The assets are being
financed by an equity of 34.49 %, and total debt of 65.51 %. |
|
|
|
|
|
The total assets of the company increased
with 7.86 % between 2010 and 2011. |
|
|
The fixed asset growth of 4.44 % is lower
than the total asset growth. |
|
|
The asset growth has mainly been financed
by a Net Worth increase of 8.04 %. Debt, however, grew with 7.91 %. |
|
|
|
|
|
In 2011 the assets of the company were 40.97
% composed of fixed assets and 59.03 % by current assets. The assets are
being financed by an equity of 34.3 %, and total debt of 65.7%. |

Profit and loss
|
Year |
2012 |
2011 |
2010 |
2009 |
2008 |
|
Revenues |
5.248.100.000 |
4.724.500.000 |
4.979.200.000 |
4.552.400.000 |
4.980.100.000 |
|
Other operating income |
8.900.000 |
3.400.000 |
32.300.000 |
36.400.000 |
29.900.000 |
|
Net turnover |
5.229.100.000 |
4.721.100.000 |
4.939.700.000 |
4.511.700.000 |
4.943.100.000 |
|
|
|||||
|
Wages and salaries |
|
|
|
|
427.500.000 |
|
Amorization and depreciation |
|
|
|
|
61.400.000 |
|
other operating costs |
|
|
|
|
335.600.000 |
|
Raw materials and
consumables |
|
|
|
|
3.983.500.000 |
|
Operating expenses |
5.013.500.000 |
4.528.400.000 |
4.790.300.000 |
4.387.600.000 |
4.808.000.000 |
|
Result in subsidiaries |
3.200.000 |
6.600.000 |
2.200.000 |
1.400.000 |
2.100.000 |
|
Operating result |
234.600.000 |
196.100.000 |
188.900.000 |
164.800.000 |
172.100.000 |
|
|
|||||
|
Financial income |
6.300.000 |
11.200.000 |
7.500.000 |
6.700.000 |
6.900.000 |
|
Financial expenses |
32.300.000 |
35.200.000 |
43.300.000 |
38.300.000 |
38.100.000 |
|
Financial result |
-26.000.000 |
-24.000.000 |
-35.800.000 |
-31.600.000 |
-31.200.000 |
|
Result on ordinary operations before taxes |
211.800.000 |
178.700.000 |
155.300.000 |
134.600.000 |
143.000.000 |
|
|
|||||
|
Taxation on the result of
ordinary activities |
54.100.000 |
45.499.000 |
39.099.000 |
34.699.000 |
37.200.000 |
|
Result of ordinary activities after taxes |
157.700.000 |
133.201.000 |
116.201.000 |
99.901.000 |
105.800.000 |
|
|
|||||
|
Extraordinary income |
20.500.000 |
7.100.000 |
1.000.000 |
2.200.000 |
|
|
Extraordinary expense |
600.000 |
9.100.000 |
4.200.000 |
9.100.000 |
|
|
Year |
2012 |
2011 |
2010 |
2009 |
2008 |
|
Extraordinary result after taxation |
19.900.000 |
-2.000.000 |
-3.200.000 |
-6.900.000 |
11.100.000 |
|
|
|
|
|
|
|
|
Net result |
177.600.000 |
131.201.000 |
113.001.000 |
93.001.000 |
114.800.000 |
|
|
|
|
|
|
|
|
Attributable to third parties |
|
|
|
|
2.100.000 |
|
Summary |
The turnover of the company grew with 10.76 % between 2011 and 2012. |
||
|
|
The operating result of the company grew with 19.63 % between 2011 and
2012. This evolution implies an increase of the company's economic
profitability. |
||
|
|
The result of these changes is an increase of the company's Economic
Profitability of 7.28 % of the analysed period, being equal to 2011 % in the
year 2012. |
||
|
|
Despite the growth the asset turnover remained the same at 1.86. |
||
|
|
The Net Result of the company decreased by 35.36 % between 2011 and
2012. |
||
|
|
The company's Financial Profitability has been negatively affected by
the financial activities in comparison to the EBITs behaviour. The result of
these variations is a profitability reduction of 6.66 % of the analysed
period, being 21.79 % in the year 2012. |
||
|
|
The company's financial structure has slowed down its financial
profitability. |
||
|
|
|
|
|
|
|
The turnover of the company decreased by -4.43 % between 2010 and
2011. |
||
|
|
The operating result of the company grew with 3.81 % between 2010 and
2011. This evolution implies an increase of the company's economic
profitability. |
||
|
|
The result of these changes is an increase of the company's Economic Profitability
of 6.7 % of the analysed period, being equal to 2010 % in the year 2011. |
||
|
|
Despite the growth the assets turnover decreased, whose index evolved
with -11.48 % to a level of 1.85. |
||
|
|
The Net Result of the company decreased by 16.11 % between 2010 and
2011. |
||
|
|
|
|
|
|
|
The company's Financial Profitability has been negatively affected by
the financial activities in comparison to the EBITs behavior. The result of these
variations is a profitability reduction of 6.46 % of the analysed period,
being 20.43 % in the year 2011. |
||
|
|
The company's financial structure has slowed down its financial
profitability. |
||

Analysis
|
Branch (SBI) |
Manufacture of food products (10) |
|
Region |
Veluwe |
|
|
|
|
|
In the Netherlands 5941 of the companies
are registered with the SBI code 10 |
|
|
In the region Veluwe 288 of the companies
are registered with the SBI code 10 |
|
|
In the Netherlands 126 of the bankrupcties
are published within this sector |
|
|
In the region Veluwe 3 of the bankruptcies
are published within this sector |
|
|
The risk of this specific sector in the
Netherlands is normal |
|
|
The risk of this specific sector in the
region Veluwe is normal |
Publications
|
Consent
statements |
24- 04-2013: Voor boekjaar 2012 is een instemmingsverklaring
gedeponeerd. |
|
|
12-04-2012: Voor boekjaar 2011 is een instemmingsverklaring gedeponeerd. |
|
|
15-04-2011: Voor boekjaar 2010 is een instemmingsverklaring
gedeponeerd. |
|
|
12-04-2010: Voor boekjaar 2009 is een instemmingsverklaring
gedeponeerd. |
|
|
|
|
|
|
|
Functions |
07-02-2014: Per 01-01-2014 is bestuurder Willem Frederik Kernkamp in
functie getreden. |
|
|
07-02-2014: Per 01-01-2014 is bestuurder 16058721 Nutreco Nederland
B.V. uit functie getreden. |
|
|
07-02-2014: Per 01-01-2014 is gevolmachtigde Otto-Jan Alphons Seijler
uit functie getreden. |
|
|
25- 07-2011: Per 01-07-2011 is bestuurder Harm de Wildt in functie
getreden. |
|
|
25-07-2011: Per 01-07-2011 is bestuurder Frank Jurjen Tielens uit
functie getreden. |
Company
structure
|
Relations |
21 |
|
|
|
|
Nutreco N.V. |
|
|
Veerstraat 38 |
|
|
5831JN Boxmeer |
|
|
Netherlands |
|
|
Registration number: 160743050000 |
|
|
|
|
|
• Nutreco
Nederland B.V. |
|
|
Veerstraat 38 |
|
|
5831JN Boxmeer |
|
|
Netherlands |
|
|
Registration number: 160587210000 |
|
|
|
|
|
• Trouw
Nutrition Nederland B.V. |
|
|
Nijverheidsweg 2 |
|
|
3881LA Putten |
|
|
Netherlands |
|
|
Registration number: 080139190000 |
|
FOREIGN EXCHANGE RATES
|
Currency |
Unit
|
Indian Rupees |
|
US Dollar |
1 |
Rs. 62.27 |
|
|
1 |
Rs. 103.66 |
|
Euro |
1 |
Rs. 85.17 |
INFORMATION DETAILS
|
Report Prepared
by : |
DPT |
RATING EXPLANATIONS
|
RATING |
STATUS |
PROPOSED CREDIT LINE |
|
|
>86 |
Aaa |
Possesses an extremely sound financial base with the strongest
capability for timely payment of interest and principal sums |
Unlimited |
|
71-85 |
Aa |
Possesses adequate working capital. No caution needed for credit transaction.
It has above average (strong) capability for payment of interest and
principal sums |
Large |
|
56-70 |
A |
Financial & operational base are regarded healthy. General unfavourable
factors will not cause fatal effect. Satisfactory capability for payment of
interest and principal sums |
Fairly Large |
|
41-55 |
Ba |
Overall operation is considered normal. Capable to meet normal
commitments. |
Satisfactory |
|
26-40 |
B |
Capability to overcome financial difficulties seems comparatively
below average. |
Small |
|
11-25 |
Ca |
Adverse factors are apparent. Repayment of interest and principal sums
in default or expected to be in default upon maturity |
Limited with full
security |
|
<10 |
C |
Absolute credit risk exists. Caution needed to be exercised |
Credit not
recommended |
|
-- |
NB |
New Business |
-- |
This score serves as a reference to assess SC’s credit risk and
to set the amount of credit to be extended. It is calculated from a composite
of weighted scores obtained from each of the major sections of this report. The
assessed factors and their relative weights (as indicated through %) are as
follows:
Financial
condition (40%) Ownership
background (20%) Payment
record (10%)
Credit history
(10%) Market trend
(10%) Operational
size (10%)
This report is issued at your request without any
risk and responsibility on the part of MIRA INFORM PRIVATE LIMITED (MIPL)
or its officials.