MIRA INFORM REPORT
|
Report Date : |
19.02.2014 |
IDENTIFICATION DETAILS
|
Name : |
ABBRA CORPORATION LTD. |
|
|
|
|
Registered Office : |
12
Soi Prachanukul 3 [Soi 2], Ratchadapisek Road,
Wongsawang, Bangsue, Bangkok
10800, |
|
|
|
|
Country : |
Thailand |
|
|
|
|
Financials (as on) : |
31.12.2012 |
|
|
|
|
Date of Incorporation : |
11.09.1986 |
|
|
|
|
Com. Reg. No.: |
0105529032108 |
|
|
|
|
Legal Form : |
Private Limited Company |
|
|
|
|
Line of Business : |
Importer and distributor various
kinds of food
chemicals and food
ingredients |
|
|
|
|
No. of Employees : |
100 |
RATING & COMMENTS
|
MIRA’s Rating : |
B |
|
RATING |
STATUS |
PROPOSED CREDIT LINE |
|
|
26-40 |
B |
Capability to overcome financial difficulties seems comparatively
below average. |
Small |
|
Status : |
Moderate |
|
Payment Behaviour : |
Slow but correct |
|
Litigation : |
Clear |
NOTES :
Any query related to this report can be made
on e-mail : infodept@mirainform.com
while quoting report number, name and date.
ECGC Country Risk Classification List – September 30, 2013
|
Country Name |
Previous Rating (30.06.2013) |
Current Rating (30.09.2013) |
|
Thailand |
B1 |
B1 |
|
Risk Category |
ECGC
Classification |
|
Insignificant |
A1 |
|
Low |
A2 |
|
Moderate |
B1 |
|
High |
B2 |
|
Very High |
C1 |
|
Restricted |
C2 |
|
Off-credit |
D |
THAILAND - ECONOMIC OVERVIEW
With a well-developed infrastructure, a free-enterprise economy, generally pro-investment policies, and strong export industries, Thailand achieved steady growth due largely to industrial and agriculture exports - mostly electronics, agricultural commodities, automobiles and parts, and processed foods. Thailand is trying to maintain growth by encouraging domestic consumption and public investment to offset weak exports in 2012. Unemployment, at less than 1% of the labor force, stands as one of the lowest levels in the world, which puts upward pressure on wages in some industries. Thailand also attracts nearly 2.5 million migrant workers from neighboring countries. The Thai government is implementing a nation-wide 300 baht ($10) per day minimum wage policy and deploying new tax reforms designed to lower rates on middle-income earners. The Thai economy has weathered internal and external economic shocks in recent years. The global economic crisis severely cut Thailand's exports, with most sectors experiencing double-digit drops. In 2009, the economy contracted 2.3%. However, in 2010, Thailand's economy expanded 7.8%, its fastest pace since 1995, as exports rebounded. In late 2011 growth was interrupted by historic flooding in the industrial areas in Bangkok and its five surrounding provinces, crippling the manufacturing sector. Industry recovered from the second quarter of 2012 onward with GDP growth at 5.5% in 2012. The government has approved flood mitigation projects worth $11.7 billion, which were started in 2012, to prevent similar economic damage, and an additional $75 billion for infrastructure over the next seven years with a plan to start in 2013
|
Source
: CIA |
Company name and address
ABBRA CORPORATION
LTD.
SUMMARY
BUSINESS
ADDRESS : 12
SOI PRACHANUKUL 3
[SOI 2],
RATCHADAPISEK ROAD,
WONGSAWANG,
BANGSUE, BANGKOK
10800, THAILAND
TELEPHONE : [66] 2912-1919,
FAX :
[66] 2912-1298,
2912-1511
E-MAIL
ADDRESS : info@abbracorp.com
REGISTRATION
ADDRESS : SAME
AS BUSINESS ADDRESS
ESTABLISHED
: 1986
REGISTRATION
NO. : 0105529032108 [Former : 3210/2529]
TAX
ID NO. : 3101439465
CAPITAL REGISTERED : BHT. 5,000,000
CAPITAL PAID-UP : BHT.
5,000,000
SHAREHOLDER’S PROPORTION : THAI :
100%
FISCAL YEAR CLOSING DATE : DECEMBER 31
LEGAL
STATUS : PRIVATE LIMITED
COMPANY
EXECUTIVE : MR.
EKDANAI VACHARASATHIEN, THAI
PRESIDENT
NO.
OF STAFF : 100
LINES
OF BUSINESS : FOOD
CHEMICALS
IMPORTER &
DISTRIBUTOR
CORPORATE PROFILE
OPERATING
TREND : STABLE
PRESENT
SITUATION : OPERATING NORMALLY
REPUTATION : GOOD
WITH NORMAL BUSINESS
ENGAGEMENT
MANAGEMENT STANDARD : MANAGEMENT WITH
FAIR PERFORMANCE
HISTORY
The subject was
established on September
11, 1986 as
a private limited
company under the
name style ABBRA
CORPORATION LTD., by
Thai group, Vacharasathien family,
in order to
import and distribute food
chemicals to local
market. It currently
employs approximately 100
staff.
The subject’s registered
address was initially
at 12 Soi
Prachanukul 3 [Soi
2], Ratchadapisek Rd.,
Bangsue, Bangkok 10800.
In 2009, the
subject’s registered address
was changed to
12 Soi Prachanukul
3 [Soi 2],
Ratchadapisek Rd., Wongsawang,
Bangsue, Bangkok 10800,
by the Bangsue
District Office, and
this is the
subject’s current operation
address.
THE BOARD OF
DIRECTOR
|
Name |
|
Nationality |
Age |
|
|
|
|
|
|
Mrs. Tassinee Vacharasathien |
|
Thai |
54 |
|
Mr. Ekdanai Vacharasathien |
|
Thai |
48 |
AUTHORIZED PERSON
One of the
above directors signs
on behalf of
the subject with
company’s affixed.
MANAGEMENT
Mr. Ekdanai Vacharasathien is
the President.
He is Thai
nationality with the
age of 48
years old.
Mrs. Tassinee Vacharasathien is
the Managing Director.
She is Thai nationality with
the age of 54 years
old.
Ms. Mayura Vacharasathien is
the Deputy Managing
Director [Operations].
She is Thai
nationality.
Ms. Suntaree Wetchaphukpithak is
the Deputy Managing
Director [Supports].
She is Thai
nationality.
Mrs. Walaikul Pattanamuk is
the Senior Sales
and Marketing Manager.
She is Thai
nationality.
BUSINESS OPERATIONS
The subject’s activities
are importer and
distributor various kinds
of food chemicals
and food ingredients
as the followings:
Essential oil : Concentrated Lime
Oil, Herb and Spice
Natural Food Colors: Caramel Color
Liquid and Caramel
Color Powder, Oleoresin
Extract, Paprika, Protein,
Smoke Flavor, Spice
Powder & Spice
Blend Powder,
Spray Dried Powder,
Starch, Synthetic Colors,
Whole
Grain and etc.
PURCHASE
90% of the
products is imported from United Kingdom, United States
of America, Japan,
India, Spain, Australia
and France, and
the remaining 10%
is purchased from
local suppliers and
agents.
MAJOR SUPPLIERS
Sethness Products Company : United
States of America
Lionel Hitchen [Essential
Oils] Ltd. : United
Kingdom
Juan Navarro Garcia
S.A. : Spain
Nakamura Chaho Corporation : Japan
The Solac Company : United
States of America
Akay Flavours &
Aromatics Pvt. Ltd. : India
Neotech Food Co.,
Ltd. :
Thailand
SALES [LOCAL]
100% of the
products is sold locally by
wholesale to manufacturers
and dealers.
LITIGATION
Bankruptcy and Receivership
There are no
litigation on bankruptcy
and receivership cases
filed against the
subject found at
Legal Execution Department
for the past
five years.
Others
There are no
legal suits filed
against the subject
for the past
two years.
SUBSIDIARY AND AFFILIATED
COMPANY
The subject is
not found to
have any subsidiary or
affiliated company here
in Thailand.
LITIGATION
Bankruptcy and Receivership
There are no
litigation on bankruptcy
and receivership cases
filed against the
subject found at
Legal Execution Department
for the past
five years.
Others
There are no
legal suits filed
against the subject
according to IRICO’S
DATABASE for the
past two years.
CREDIT
Sales are by
cash or on
the credits term
of 30-60 days.
Local bills are
paid by cash
or on the
credits term of
30-60 days.
Imports are by
L/C at sight
or T/T.
BANKING
The Siam Commercial
Bank Public Co., Ltd.
[Bangkhen Branch : Phaholyothin Rd.,
Bangkhen, Bangkok 10900]
Bangkok Bank Public
Co., Ltd.
[Soi Aree
Branch : Phaholyothin Rd., Samsannai,
Phyathai, Bangkok 10400]
EMPLOYMENT
The subject employs approximately
100 staff. [office,
sales staff and
warehouse workers]
LOCATION DETAILS
The premise is
owned for administrative office
in a 3
storey building of
1 unit townhouse at
the heading address.
Premise is located
in commercial/residential area.
Warehouses:
-
339 Moo 4, T.
Rahaeng, A. Ladlumkaew, Pathumthani
12140.
-
333 Moo 4, T.
Rahaeng, A. Ladlumkaew, Pathumthani
12140.
COMMENT
The subject has a
solid business with
strong sales revenue. Its
products have been
widely used in
foods, beverages industries, as well as
household consumer products.
Its business is
promising and growth
is continued steadily.
FINANCIAL INFORMATION
The capital was
initially registered at
Bht. 200,000 divided
into 2,000 shares
of Bht. 100
each.
The capital was
increased later as
follows:
Bht. 1,000,000
on December 6,
1995
Bht. 5,000,000
on August 9,
2007
The latest registered
capital was increased
to Bht. 5,000,000
divided into 50,000
shares of Bht.
100 each with
fully paid.
THE SHAREHOLDERS LISTED
WERE : [as
of April 30,
2013]
|
NAME |
HOLDING |
% |
|
|
|
|
|
Mrs. Tassinee Vacharasathien Nationality: Thai Address : 200/34 Soi
Prachanukul, Bangsue, Bangkok 10800 |
44,000 |
88.00 |
|
Mr. Ekdanai Vacharasathien Nationality: Thai Address : 73/4 Soi
1 Rimklongprapa, Bangsue, Bangkok 10800 |
5,800 |
11.60 |
|
Ms. Mayura Vacharasathien Nationality: Thai Address : 102/75 Songprapa
Rd., Seekan,
Donmuang, Bangkok 10210 |
200 |
0.40 |
Total Shareholders : 3
Share Structure [as
at April 30,
2013]
|
|
Shareholders |
No. of Share |
% Shares |
|
|
|
|
|
|
Thai |
3 |
50,000 |
100.00 |
|
Foreign |
- |
- |
- |
|
Total |
3 |
50,000 |
100.00 |
NAME OF AUDITOR
& CERTIFIED PUBLIC
ACCOUNTANT NO. :
Mr. Pongthep
Lertpinij-amornkul No. 4632
BALANCE SHEET [BAHT]
The latest financial figures published
as at December
31, 2012, 2011
& 2010 were:
ASSETS
|
Current Assets |
2012 |
2011 |
2010 |
|
|
|
|
|
|
Cash and Cash
Equivalent |
4,067,480.07 |
1,648,838.01 |
2,369,522.41 |
|
Trade Accounts & Other
Receivable |
150,541,784.29 |
114,093,431.61 |
98,206,960.07 |
|
Inventories |
100,255,637.96 |
87,899,958.32 |
60,451,111.90 |
|
Other Current Assets
|
4,982,135.36 |
4,531,189.92 |
9,193,883.64 |
|
|
|
|
|
|
Total Current Assets
|
259,847,037.68 |
208,173,417.86 |
170,221,478.02 |
|
Long-term Lending to Related Company |
4,500,000.00 |
4,500,000.00 |
4,500,000.00 |
|
Building and Equipment, net
|
107,194,593.66 |
91,975,447.77 |
67,256,646.54 |
|
Other Current Assets |
204,367.93 |
- |
- |
|
Total Assets |
371,745,999.27 |
304,648,865.63 |
241,978,124.56 |
LIABILITIES &
SHAREHOLDERS' EQUITY [BAHT]
|
Current
Liabilities |
2012 |
2011 |
2010 |
|
|
|
|
|
|
Bank Overdraft from
Financial Institution |
37,896,199.22 |
29,002,944.08 |
23,004,235.75 |
|
Short-term Loan from
Financial Institution |
47,464,630.77 |
2,500,000.00 |
2,500,000.00 |
|
Trade Accounts & Other Payable |
137,568,968.60 |
128,440,852.66 |
37,247,140.48 |
|
Current Portion of
Assets Payable under Hire- purchase Contract |
3,014,295.01 |
2,442,230.10 |
2,712,488.14 |
|
Current Portion of Long-term Liabilities |
8,365,613.08 |
5,469,594.74 |
- |
|
Accrued Income Tax |
232,214.19 |
892,153.73 |
3,995,995.69 |
|
Other Current Liabilities |
1,752,655.97 |
1,861,868.63 |
55,151,699.35 |
|
|
|
|
|
|
Total Current Liabilities |
236,294,576.84 |
170,609,643.94 |
124,611,559.41 |
|
Long-term Loan from
Director |
75,369,763.38 |
74,395,462.50 |
57,614,108.50 |
|
Other Long-term Loan |
16,459,766.44 |
16,232,600.94 |
14,724,603.94 |
|
Assets Payable under
Hire-purchase Contract -
Net of Current
Portion |
3,475,491.53 |
1,876,540.14 |
3,036,427.35 |
|
Employee Benefits Obligation |
5,696,271.49 |
- |
- |
|
Total Liabilities |
337,295,869.68 |
263,114,247.52 |
199,986,699.20 |
|
|
|
|
|
|
Shareholders' Equity |
|
|
|
|
|
|
|
|
|
Share capital : Baht 100
par value authorized, issued
and fully paid share
capital 50,000 shares |
5,000,000.00 |
5,000,000.00 |
5,000,000.00 |
|
|
|
|
|
|
Capital Paid |
5,000,000.00 |
5,000,000.00 |
5,000,000.00 |
|
Retained Earning - Unappropriated |
29,450,129.59 |
36,534,618.11 |
36,991,425.36 |
|
Total Shareholders' Equity |
34,450,129.59 |
41,534,618.44 |
41,991,425.36 |
|
Total Liabilities & Shareholders' Equity |
371,745,999.27 |
304,648,865.63 |
241,978,124.56 |
PROFIT &
LOSS ACCOUNT
|
Revenue |
2012 |
2011 |
2010 |
|
|
|
|
|
|
Sales |
523,996,738.03 |
432,796,302.94 |
420,734,942.38 |
|
Other Income |
6,895,633.93 |
2,813,401.08 |
4,359,913.50 |
|
Total Revenues |
530,892,371.96 |
435,609,704.02 |
425,094,855.88 |
|
Expenses |
|
|
|
|
|
|
|
|
|
Change in Finished Goods and Work in
Process |
[33,139,201.76] |
[201,509.70] |
5,225,726.97 |
|
Purchase Goods |
365,805,411.99 |
264,821,799.04 |
260,068,641.46 |
|
Material Supplies |
480,113.68 |
321,730.49 |
145,386.21 |
|
Employees Benefit Expenses |
51,604,739.49 |
38,749,145.66 |
29,560,895.52 |
|
Depreciation and Amortization |
13,930,976.88 |
10,335,580.68 |
9,357,177.02 |
|
Other Expenses |
133,237,037.49 |
117,737,443.52 |
106,156,175.84 |
|
Total Expenses |
531,919,077.77 |
431,764,189.69 |
410,514,003.02 |
|
|
|
|
|
|
Profit / [Loss] before Financial Cost & Income Tax |
[1,026,705.81] |
3,845,514.33 |
14,580,852.86 |
|
Financial Cost |
[5,358,494.62] |
[2,070,492.99] |
[869,977.06] |
|
Income Tax |
[699,288.09] |
[2,231,828.59] |
[5,073,724.85] |
|
|
|
|
|
|
Net Profit / [Loss] |
[7,084,488.52] |
[456,807.25] |
8,637,150.95 |
FINANCIAL ANALYSIS
|
ITEM |
UNIT |
2012 |
2011 |
2010 |
|
|
|
|
|
|
|
LIQUIDITY RATIO |
|
|
|
|
|
CURRENT RATIO |
TIMES |
1.10 |
1.22 |
1.37 |
|
QUICK RATIO |
TIMES |
0.65 |
0.68 |
0.81 |
|
|
|
|
|
|
|
ACTIVITY RATIO |
|
|
|
|
|
FIXED ASSETS TURNOVER |
TIMES |
4.89 |
4.71 |
6.26 |
|
TOTAL ASSETS TURNOVER |
TIMES |
1.41 |
1.42 |
1.74 |
|
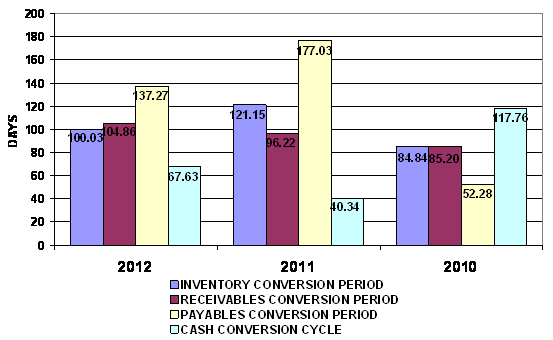
INVENTORY CONVERSION PERIOD |
DAYS |
100.03 |
121.15 |
84.84 |
|
INVENTORY TURNOVER |
TIMES |
3.65 |
3.01 |
4.30 |
|
RECEIVABLES CONVERSION PERIOD |
DAYS |
104.86 |
96.22 |
85.20 |
|
RECEIVABLES TURNOVER |
TIMES |
3.48 |
3.79 |
4.28 |
|
PAYABLES CONVERSION PERIOD |
DAYS |
137.27 |
177.03 |
52.28 |
|
CASH CONVERSION CYCLE |
DAYS |
67.63 |
40.34 |
117.76 |
|
|
|
|
|
|
|
PROFITABILITY
RATIO |
|
|
|
|
|
COST OF GOODS SOLD |
% |
69.81 |
61.19 |
61.81 |
|
SELLING & ADMINISTRATION |
% |
12.60 |
11.42 |
9.28 |
|
INTEREST |
% |
1.02 |
0.48 |
0.21 |
|
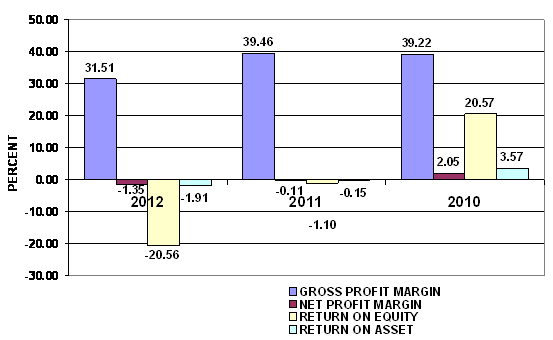
GROSS PROFIT MARGIN |
% |
31.51 |
39.46 |
39.22 |
|
NET PROFIT MARGIN BEFORE EX. ITEM |
% |
(0.20) |
0.89 |
3.47 |
|
NET PROFIT MARGIN |
% |
(1.35) |
(0.11) |
2.05 |
|
RETURN ON EQUITY |
% |
(20.56) |
(1.10) |
20.57 |
|
RETURN ON ASSET |
% |
(1.91) |
(0.15) |
3.57 |
|
EARNING PER SHARE |
BAHT |
(141.69) |
(9.14) |
172.74 |
|
|
|
|
|
|
|
LEVERAGE RATIO |
|
|
|
|
|
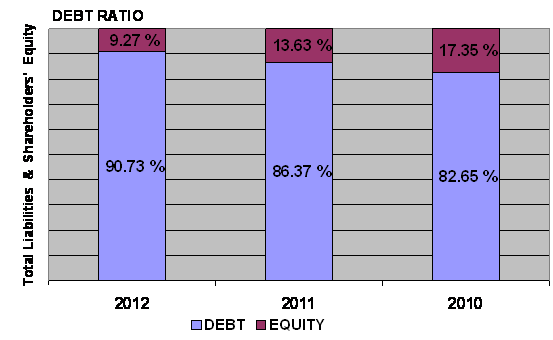
DEBT RATIO |
TIMES |
0.91 |
0.86 |
0.83 |
|
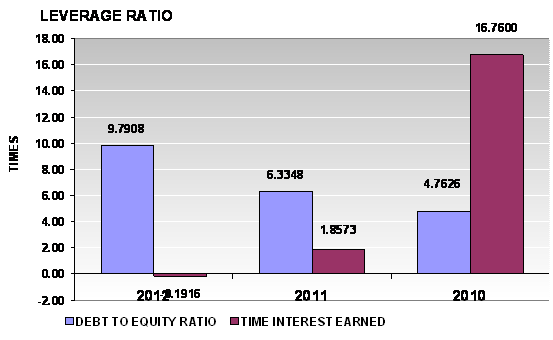
DEBT TO EQUITY RATIO |
TIMES |
9.79 |
6.33 |
4.76 |
|
TIME INTEREST EARNED |
TIMES |
(0.19) |
1.86 |
16.76 |
|
|
|
|
|
|
|
ANNUAL GROWTH |
|
|
|
|
|
SALES GROWTH |
% |
21.07 |
2.87 |
|
|
OPERATING PROFIT |
% |
(126.70) |
(73.63) |
|
|
NET PROFIT |
% |
(1,450.87) |
(105.29) |
|
|
FIXED ASSETS |
% |
16.55 |
36.75 |
|
|
TOTAL ASSETS |
% |
22.02 |
25.90 |
|
ANNUAL GROWTH :
SATISFACTORY
An annual sales growth is 21.07%. Turnover has increased from THB
PROFITABILITY :
RISKY
PROFITABILITY
RATIO
|
Gross Profit Margin |
31.51 |
Deteriorated |
Industrial
Average |
126.26 |
|
Net Profit Margin |
(1.35) |
Deteriorated |
Industrial
Average |
3.69 |
|
Return on Assets |
(1.91) |
Deteriorated |
Industrial
Average |
7.39 |
|
Return on Equity |
(20.56) |
Deteriorated |
Industrial
Average |
19.55 |
Gross Profit Margin used to assess a firm's financial health by revealing
the proportion of money left over from revenues after accounting for the cost
of goods sold. Gross profit margin serves as the source for paying additional
expenses and future savings. The company's figure is 31.51%. When compared with
the industry average, the ratio of the company was lower. This indicated that
company may have problems with control over its costs.
Net Profit Margin is the indicator of the company's efficiency in that
net profit takes into consideration all expenses of the company. A low profit
margin indicates a low margin of safety, higher risk that a decline in sales
will erase profits and result in a net loss. The company's figure is -1.35%.
When compared with the industry average, the ratio of the company was lower.
Return on Assets measures how efficiently profits are being generated
from the assets employed in the business when compared with the ratios of firms
in a similar business. A low ratio in comparison with industry averages
indicates an inefficient use of business assets. When compared with the
industry average, it was lower, the
company's figure is -1.91%.
Return on Equity indicates how profitable a company is by comparing its
net income to its average shareholders' equity, ROE measures how much the
shareholders earned for their investment in the company. When compared with the
industry average, it was lower, the company's figure is -20.56%.
Trend of the
average competitors in the same industry for last 5 years
Return on Assets Uptrend
Return on Equity Uptrend
LIQUIDITY : RISKY
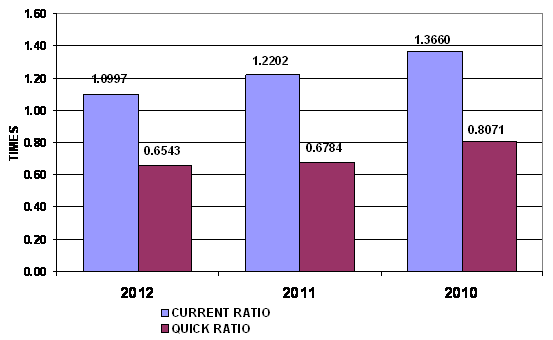
LIQUIDITY RATIO
|
Current Ratio |
1.10 |
Acceptable |
Industrial
Average |
1.52 |
|
Quick Ratio |
0.65 |
|
|
|
|
Cash Conversion Cycle |
67.63 |
|
|
|
The Current Ratio is to ascertain whether a company's short-term assets
are readily available to pay off its short-term liabilities. The company's
figure is 1.1 times in 2012, decreased from 1.22 times, then it is generally
considered to have good short-term financial strength. When compared with the
industry average, the ratio of the company was lower.
The Quick Ratio is a liquidity indicator that further refines the
current ratio by measuring the amount of the most liquid current assets there
are to cover current liabilities. The company's figure is 0.65 times in 2012,
decreased from 0.68 times, then the company has not enough current assets that
presumably can be quickly converted to cash for pay financial obligations.
The Cash Conversion Cycle measures the number of days a company's cash
is tied up in the production and sales process of its operations and the
benefit from payment terms from its creditors. It meant the company could
survive when no cash inflow was received from sale for 68 days.
Trend of the
average competitors in the same industry for last 5 years
Current Ratio Uptrend
LEVERAGE : RISKY
LEVERAGE RATIO
|
Debt Ratio |
0.91 |
Acceptable |
Industrial
Average |
0.61 |
|
Debt to Equity Ratio |
9.79 |
Risky |
Industrial
Average |
1.59 |
|
Times Interest Earned |
(0.19) |
Risky |
Industrial
Average |
- |
Debt to Equity Ratio a measurement of how much suppliers, lenders,
creditors and obligors have committed to the company versus what the
shareholders have committed. A lower the percentage means that the company is
using less leverage and has a stronger equity position.
Times Interest Earned measuring a company's ability to meet its debt
obligations. Ratio is -0.2 lower than 1, so the company is not generating
enough cash from EBIT to meet its interest obligations.
Debt Ratio shows the proportion of a company's assets which are financed
through debt. The company's figure is 0.91 greater than 0.5, most of the
company's assets are financed through debt.
Trend of the
average competitors in the same industry for last 5 years
Debt Ratio Uptrend
Times Interest Earned Stable
ACTIVITY :
IMPRESSIVE
ACTIVITY RATIO
|
Fixed Assets Turnover |
4.89 |
Impressive |
Industrial
Average |
- |
|
Total Assets Turnover |
1.41 |
Acceptable |
Industrial
Average |
2.00 |
|
Inventory Conversion Period |
100.03 |
|
|
|
|
Inventory Turnover |
3.65 |
Satisfactory |
Industrial
Average |
4.69 |
|
Receivables Conversion Period |
104.86 |
|
|
|
|
Receivables Turnover |
3.48 |
Impressive |
Industrial
Average |
2.92 |
|
Payables Conversion Period |
137.27 |
|
|
|
The company's Account Receivable Ratio is calculated as 3.48 and
Inventory Turnover in Days Ratio indicates the liquidity of inventory.
It estimates the number of days that it will take to sell the current
inventory. Inventory is particularly sensitive to change in business
activities. The inventory turnover in days has decreased from 121 days at the
end of 2011 to 100 days at the end of 2012. This represents a positive trend.
And Inventory turnover has increased from 3.01 times in year 2011 to 3.65 times
in year 2012.
The company's Total Asset Turnover is calculated as 1.41 times and 1.42
times in 2012 and 2011 respectively. This ratio is determined by dividing total
assets into total sales turnover. The ratio measures the activity of the assets
and the ability of the firm to generate sales through the use of the assets.
Trend of the
average competitors in the same industry for last 5 years
Fixed Assets Turnover Stable
Total Assets Turnover Uptrend
Inventory Turnover Uptrend
Receivables Turnover Uptrend
FOREIGN EXCHANGE RATES
|
Currency |
Unit
|
Indian Rupees |
|
US Dollar |
1 |
Rs.62.12 |
|
|
1 |
Rs.103.93 |
|
Euro |
1 |
Rs.85.17 |
INFORMATION DETAILS
|
Report Prepared
by : |
NIS |
RATING EXPLANATIONS
|
RATING |
STATUS |
PROPOSED CREDIT LINE |
|
|
>86 |
Aaa |
Possesses an extremely sound financial base with the strongest
capability for timely payment of interest and principal sums |
Unlimited |
|
71-85 |
Aa |
Possesses adequate working capital. No caution needed for credit transaction.
It has above average (strong) capability for payment of interest and
principal sums |
Large |
|
56-70 |
A |
Financial & operational base are regarded healthy. General
unfavourable factors will not cause fatal effect. Satisfactory capability for
payment of interest and principal sums |
Fairly Large |
|
41-55 |
Ba |
Overall operation is considered normal. Capable to meet normal
commitments. |
Satisfactory |
|
26-40 |
B |
Capability to overcome
financial difficulties seems comparatively below average. |
Small |
|
11-25 |
Ca |
Adverse factors are apparent. Repayment of interest and principal sums
in default or expected to be in default upon maturity |
Limited with
full security |
|
<10 |
C |
Absolute credit risk exists. Caution needed to be exercised |
Credit not
recommended |
|
-- |
NB |
New Business |
-- |
This score serves as a reference to assess
SC’s credit risk and to set the amount of credit to be extended. It is
calculated from a composite of weighted scores obtained from each of the major
sections of this report. The assessed factors and their relative weights (as
indicated through %) are as follows:
Financial
condition (40%) Ownership
background (20%) Payment
record (10%)
Credit history
(10%) Market trend (10%) Operational size
(10%)
This report is issued at your request without any
risk and responsibility on the part of MIRA INFORM PRIVATE LIMITED (MIPL)
or its officials.