MIRA
INFORM REPORT
|
Report Date : |
21.02.2014 |
IDENTIFICATION DETAILS
|
Name : |
AMER-SIL SA |
|
|
|
|
Registered Office : |
61, Rue d'olm 8281 Kehlen |
|
|
|
|
Country : |
|
|
|
|
|
Financials (as on) : |
31.12.2012 |
|
|
|
|
Date of Incorporation : |
13.02.1970 |
|
|
|
|
Legal Form : |
Limited company by shares |
|
|
|
|
Line of Business : |
Manufacture of batteries and accumulators |
|
|
|
|
No. of Employees : |
103 |
RATING & COMMENTS
|
MIRA’s Rating : |
B |
|
RATING |
STATUS |
PROPOSED CREDIT LINE |
|
|
26-40 |
B |
Capability to overcome financial difficulties seems comparatively
below average. |
Small |
|
Status : |
Moderate |
|
Payment Behaviour : |
Slow but correct |
|
Litigation : |
Clear |
NOTES :
Any query related to this report can be made
on e-mail : infodept@mirainform.com
while quoting report number, name and date.
ECGC Country Risk Classification List – September 30, 2013
|
Country Name |
Previous Rating (30.06.2013) |
Current Rating (30.09.2013) |
|
Luxembourg |
A2 |
A2 |
|
Risk Category |
ECGC
Classification |
|
Insignificant |
A1 |
|
Low |
A2 |
|
Moderate |
B1 |
|
High |
B2 |
|
Very High |
C1 |
|
Restricted |
C2 |
|
Off-credit |
D |
LUXEMBOURG - ECONOMIC
OVERVIEW
This small, stable, high-income economy - benefiting from its proximity to France, Belgium, and Germany - has historically featured solid growth, low inflation, and low unemployment. The industrial sector, initially dominated by steel, has become increasingly diversified to include chemicals, rubber, and other products. Growth in the financial sector, which now accounts for about 27% of GDP, has more than compensated for the decline in steel. Most banks are foreign-owned and have extensive foreign dealings, but Luxembourg has lost some of its advantages as a favorable tax location because of OECD and EU pressure. The economy depends on foreign and cross-border workers for about 40% of its labor force. Luxembourg, like all EU members, suffered from the global economic crisis that began in late 2008, but unemployment has trended below the EU average. Following strong expansion from 2004 to 2007, Luxembourg's economy contracted 3.6% in 2009, but rebounded in 2010-11 before slowing again in 2012. The country continues to enjoy an extraordinarily high standard of living - GDP per capita ranks among the highest in the world, and is the highest in the euro zone. Turmoil in the world financial markets and lower global demand during 2008-09 prompted the government to inject capital into the banking sector and implement stimulus measures to boost the economy. Government stimulus measures and support for the banking sector, however, led to a 5% government budget deficit in 2009. Nevertheless, the deficit was cut to 1.1% in 2011 and 0.9% in 2012. Even during the financial crisis and recovery, Luxembourg retained the highest current account surplus as a share of GDP in the euro zone, owing largely to their strength in financial services. Public debt remains among the lowest of the region although it has more than doubled since 2007 as percentage of GDP. Luxembourg's economy, while stabile, grew slowly in 2012 due to ongoing weak growth in the euro area. Authorities have strengthened supervision of domestic banks because of their exposure to the activities of foreign banks
|
Source
: CIA |
Company name and address
|
Company name |
AMER-SIL SA |
|
Operative address |
61, Rue d'olm |
|
Risk |
Average risk |
|
Status |
Active |
|
Legal form |
Limited company by shares |
||||
|
Registration number |
Trade register number:
B 8.871 (Luxembourg) |
||||
|
VAT-number |
LU11389362 |
||||
|
Year |
2012 |
Mutation |
2011 |
Mutation |
2010 |
|
Fixed assets |
3.467.300 |
-2,31 |
3.549.295 |
86,89 |
1.899.112 |
|
Total receivables |
2.460.196 |
-10,12 |
2.737.090 |
49,24 |
1.833.992 |
|
|
|||||
|
Total equity |
7.095.875 |
-1,90 |
7.233.475 |
4,65 |
6.912.299 |
|
Short term liabilities |
3.175.698 |
9,18 |
2.908.695 |
32,89 |
2.188.816 |
|
|
|||||
|
Net result |
-137.600 |
-147,30 |
290.898 |
-59,43 |
717.074 |
|
|
|||||
|
Working capital |
4.246.243 |
-4,96 |
4.467.661 |
-15,83 |
5.308.071 |
|
Quick ratio |
1,44 |
-12,73 |
1,65 |
-38,20 |
2,67 |
Contact information
|
Company name |
Amer-Sil SA |
|
Operative address |
61, Rue d'olm |
|
Correspondence address |
61, Rue d'olm |
|
Telephone number |
+352 309282 |
|
Fax number |
+352 308375 |
Registration
|
Registration number |
Trade register number:
B 8.871 (Luxembourg) |
|
VAT-number |
LU11389362 |
|
Status |
Active |
|
Establishment date |
1970-02-13 |
|
Legal form |
Limited company by shares |
Activities
|
NACE |
Manufacture of batteries and accumulators (2720) |
Relations
|
Shareholders |
ULTIMATE GLOBAL
SHAREHOLDER |
|
Structure |
SUBSIDIARIES |
Management
|
Management |
Fullname: Mrs Dana R.
Barlow |
Employees
|
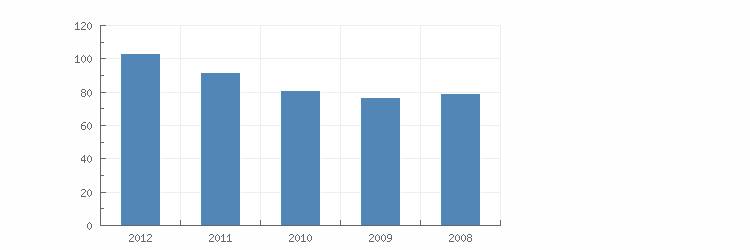
Year |
2012 |
2011 |
2010 |
2009 |
2008 |
|
Total |
103 |
92 |
81 |
77 |
79 |
Financial analysis
|
Trend |
Fluctuating |
|
Profitability |
Negative |
|
Solvability |
More than sufficient |
|
Liquidity |
Positive |
|
Show amount in |
Euro |
Key figures
|
Year |
2012 |
2011 |
2010 |
2009 |
2008 |
|
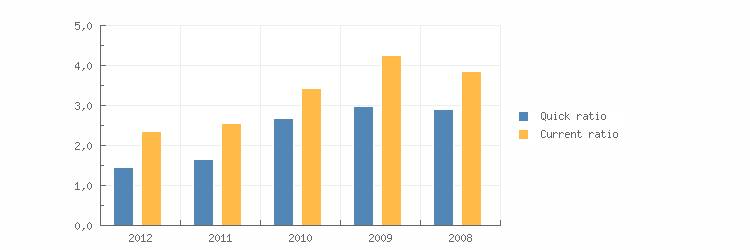
Quick ratio |
1,44 |
1,65 |
2,67 |
2,97 |
2,89 |
|
Current ratio |
2,34 |
2,54 |
3,43 |
4,24 |
3,86 |
|
|
|||||
|
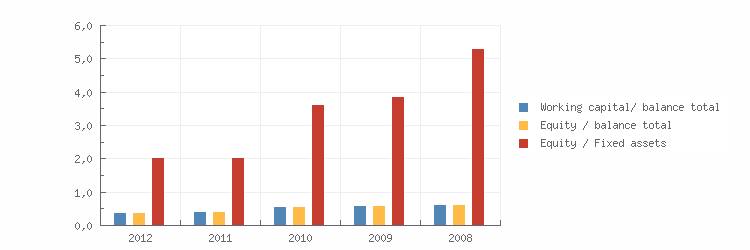
Working capital/ balance total |
0,39 |
0,41 |
0,56 |
0,61 |
0,63 |
|
Equity / balance total |
0,65 |
0,66 |
0,74 |
0,81 |
0,78 |
|
Equity / Fixed assets |
2,05 |
2,04 |
3,64 |
3,87 |
5,30 |
|
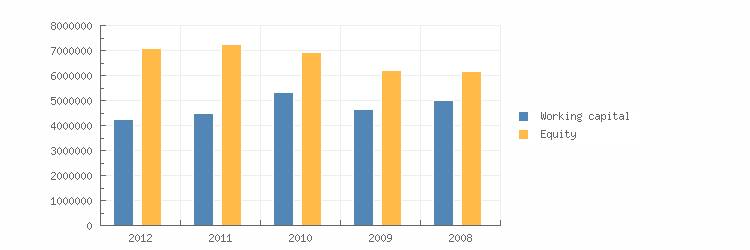
Working capital |
4.246.243 |
4.467.661 |
5.308.071 |
4.646.261 |
5.014.758 |
|
Equity |
7.095.875 |
7.233.475 |
6.912.299 |
6.195.226 |
6.155.962 |
|
Mutation equity |
-1,90 |
4,65 |
11,57 |
0,64 |
|
|
Mutation short term liabilities |
9,18 |
32,89 |
52,79 |
-18,38 |
|
|
|
|||||
|
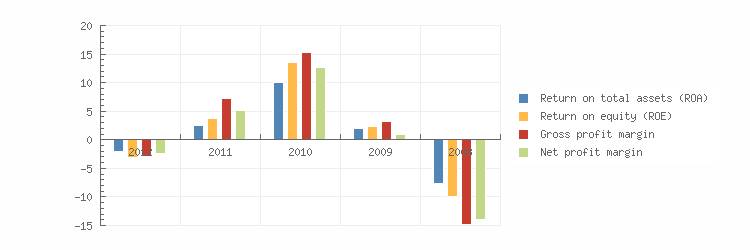
Return on total assets (ROA) |
-2,01 |
2,50 |
10,01 |
1,89 |
-7,68 |
|
Return on equity (ROE) |
-3,08 |
3,78 |
13,61 |
2,34 |
-9,90 |
|
Gross profit margin |
-2,94 |
7,16 |
15,30 |
3,17 |
-14,84 |
|
Net profit margin |
-2,39 |
5,15 |
12,65 |
0,92 |
-13,87 |
|
|
|||||
|
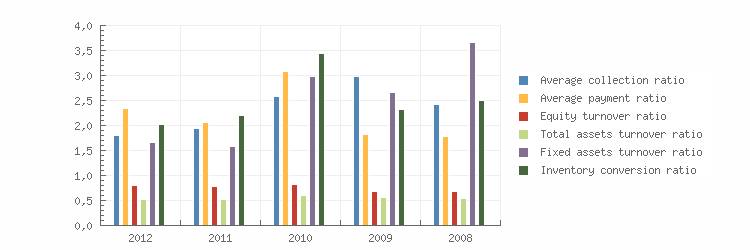
Average collection ratio |
1,81 |
1,94 |
2,59 |
2,98 |
2,42 |
|
Average payment ratio |
2,34 |
2,06 |
3,09 |
1,82 |
1,78 |
|
Equity turnover ratio |
0,81 |
0,78 |
0,82 |
0,69 |
0,69 |
|
Total assets turnover ratio |
0,53 |
0,52 |
0,60 |
0,56 |
0,54 |
|
Fixed assets turnover ratio |
1,66 |
1,59 |
2,99 |
2,67 |
3,66 |
|
Inventory conversion ratio |
2,02 |
2,20 |
3,44 |
2,33 |
2,50 |
|
|
|||||
|
Turnover |
5.761.121 |
5.651.547 |
5.669.230 |
4.273.367 |
4.249.465 |
|
Operating result |
-169.376 |
404.662 |
867.503 |
135.412 |
-630.738 |
|
Net result after taxes |
-137.600 |
290.898 |
717.074 |
39.263 |
-589.207 |
|
|
|||||
|
Cashflow |
109.602 |
531.561 |
985.326 |
556.454 |
217.643 |
|
Gross profit |
5.788.530 |
5.788.222 |
5.546.257 |
4.322.322 |
4.143.021 |
|
EBITDA |
77.826 |
645.325 |
1.135.755 |
652.603 |
176.112 |
|
Summary |
The 2012 financial
result structure is a postive working captial of 4.246.243 euro, which is in agreement
with 39 % of the total assets of the company. |
||||
Financial statement
|
Last annual account |
2012 |
|
Remark annual account |
The company is obliged to file its financial statements. |
|
Type of annual account |
Corporate |
|
Annual account |
Amer-Sil SA |
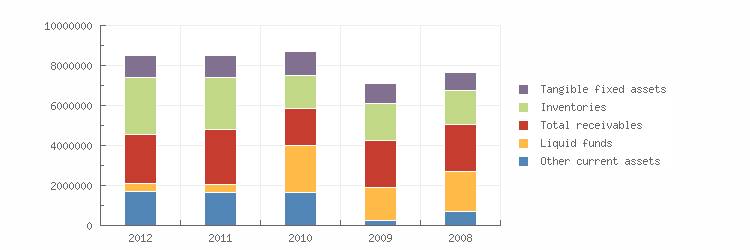
Balance
|
Year |
2012 |
2011 |
2010 |
2009 |
2008 |
|
End date |
2012-12-31 |
2011-12-31 |
2010-12-31 |
2009-12-31 |
2008-12-31 |
|
Tangible fixed assets |
1.065.931 |
1.147.940 |
1.185.357 |
1.016.335 |
892.156 |
|
Other fixed assets |
2.401.370 |
2.401.355 |
713.755 |
584.028 |
269.047 |
|
Fixed assets |
3.467.300 |
3.549.295 |
1.899.112 |
1.600.362 |
1.161.203 |
|
|
|||||
|
Inventories |
2.852.982 |
2.569.371 |
1.646.054 |
1.830.629 |
1.697.335 |
|
Total receivables |
2.460.196 |
2.737.090 |
1.833.992 |
2.347.069 |
2.386.975 |
|
Liquid funds |
385.688 |
417.182 |
2.350.613 |
1.631.504 |
1.995.034 |
|
Other current assets |
1.723.074 |
1.652.714 |
1.666.229 |
269.645 |
690.515 |
|
Current assets |
7.421.941 |
7.376.356 |
7.496.887 |
6.078.847 |
6.769.859 |
|
Total assets |
10.889.242 |
10.925.651 |
9.395.999 |
7.679.209 |
7.931.062 |
|
|
|||||
|
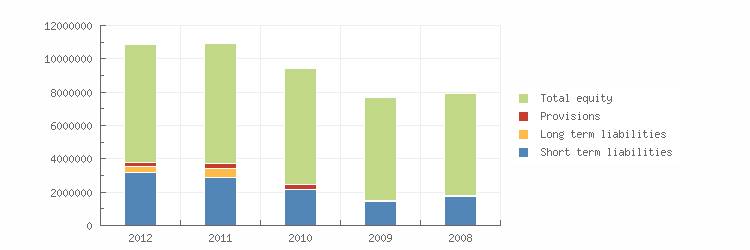
Total equity |
7.095.875 |
7.233.475 |
6.912.299 |
6.195.226 |
6.155.962 |
|
Provisions |
230.173 |
256.378 |
294.884 |
51.396 |
20.000 |
|
Long term liabilities |
387.496 |
527.102 |
|
|
|
|
Accounts payable |
1.053.061 |
1.521.880 |
1.075.984 |
687.323 |
638.171 |
|
Liabilities towards credit institutes |
1.082.522 |
552.996 |
|
89 |
302.659 |
|
Other short term liabilities |
1.040.115 |
833.819 |
1.112.832 |
745.174 |
814.271 |
|
Short term liabilities |
3.175.698 |
2.908.695 |
2.188.816 |
1.432.586 |
1.755.101 |
|
Total liabilities |
10.889.242 |
10.925.651 |
9.395.999 |
7.679.209 |
7.931.062 |
|
Summary |
The total assets
remained the same between 2011 and 2012. |
||||
Profit and loss
|
Year |
2012 |
2011 |
2010 |
2009 |
2008 |
|
Net turnover |
5.761.121 |
5.651.547 |
5.669.230 |
4.273.367 |
4.249.465 |
|
|
|||||
|
Wages and salaries |
5.648.010 |
4.996.569 |
4.232.485 |
3.610.764 |
3.821.448 |
|
Amorization and depreciation |
247.202 |
240.663 |
268.252 |
517.191 |
806.850 |
|
Operating result |
-169.376 |
404.662 |
867.503 |
135.412 |
-630.738 |
|
|
|||||
|
Financial income |
27.284 |
42.140 |
107.169 |
30.226 |
71.641 |
|
Financial expenses |
76.688 |
173.191 |
34.161 |
20.365 |
50.285 |
|
Financial result |
-49.404 |
-131.051 |
73.008 |
9.861 |
21.357 |
|
Result on ordinary operations before taxes |
-218.780 |
273.611 |
940.511 |
145.274 |
-609.382 |
|
|
|||||
|
Taxation on the result of ordinary activities |
-45.770 |
86.901 |
294.285 |
134.739 |
53.645 |
|
Result of ordinary activities after taxes |
-173.010 |
186.710 |
646.226 |
10.535 |
-663.027 |
|
|
|||||
|
Extraordinary income |
150.000 |
104.187 |
70.848 |
28.729 |
73.819 |
|
Extraordinary expense |
114.590 |
|
|
|
|
|
Extraordinary result before taxation |
35.410 |
104.187 |
70.848 |
28.729 |
73.819 |
|
Net result |
-137.600 |
290.898 |
717.074 |
39.263 |
-589.207 |
|
Summary |
The turnover of the
company grew with 1.94 % between 2011 and 2012. |
||||
Publications
|
Remarks |
Status: Active |
FOREIGN EXCHANGE RATES
|
Currency |
Unit
|
Indian Rupees |
|
US Dollar |
1 |
Rs.62.28 |
|
|
1 |
Rs.103.84 |
|
Euro |
1 |
Rs.85.70 |
INFORMATION DETAILS
|
Report Prepared
by : |
NIS |
RATING EXPLANATIONS
|
RATING |
STATUS |
PROPOSED CREDIT LINE |
|
|
>86 |
Aaa |
Possesses an extremely sound financial base with the strongest capability
for timely payment of interest and principal sums |
Unlimited |
|
71-85 |
Aa |
Possesses adequate working capital. No caution needed for credit
transaction. It has above average (strong) capability for payment of interest
and principal sums |
Large |
|
56-70 |
A |
Financial & operational base are regarded healthy. General
unfavourable factors will not cause fatal effect. Satisfactory capability for
payment of interest and principal sums |
Fairly Large |
|
41-55 |
Ba |
Overall operation is considered normal. Capable to meet normal
commitments. |
Satisfactory |
|
26-40 |
B |
Capability to
overcome financial difficulties seems comparatively below average. |
Small |
|
11-25 |
Ca |
Adverse factors are apparent. Repayment of interest and principal sums
in default or expected to be in default upon maturity |
Limited with
full security |
|
<10 |
C |
Absolute credit risk exists. Caution needed to be exercised |
Credit not
recommended |
|
-- |
NB |
New Business |
-- |
This score serves as a reference to assess SC’s credit risk
and to set the amount of credit to be extended. It is calculated from a
composite of weighted scores obtained from each of the major sections of this
report. The assessed factors and their relative weights (as indicated through
%) are as follows:
Financial
condition (40%) Ownership
background (20%) Payment
record (10%)
Credit history
(10%) Market trend
(10%) Operational
size (10%)
This report is issued at your request without any
risk and responsibility on the part of MIRA INFORM PRIVATE LIMITED (MIPL)
or its officials.