MIRA INFORM REPORT
|
Report Date : |
21.02.2014 |
IDENTIFICATION DETAILS
|
Name : |
TEXTIL SANTANDERINA SA |
|
|
|
|
Registered Office : |
Cta Santander-Oviedo Km 43 Cabezon De La Sal Cantabria |
|
|
|
|
Country : |
Spain |
|
|
|
|
Financials (as on) : |
31.12.2012 |
|
|
|
|
Date of Incorporation : |
05.12.1960 |
|
|
|
|
Legal Form : |
Public Company |
|
|
|
|
Line of Business : |
Subject is engaged in manufacturing of all kind of textiles and fabrics |
|
|
|
|
No. of Employees : |
330 |
RATING & COMMENTS
|
MIRA’s Rating : |
Ba |
|
RATING |
STATUS |
PROPOSED CREDIT LINE |
|
|
41-55 |
Ba |
Overall operation is considered normal. Capable to meet normal
commitments. |
Satisfactory |
|
Status : |
Satisfactory |
|
Payment Behaviour : |
Slow but correct |
|
Litigation : |
Clear |
NOTES :
Any query related to this report can be made
on e-mail : infodept@mirainform.com
while quoting report number, name and date.
ECGC Country Risk Classification List – September 30, 2013
|
Country Name |
Previous Rating (30.06.2013) |
Current Rating (30.09.2013) |
|
Spain |
A2 |
A2 |
|
Risk Category |
ECGC
Classification |
|
Insignificant |
A1 |
|
Low |
A2 |
|
Moderate |
B1 |
|
High |
B2 |
|
Very High |
C1 |
|
Restricted |
C2 |
|
Off-credit |
D |
SPAIN - ECONOMIC OVERVIEW
After almost 15 years of above average GDP growth, the Spanish economy began to slow in late 2007 and entered into a recession in the second quarter of 2008. GDP contracted by 3.7% in 2009, ending a 16-year growth trend, and by another 0.3% in 2010; GDP expanded 0.4% in 2011, before contracting 1.4% in 2012. The economy has once again fallen into recession as deleveraging in the private sector, fiscal consolidation, and continued high unemployment weigh on domestic demand and investment, even as exports have shown signs of resiliency. The unemployment rate rose from a low of about 8% in 2007 to 26.0% in 2012. The economic downturn has also hurt Spain's public finances. The government budget deficit peaked at 11.2% of GDP in 2010 and the process to reduce this imbalance has been slow despite the central government's efforts to raise new tax revenue and cut spending. Spain reduced its budget deficit to 9.4% of GDP in 2011, and roughly 7.4% of GDP in 2012, above the 6.3% target negotiated between Spain and the EU. Although Spain''s large budget deficit and poor economic growth prospects remain a source of concern for foreign investors, the government''s ongoing efforts to cut spending and introduce flexibility into the labor markets are intended to assuage these concerns. The government is also taking steps to shore up the banking system, namely by using up to $130 billion in EU funds to recapitalize struggling banks exposed to the collapsed domestic construction and real estate sectors
|
Source
: CIA |
EXECUTIVE
SUMMARY
|
Name: |
TEXTIL SANTANDERINA SA |
|
NIF / Fiscal code: |
A39001219 |
|
Status: |
ACTIVE |
|
Incorporation Date: |
05/12/1960 |
|
Register Data |
Register Section 8 Sheet 3469 |
|
Last Publication in BORME: |
07/10/2013 [Board Meeting] |
|
Last Published Account Deposit: |
2012 |
|
Share Capital: |
6.484.800,40 |
|
|
|
|
Localization: |
CTA SANTANDER-OVIEDO KM 43 - CABEZON DE LA SAL - 39500 - CANTABRIA |
|
Telephone - Fax - Email - Website: |
Ph.:. 942700125 |
|
|
|
|
Activity: |
|
|
NACE: |
1320 - Weaving of textiles |
|
Registered Trademarks: |
|
|
Audited / Opinion: |
Si / |
|
Tenders and Awards: |
7 for a total cost of NaN |
|
Subsidies: |
19 for a total cost of 7927153.8 |
|
Quality Certificate: |
No |
Defaults,
Legal Claims and Insolvency Proceedings
|
Insolvency Proceedings, Bankruptcy and Suspension of Payments |
|
Unpublished |
--- |
--- |
|
Defaults on debt with Financial Institutions and Large Companies |
|
None |
--- |
--- |
|
Judicial Claims (Notices, Executive Proceedings, Attachments, Auctions, Bad Debt) |
|
None |
0 |
--- |
|
Proceedings heard by the Civil Court |
|
Unpublished |
0 |
--- |
|
Proceedings heard by the Labour Court |
|
Unpublished |
0 |
--- |
|
|
|
Partners: |
|
|
|
CONRADO PARES BOJ |
3.73 % |
|
|
CRISTINA SERRA ROQUE |
4.11 % |
|
|
JUAN ANGEL PARES BOJ |
6.9 % |
|
|
JUAN MARIA PARES SERRA |
21.41 % |
|
|
NURIA SERRA ROQUE |
3.72 % |
|
|
GESTION DE BIENES Y SERVICIOS SA |
15.49 % |
|
|
PILAR BOJ VILALTA |
5.1 % |
|
|
SILVIA BENET SERRA |
2.76 % |
|
|
Shares: |
8 |
|
|
Other Links: |
2 |
|
|
No. of Active Corporate Bodies: |
|
|
|
Ratios |
2012 |
2011 |
Change |
|
|
|
|
|
Guarantees: |
|
|
Properties Registered: |
Company NO, Administrator NO |
|
Financing / Guarantee Sources : |
Sources YES, Guarantees NO |
|
|
|
|
|
|
|
INVESTIGATION SUMMARY |
|
|
The subject was founded in 1960 and it is engaged in manufacturing of home textiles. |
|
Identification
|
Social Denomination: |
TEXTIL SANTANDERINA SA |
|
NIF / Fiscal code: |
A39001219 |
|
Corporate Status: |
ACTIVE |
|
Start of activity: |
1949 |
|
Registered Office: |
CTA SANTANDER-OVIEDO KM 43 |
|
Locality: |
CABEZON DE LA SAL |
|
Province: |
CANTABRIA |
|
Postal Code: |
39500 |
|
Telephone: |
942700125 |
|
Fax: |
942701711 |
|
Activity
|
|
|
NACE: |
1320 |
|
Additional Information: |
The subject is engaged in manufacturing of all kind of textiles and fabrics for home. |
|
Additional Address: |
Registered office, offices, factory, warehouse and other premises in a owned shed, are located in Cta Santander Oviedo Km 43 Cabezón de la Sal (Cantabria). |
|
Future Perspective: |
Consolidation |
|
Industry situation: |
Maturity |
Number
of Employees
|
|
|
|
|
|
|
Year |
No. of employees |
Established |
Incidentals |
|
|
|
2014 |
330 |
|
|
|
Chronological
Summary
|
|||
|
|
|
|
|
|
|
Year |
Act |
|
|
|
1990 |
Appointments/ Re-elections (3) |
|
|
|
1991 |
Accounts deposit (ejer. 1989, 1990) Appointments/ Re-elections (2) Cessations/ Resignations/ Reversals (1) |
|
|
|
1992 |
Accounts deposit (ejer. 1991) |
|
|
|
1993 |
Accounts deposit (ejer. 1992) Adaptation to Law (1) Appointments/ Re-elections (1) Cessations/ Resignations/ Reversals (1) Increase of Capital (1) Other Concepts/ Events (1) |
|
|
|
1994 |
Accounts deposit (ejer. 1993) Appointments/ Re-elections (1) |
|
|
|
1995 |
Accounts deposit (ejer. 1994) Increase of Capital (1) |
|
|
|
1996 |
Accounts deposit (ejer. 1995) Appointments/ Re-elections (3) Cessations/ Resignations/ Reversals (2) Dividends Payment (1) |
|
|
|
1997 |
Accounts deposit (ejer. 1996) Appointments/ Re-elections (1) Board Meeting (1) Cessations/ Resignations/ Reversals (1) Errata (1) |
|
|
|
1998 |
Accounts deposit (ejer. 1997) Board Meeting (1) |
|
|
|
1999 |
Board Meeting (1) |
|
|
|
2000 |
Accounts deposit (ejer. 1998) Appointments/ Re-elections (7) Board Meeting (1) |
|
|
|
2001 |
Accounts deposit (ejer. 1999) Appointments/ Re-elections (4) Board Meeting (1) Cessations/ Resignations/ Reversals (1) Other Concepts/ Events (2) |
|
|
|
2002 |
Accounts deposit (ejer. 2000, 2001) Appointments/ Re-elections (1) Board Meeting (1) Increase of Capital (1) |
|
|
|
2003 |
Accounts deposit (ejer. 2002) Appointments/ Re-elections (1) Board Meeting (1) |
|
|
|
2004 |
Accounts deposit (ejer. 2003) Appointments/ Re-elections (2) Board Meeting (1) Other Concepts/ Events (1) |
|
|
|
2005 |
Accounts deposit (ejer. 2004) Appointments/ Re-elections (3) Board Meeting (1) Cessations/ Resignations/ Reversals (1) Other Concepts/ Events (1) Statutory Modifications (1) |
|
|
|
2006 |
Accounts deposit (ejer. 2005) Appointments/ Re-elections (1) Board Meeting (1) |
|
|
|
2007 |
Accounts deposit (ejer. 2006) Appointments/ Re-elections (1) Board Meeting (1) |
|
|
|
2008 |
Accounts deposit (ejer. 2007) Appointments/ Re-elections (2) Cessations/ Resignations/ Reversals (2) Other Concepts/ Events (1) |
|
|
|
2009 |
Accounts deposit (ejer. 2008 consolidated, 2008) Appointments/ Re-elections (2) Change of Social Purpose (1) Other Concepts/ Events (1) |
|
|
|
2010 |
Accounts deposit (ejer. 2009 consolidated, 2009) Appointments/ Re-elections (1) Capital Reduction (1) Cessations/ Resignations/ Reversals (1) |
|
|
|
2011 |
Accounts deposit (ejer. 2010 consolidated, 2010) Appointments/ Re-elections (6) Cessations/ Resignations/ Reversals (1) |
|
|
|
2012 |
Accounts deposit (ejer. 2011 consolidated, 2011) Appointments/ Re-elections (3) Cessations/ Resignations/ Reversals (1) |
|
|
|
2013 |
Accounts deposit (ejer. 2012) Appointments/ Re-elections (6) Board Meeting (1) |
|
|
Breakdown of Owners' Equity |
|
|
Registered Capital: |
6.484.800,40 |
|
Paid up capital: |
6.484.800,40 |
|
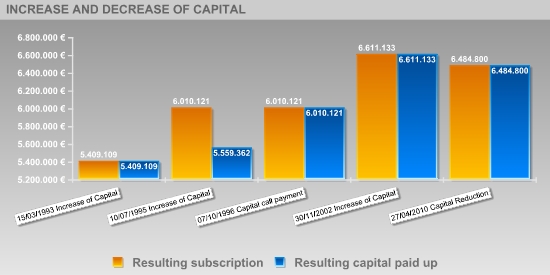
Updated Evolution of the Subscribed and Paid-in Capital |
|||||
|
|
|
|
|
|
|
|
|
|||||
|
|
|
|
|
|
|
|
Publishing Date |
Registration Type |
Capital Subscribed |
Paid up capital |
Underwritten result |
Disbursed Result |
|
15/03/1993 |
Increase of Capital |
1.803.036 |
1.803.036 |
5.409.109 |
5.409.109 |
|
10/07/1995 |
Increase of Capital |
601.012 |
150.253 |
6.010.121 |
5.559.362 |
|
07/10/1996 |
Capital call payment |
--- |
450.759 |
6.010.121 |
6.010.121 |
|
30/11/2002 |
Increase of Capital |
601.012 |
601.012 |
6.611.133 |
6.611.133 |
|
27/04/2010 |
Capital Reduction |
-126.333 |
-126.333 |
6.484.800 |
6.484.800 |
|
Post published |
Social Body's Name |
Appointment Date |
Other Positions in this Company |
|
PRESIDENT |
PARES BOJ JUAN ANGEL |
26/09/2011 |
15 |
|
MEMBER OF THE BOARD |
SERRA ROQUE CRISTINA |
26/09/2011 |
2 |
|
|
PARES SERRA JUAN MARIA |
26/09/2011 |
17 |
|
|
BOJ VILALTA PILAR |
26/09/2011 |
7 |
|
|
PARES BOJ JUAN ANGEL |
26/09/2011 |
15 |
|
|
PARES BOJ CONRADO |
26/09/2011 |
4 |
|
|
SERRA ROQUE NURIA |
26/09/2011 |
7 |
|
|
BENET SERRA SYLVIA |
26/09/2011 |
1 |
|
|
CRISTINA SERRA ROQUE |
26/08/2010 |
2 |
|
|
CONRADO PARES BOJ |
26/08/2010 |
3 |
|
JOINT CHIEF EXECUTIVE OFFICER |
PARES BOJ CONRADO |
22/10/2012 |
4 |
|
|
PARES BOJ JUAN ANGEL |
26/09/2011 |
15 |
|
COMBINED PROXY |
PARES BOJ ISAAC RAMON |
25/02/2013 |
1 |
|
|
FRANCISCO JAVIER MARTINEZ RODRIGUEZ |
25/02/2013 |
1 |
|
PROXY |
MARTINEZ RODRIGUEZ VICENTE |
29/04/2013 |
2 |
|
|
FERNANDEZ GONZALEZ MARTA |
29/04/2013 |
1 |
|
|
EMILIO LOREN BLASCO |
21/02/2000 |
1 |
|
|
MAUGERI SALVATORE |
11/11/1996 |
2 |
|
|
SERIO MARIO |
11/11/1996 |
2 |
|
|
SERIO ANTONIO |
11/11/1996 |
2 |
|
|
LOREN BUTRAGUEÑO JUAN |
09/05/1996 |
1 |
|
|
PRADA VAQUERIN FRANCISCO JAVIER |
24/12/1990 |
1 |
|
|
MARTINEZ RODRIGUEZ FRANCISCO JAVIER |
24/12/1990 |
1 |
|
|
PARES BOJ JUAN ANGEL |
24/12/1990 |
15 |
|
GENERAL MANAGER |
PARES BOJ JUAN ANGEL |
13/06/1994 |
15 |
|
SECRETARY |
CONRADO PARES BOJ |
26/08/2010 |
3 |
|
ACCOUNTS' AUDITOR / HOLDER |
AUDIBERIA OSORIO NAVARRIO Y CIA S R C |
08/02/2000 |
4 |
|
|
AUDIBERIA OSORIO NAVARRIO Y CIA SRC |
08/02/2000 |
2 |
|
|
AUDIBERIA SA |
30/04/1991 |
2 |
|
CONSOLIDATED ACCOUNTS' AUDITOR |
BDO AUDITORES SL |
18/07/2013 |
8 |
Historical
Social Bodies
|
Social Body's Name |
Post published |
End Date |
Other Positions in this Company |
|
AUDIBERIA AUDITORES SL |
ACCOUNTS' AUDITOR / HOLDER |
08/02/2000 |
2 |
|
|
ACCOUNTS' AUDITOR / HOLDER |
08/02/2000 |
|
|
AUDIBERIA OSORIO NAVARRIO Y CIA S R C |
ACCOUNTS' AUDITOR / HOLDER |
08/02/2000 |
4 |
|
|
ACCOUNTS' AUDITOR / HOLDER |
08/02/2000 |
|
|
|
ACCOUNTS' AUDITOR / HOLDER |
08/02/2000 |
|
|
AUDIBERIA OSORIO NAVARRIO Y CIA SRC |
ACCOUNTS' AUDITOR / HOLDER |
08/02/2000 |
2 |
|
AUDIBERIA SA |
ACCOUNTS' AUDITOR / HOLDER |
08/02/2000 |
2 |
|
BDO AUDIBERIA AUDITORES S L |
ACCOUNTS' AUDITOR / HOLDER |
30/07/2001 |
2 |
|
|
ACCOUNTS' AUDITOR / HOLDER |
15/10/2003 |
|
|
BDO AUDIBERIA AUDITORES SL |
CONSOLIDATED ACCOUNTS' AUDITOR |
27/01/2011 |
13 |
|
|
ACCOUNTS' AUDITOR / HOLDER |
28/03/2001 |
|
|
|
ACCOUNTS' AUDITOR / HOLDER |
30/07/2001 |
|
|
|
ACCOUNTS' AUDITOR / HOLDER |
17/07/2002 |
|
|
|
ACCOUNTS' AUDITOR / HOLDER |
15/10/2003 |
|
|
|
ACCOUNTS' AUDITOR / HOLDER |
27/07/2004 |
|
|
|
ACCOUNTS' AUDITOR / HOLDER |
05/08/2004 |
|
|
|
ACCOUNTS' AUDITOR / HOLDER |
03/11/2005 |
|
|
|
ACCOUNTS' AUDITOR / HOLDER |
24/07/2006 |
|
|
|
ACCOUNTS' AUDITOR / HOLDER |
18/09/2007 |
|
|
|
ACCOUNTS' AUDITOR / HOLDER |
21/07/2008 |
|
|
|
ACCOUNTS' AUDITOR / HOLDER |
01/12/2009 |
|
|
|
ACCOUNTS' AUDITOR / HOLDER |
01/12/2009 |
|
|
BDO AUDITORES SL |
ACCOUNTS' AUDITOR / HOLDER |
27/01/2011 |
8 |
|
|
CONSOLIDATED ACCOUNTS' AUDITOR |
26/07/2011 |
|
|
|
ACCOUNTS' AUDITOR / HOLDER |
26/07/2011 |
|
|
|
CONSOLIDATED ACCOUNTS' AUDITOR |
23/07/2012 |
|
|
|
ACCOUNTS' AUDITOR / HOLDER |
23/07/2012 |
|
|
|
CONSOLIDATED ACCOUNTS' AUDITOR |
18/07/2013 |
|
|
|
ACCOUNTS' AUDITOR / HOLDER |
18/07/2013 |
|
|
BENET CAMPS JORGE |
MEMBER OF THE BOARD |
10/03/1997 |
17 |
|
|
MEMBER OF THE BOARD |
19/12/2001 |
|
|
|
MEMBER OF THE BOARD |
22/02/2005 |
|
|
|
MEMBER OF THE BOARD |
26/08/2010 |
|
|
|
MEMBER OF THE BOARD |
26/09/2011 |
|
|
|
JOINT CHIEF EXECUTIVE OFFICER |
22/02/2005 |
|
|
|
JOINT CHIEF EXECUTIVE OFFICER |
26/08/2010 |
|
|
|
JOINT CHIEF EXECUTIVE OFFICER |
26/09/2011 |
|
|
|
CHIEF EXECUTIVE OFFICER |
15/03/1993 |
|
|
|
CHIEF EXECUTIVE OFFICER |
19/02/1996 |
|
|
|
CHIEF EXECUTIVE OFFICER |
19/12/2001 |
|
|
|
SECRETARY |
10/03/1997 |
|
|
|
PRESIDENT |
15/03/1993 |
|
|
|
PRESIDENT |
19/02/1996 |
|
|
|
SECRETARY |
22/02/2005 |
|
|
|
SECRETARY |
26/08/2010 |
|
|
|
SECRETARY |
19/12/2001 |
|
|
BOJ VILALTA PILAR |
MEMBER |
10/03/1997 |
7 |
|
|
MEMBER |
15/03/1993 |
|
|
|
MEMBER OF THE BOARD |
19/12/2001 |
|
|
|
MEMBER OF THE BOARD |
22/02/2005 |
|
|
|
MEMBER OF THE BOARD |
26/08/2010 |
|
|
|
MEMBER OF THE BOARD |
26/09/2011 |
|
|
CONRADO PARES BOJ |
MEMBER OF THE BOARD |
26/08/2010 |
3 |
|
CRISTINA SERRA ROQUE |
MEMBER OF THE BOARD |
26/08/2010 |
2 |
|
MARTINEZ RODRIGUEZ VICENTE |
PROXY |
29/04/2013 |
2 |
|
MAUGERI SALVATORE |
PROXY |
11/11/1996 |
2 |
|
PARES BOJ CONRADO |
MEMBER OF THE BOARD |
26/09/2011 |
4 |
|
|
SECRETARY |
26/09/2011 |
|
|
PARES BOJ JUAN ANGEL |
MEMBER |
15/03/1993 |
15 |
|
|
PRESIDENT |
26/09/2011 |
|
|
|
JOINT CHIEF EXECUTIVE OFFICER |
26/09/2011 |
|
|
|
MEMBER OF THE BOARD |
26/09/2011 |
|
|
|
MEMBER OF THE BOARD |
26/08/2010 |
|
|
|
JOINT CHIEF EXECUTIVE OFFICER |
26/08/2010 |
|
|
|
PRESIDENT |
26/08/2010 |
|
|
|
MEMBER OF THE BOARD |
22/02/2005 |
|
|
|
MEMBER OF THE BOARD |
19/12/2001 |
|
|
|
MEMBER |
10/03/1997 |
|
|
PARES SERRA JUAN MARIA |
MEMBER OF THE BOARD |
10/03/1997 |
17 |
|
|
MEMBER OF THE BOARD |
19/12/2001 |
|
|
|
MEMBER OF THE BOARD |
22/02/2005 |
|
|
|
MEMBER OF THE BOARD |
26/08/2010 |
|
|
|
MEMBER OF THE BOARD |
26/09/2011 |
|
|
|
JOINT CHIEF EXECUTIVE OFFICER |
22/02/2005 |
|
|
|
JOINT CHIEF EXECUTIVE OFFICER |
26/08/2010 |
|
|
|
JOINT CHIEF EXECUTIVE OFFICER |
26/09/2011 |
|
|
|
JOINT CHIEF EXECUTIVE OFFICER |
22/10/2012 |
|
|
|
CHIEF EXECUTIVE OFFICER |
10/03/1997 |
|
|
|
CHIEF EXECUTIVE OFFICER |
19/12/2001 |
|
|
|
SECRETARY |
19/02/1996 |
|
|
|
PRESIDENT |
10/03/1997 |
|
|
|
PRESIDENT |
19/12/2001 |
|
|
|
PRESIDENT |
22/02/2005 |
|
|
|
PRESIDENT |
13/06/2008 |
|
|
PARES SIERRA JUAN MARIA |
SECRETARY |
15/03/1993 |
3 |
|
|
CHIEF EXECUTIVE OFFICER |
15/03/1993 |
|
|
|
CHIEF EXECUTIVE OFFICER |
19/12/2001 |
|
|
RIERA COMELLA MANUEL |
VICE CHAIRMAN |
13/07/1991 |
1 |
|
ROQUE CASTELL ASUNCION |
MEMBER |
13/07/1991 |
1 |
|
ROQUE CASTELL DOLORES |
MEMBER |
15/03/1993 |
1 |
|
SALVIA CANUT EMILIO |
MEMBER |
19/02/1996 |
1 |
|
SERIO ANTONIO |
PROXY |
11/11/1996 |
2 |
|
SERIO MARIO |
PROXY |
11/11/1996 |
2 |
|
SERRA ROQUE CRISTINA |
MEMBER OF THE BOARD |
26/09/2011 |
2 |
|
SERRA ROQUE MARIA |
MEMBER |
15/03/1993 |
3 |
|
|
MEMBER |
10/03/1997 |
|
|
|
MEMBER OF THE BOARD |
19/12/2001 |
|
|
SERRA ROQUE NURIA |
MEMBER |
10/03/1997 |
7 |
|
|
MEMBER |
15/03/1993 |
|
|
|
MEMBER OF THE BOARD |
22/02/2005 |
|
|
|
MEMBER OF THE BOARD |
19/12/2001 |
|
|
|
MEMBER OF THE BOARD |
26/08/2010 |
|
|
|
MEMBER OF THE BOARD |
26/09/2011 |
|
|
SOLER ALONSO JOSE ANTONIO |
PROXY |
25/02/2008 |
1 |
Defaults,
Legal Claims and Insolvency Proceedings
|
|
|
|
|
Section enabling assessment of the degree of compliance of the company queried with its payment obligations. It provides information on the existence and nature of all stages of Insolvency and Legal Proceedings published with reference to the Company in the country's various Official Bulletins and national newspapers, as well Defaults Registered in the main national credit bureaus (ASNEF Industrial and RAI ).
Chronological
summary
|
|
|
Number of Publications |
Amount (_) |
Start date |
End date |
|
Insolvency Proceedings, Bankruptcy and Suspension of Payments |
|
Unpublished |
--- |
--- |
--- |
|
Request/Declaration |
|
0 |
--- |
date |
|
|
Proceedings |
|
--- |
--- |
|
--- |
|
Resolution |
|
--- |
--- |
|
--- |
|
Defaults on debt with Financial Institutions and Large Companies |
Bank and Commercial Delinquency |
None |
0 |
|
|
|
Status: Friendly |
|
--- |
|
|
|
|
Status: Pre-Litigation |
|
--- |
|
|
|
|
Status: Litigation |
|
--- |
|
|
|
|
Status: Non-performing |
|
--- |
|
|
|
|
Status: insolvency proceedings, bankruptcy and suspension of payments |
|
--- |
|
|
|
|
Other status |
|
--- |
|
|
|
|
Legal and Administrative Proceedings |
|
Unpublished |
--- |
|
|
|
Notices of defaults and enforcement |
|
--- |
--- |
|
--- |
|
Seizures |
|
--- |
--- |
|
--- |
|
Auctions |
|
--- |
--- |
|
--- |
|
Declarations of insolvency and bad debt |
|
--- |
--- |
|
--- |
|
Proceedings heard by the Civil Court |
|
Unpublished |
--- |
|
|
|
Proceedings heard by the Labour Court |
|
Unpublished |
--- |
|
|
> Basis for rating
|
Positive Factors |
Adverse Factors |
|
It has been found to have regular payment performance and has paid all of its debts in a timely manner. It is one of the major domestic companies in terms of sales volume. TEXTIL SANTANDERINA SA's borrowing cost is appropriate according to its volume of external financing sources. Positive Working Capital. The Company's Working Capital quality is significant, i.e. much of the Company financing comes from its equity. A structure is considered optimal if its liquidity level is slightly above its debt volume as a result of low idleness levels of its financial resources involved. Adequate long-term solvency. As the Real Assets of the company exceed its total debts, it offers, in principle, real property guarantee for settlement of its long-term obligations to third parties. |
Productivity decrease. The Company's salaried staff productivity has decreased with respect to the previous fiscal year. This productivity decrease is reflected in a decrease in its generated income, a fact that might hinder the Company's financial situation. In fiscal year 2012 , total debts incurred with credit institutions and trade creditors has increased with respect to the previous fiscal year. The greater the level of indebtedness, the greater the Company's reliance on capital suppliers and the more complicated its financial standing. It has no operating income return. The Company has no return on the investments necessary for its main activity with respect to its assets. It has no profits on its typical business activities in 2012 but it does in 2011 . During 2012 the company renewed its customer portfolio 3.60 times. This reflects an approximate average payment collection term of 120 días days. Average payment term to suppliers is longer than average payment term from customers.This means that the company pays to suppliers later than it receives payment from its customers. This benefits the company from a financial perspective, as it may increase its income; whereas it is risky for suppliers, who are, therefore, financing the company. |
|
Sector in which comparison is carried out : 132 Weaving of textiles |
|
|
Relative Position:
|
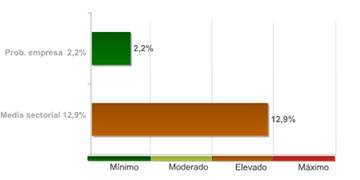
The company's comparative analysis with the rest of the companies that comprise the sector, shows the company holds a better position with regard to the probability of non-compliance.
The 98.00% of the companies of the sector TEXTIL SANTANDERINA SA belongs to show a higher probability of non-compliance.
The probability of the company's non-compliance with its payment obligations within deadlines estimated by our qualifications models is 2.21%.
In the event they fail to comply with the payment, the seriousness of the loss will depend on factors such as the promptness of the commencement of the charging management, the existence of executive documents which match the credit or the existence of guarantees and free debt assets under the name of the debtor. Therefore, the probability of non-compliance should not be solely interpreted as the total loss of the owed amount.
LEGAL CLAIMS
|
|
|
|
|
|
Summary of Judicial Claims |
|
|
|
|
|
|
|
|
||
|
|
|
No se han publicado |
|
|
|
|
No se han publicado |
|
|
|
|
||
|
|
|
No se han publicado |
|
|
|
|
No se han publicado |
|
|
|
|
No se han publicado |
|
|
|
|
No se han publicado |
|
|
|
|
||
|
|
|
No se han publicado |
|
|
|
|
No se han publicado |
|
|
|
|
||
|
|
|
No se han publicado |
|
|
|
|
|
|
|
|
IS RELATED WITH: |
2 Entities |
|
PARTICIPATES IN: |
8 Entities |
|
SHAREHOLDERS: |
8 Entities |
> Shareholders
|
Relationship |
Entity |
Province |
Shareholding stake |
|
SHAREHOLDERS |
CONRADO PARES BOJ |
|
3.73 |
|
|
CRISTINA SERRA ROQUE |
|
4.11 |
|
|
JUAN ANGEL PARES BOJ |
|
6.9 |
|
|
JUAN MARIA PARES SERRA |
|
21.41 |
|
|
NURIA SERRA ROQUE |
|
3.72 |
|
|
GESTION DE BIENES Y SERVICIOS SA |
BARCELONA |
15.49 |
|
|
PILAR BOJ VILALTA |
|
5.1 |
|
|
SILVIA BENET SERRA |
|
2.76 |
|
PARTICIPATES IN |
ACABATS DEL BAGES SA |
BARCELONA |
47 |
|
|
INADE SA |
ZARAGOZA |
25 |
|
|
MONRETEX SA |
BARCELONA |
47.73 |
|
|
FABRICA ESPAÑOLA DE CONFECCIONES SA |
MADRID |
11.96 |
|
|
SANTEX (HANGZHOU) TEXTILE CO.M, S.A. |
|
100 |
|
|
TEXTIL SANTANDERINA USA |
|
100 |
|
|
ZATATEX SARL |
|
100 |
|
|
BELLISSIMA APPARELS, S.A. |
|
55 |
> Other relationships
|
Relationship |
Entity |
Province |
Shareholding stake |
|
IS RELATED WITH |
| | |
|
|
|
|
ZATATEX SARL |
|
|
|
|
DESARROLLO Y COMERCIALIZACION DE ARTICULOS TEXTILES SL |
MADRID |
|
|
Turnover
|
|
|
Total Sales 2013 |
120.000.000 |
Financial Years Presented
|
Ejercicio |
Tipo de Cuentas Anuales |
Fecha Presentacion |
|
2012 |
Normales |
October 2013 |
|
2011 |
Consolidadas |
July 2012 |
|
2011 |
Normales |
July 2012 |
|
2010 |
Consolidadas |
October 2011 |
|
2010 |
Normales |
August 2011 |
|
2009 |
Consolidadas |
September 2010 |
|
2009 |
Normales |
September 2010 |
|
2008 |
Consolidadas |
August 2009 |
|
2008 |
Normales |
August 2009 |
|
2007 |
Normales |
July 2008 |
|
2006 |
Normales |
September 2007 |
|
2005 |
Normales |
July 2006 |
|
2004 |
Normales |
July 2005 |
|
2003 |
Normales |
July 2004 |
|
2002 |
Normales |
October 2003 |
|
2001 |
Normales |
July 2002 |
|
2000 |
Normales |
December 2001 |
|
1999 |
Normales |
March 2001 |
|
1998 |
Normales |
February 2000 |
|
1997 |
Normales |
August 1998 |
|
1996 |
Normales |
October 1997 |
|
1995 |
Normales |
July 1996 |
|
1994 |
Normales |
July 1995 |
|
1993 |
Normales |
August 1994 |
|
1992 |
Normales |
July 1993 |
|
1991 |
Normales |
July 1992 |
|
1990 |
Normales |
August 1991 |
|
1989 |
Normales |
August 1990 |
The data in the report regarding the last Company Accounts submitted by the company is taken from the TRADE REGISTER serving the region in which the company's address is located 31/12/2012
> Balance en formato Normal de acuerdo al Nuevo Plan General Contable 2007
Information
corresponding to the fiscal year
2012 2011 2010 2009 2008 is taken from information
submitted to the TRADE REGISTER. Data corresponding to fiscal years before
2012 2011 2010 2009 2008 has been compiled based on
the equivalence criteria stipulated in Act JUS/206/2009. Where the provisions
of the Act did not establish relevant equivalence criteria, axesor created such
criteria using its own methodology. To view details on the methodology.
|
|
ORIGINAL |
ORIGINAL |
ORIGINAL |
ORIGINAL |
ORIGINAL |
|
|
Assets |
2012 |
2011 |
2010 |
2009 |
2008 |
|
|
A) NON-CURRENT ASSETS: 11000 |
17.923.556,00 |
25.938.415,00 |
26.042.044,00 |
26.369.117,00 |
18.927.673,00 |
|
|
I. Intangible fixed assets : 11100 |
66.879,00 |
52.192,00 |
21.196,00 |
11.366,00 |
931,00 |
|
|
1. Development: 11110 |
0,00 |
0,00 |
0,00 |
0,00 |
0,00 |
|
|
2. Concessions: 11120 |
66.879,00 |
52.192,00 |
21.196,00 |
11.366,00 |
931,00 |
|
|
3. Patents, licencing, trade marks and similar: 11130 |
0,00 |
0,00 |
0,00 |
0,00 |
0,00 |
|
|
4. Goodwill: 11140 |
0,00 |
0,00 |
0,00 |
0,00 |
0,00 |
|
|
5. IT applications: 11150 |
0,00 |
0,00 |
0,00 |
0,00 |
0,00 |
|
|
6. Investigation: 11160 |
0,00 |
0,00 |
0,00 |
0,00 |
0,00 |
|
|
7. Other intangible fixed assets: 11170 |
0,00 |
0,00 |
0,00 |
0,00 |
0,00 |
|
|
II. Tangible fixed assets : 11200 |
7.787.152,00 |
8.094.758,00 |
8.862.854,00 |
9.003.662,00 |
9.508.691,00 |
|
|
1. Land and buildings: 11210 |
3.122.172,00 |
3.411.829,00 |
3.706.683,00 |
3.835.976,00 |
4.068.289,00 |
|
|
2. Technical installations and other tangible fixed assets: 11220 |
4.664.980,00 |
4.682.929,00 |
5.156.171,00 |
5.167.686,00 |
5.440.402,00 |
|
|
3. Tangible asset in progress and advances: 11230 |
0,00 |
0,00 |
0,00 |
0,00 |
0,00 |
|
|
III. Real estate investment: 11300 |
3.727.261,00 |
3.821.196,00 |
3.993.035,00 |
4.164.874,00 |
4.336.713,00 |
|
|
1. Land: 11310 |
0,00 |
0,00 |
0,00 |
0,00 |
0,00 |
|
|
2. Buildings: 11320 |
3.727.261,00 |
3.821.196,00 |
3.993.035,00 |
4.164.874,00 |
4.336.713,00 |
|
|
IV. Long-term investments in Group companies and associates : 11400 |
3.323.374,00 |
13.173.509,00 |
12.001.162,00 |
11.672.793,00 |
4.802.525,00 |
|
|
1. Equity instruments: 11410 |
2.756.088,00 |
4.392.275,00 |
4.122.793,00 |
4.122.793,00 |
4.802.525,00 |
|
|
2. Credits to businesses: 11420 |
567.286,00 |
8.781.234,00 |
7.878.369,00 |
7.550.000,00 |
0,00 |
|
|
3. Debt securities: 11430 |
0,00 |
0,00 |
0,00 |
0,00 |
0,00 |
|
|
4. Derivatives : 11440 |
0,00 |
0,00 |
0,00 |
0,00 |
0,00 |
|
|
5. Other financial assets : 11450 |
0,00 |
0,00 |
0,00 |
0,00 |
0,00 |
|
|
6. Other investments: 11460 |
0,00 |
0,00 |
0,00 |
0,00 |
0,00 |
|
|
V. Long-term financial investments: 11500 |
2.042.006,00 |
796.759,00 |
1.163.797,00 |
1.516.422,00 |
278.814,00 |
|
|
1. Equity instruments: 11510 |
0,00 |
0,00 |
0,00 |
0,00 |
0,00 |
|
|
2. Credits to third parties : 11520 |
2.041.106,00 |
615.556,00 |
978.513,00 |
1.328.438,00 |
90.150,00 |
|
|
3. Debt securities: 11530 |
0,00 |
0,00 |
0,00 |
0,00 |
0,00 |
|
|
4. Derivatives : 11540 |
0,00 |
0,00 |
0,00 |
0,00 |
0,00 |
|
|
5. Other financial assets : 11550 |
900,00 |
181.204,00 |
185.284,00 |
187.984,00 |
188.664,00 |
|
|
6. Other investments: 11560 |
0,00 |
0,00 |
0,00 |
0,00 |
0,00 |
|
|
VI. Assets for deferred tax : 11600 |
976.884,00 |
0,00 |
0,00 |
0,00 |
0,00 |
|
|
VII. Non-current trade debts : 11700 |
0,00 |
0,00 |
0,00 |
0,00 |
0,00 |
|
|
B) CURRENT ASSETS: 12000 |
76.956.793,00 |
64.440.898,00 |
64.324.908,00 |
56.225.840,00 |
62.141.877,00 |
|
|
I. Non-current assets held for sale : 12100 |
0,00 |
0,00 |
0,00 |
0,00 |
0,00 |
|
|
II. Stocks: 12200 |
35.782.726,00 |
34.517.987,00 |
32.157.454,00 |
25.908.283,00 |
24.707.956,00 |
|
|
1. Commercial: 12210 |
0,00 |
0,00 |
0,00 |
0,00 |
0,00 |
|
|
2. Primary material and other supplies: 12220 |
2.764.181,00 |
3.315.536,00 |
3.707.585,00 |
2.312.053,00 |
2.046.127,00 |
|
|
3. Work in progress: 12230 |
18.532.989,00 |
15.263.622,00 |
12.395.590,00 |
10.835.824,00 |
10.003.929,00 |
|
|
a) Of long-term production cycle : 12231 |
0,00 |
0,00 |
0,00 |
0,00 |
0,00 |
|
|
b) Of short-term production cycle : 12232 |
18.532.989,00 |
15.263.622,00 |
12.395.590,00 |
10.835.824,00 |
10.003.929,00 |
|
|
4. Finished goods: 12240 |
14.464.278,00 |
15.663.697,00 |
16.028.596,00 |
12.741.140,00 |
12.634.086,00 |
|
|
a) Of long-term production cycle : 12241 |
0,00 |
0,00 |
0,00 |
0,00 |
0,00 |
|
|
b) Of short-term production cycle : 12242 |
14.464.278,00 |
15.663.697,00 |
16.028.596,00 |
12.741.140,00 |
12.634.086,00 |
|
|
5. By-products, residues and recycled materials: 12250 |
21.278,00 |
16.669,00 |
25.683,00 |
19.265,00 |
0,00 |
|
|
6. Advances to suppliers: 12260 |
0,00 |
258.463,00 |
0,00 |
0,00 |
23.814,00 |
|
|
III. Trade debtors and others receivable accounts: 12300 |
32.848.849,00 |
27.158.549,00 |
29.231.073,00 |
27.489.382,00 |
27.214.643,00 |
|
|
1. Trade debtors / accounts receivable: 12310 |
29.497.739,00 |
25.688.170,00 |
27.536.678,00 |
25.820.445,00 |
26.150.973,00 |
|
|
a) Long-term receivables from sales and services supplied : 12311 |
0,00 |
0,00 |
0,00 |
0,00 |
0,00 |
|
|
b) Customers for sales and provisions of services : 12312 |
29.497.739,00 |
25.688.170,00 |
27.536.678,00 |
25.820.445,00 |
26.150.973,00 |
|
|
2. Customers, Group companies and associates : 12320 |
262.868,00 |
473.909,00 |
807.092,00 |
1.106.131,00 |
814.816,00 |
|
|
3. Other accounts receivable: 12330 |
123.478,00 |
279.621,00 |
192.463,00 |
153.253,00 |
124.285,00 |
|
|
4. Personnel: 12340 |
1.731,00 |
1.767,00 |
1.839,00 |
1.839,00 |
2.007,00 |
|
|
5. Assets for deferred tax: 12350 |
272.844,00 |
331.861,00 |
239.682,00 |
100.434,00 |
122.563,00 |
|
|
6. Other debtors, including tax and social security: 12360 |
2.690.189,00 |
383.222,00 |
453.319,00 |
307.280,00 |
0,00 |
|
|
7. Called up share capital: 12370 |
0,00 |
0,00 |
0,00 |
0,00 |
0,00 |
|
|
IV. Short-term investments in Group companies and associates: 12400 |
169.622,00 |
432.825,00 |
32.825,00 |
208.992,00 |
6.656.909,00 |
|
|
1. Equity instruments: 12410 |
0,00 |
0,00 |
0,00 |
0,00 |
0,00 |
|
|
2. Credits to businesses: 12420 |
169.622,00 |
432.825,00 |
32.825,00 |
208.992,00 |
6.656.909,00 |
|
|
3. Debt securities: 12430 |
0,00 |
0,00 |
0,00 |
0,00 |
0,00 |
|
|
4. Derivatives : 12440 |
0,00 |
0,00 |
0,00 |
0,00 |
0,00 |
|
|
5. Other financial assets : 12450 |
0,00 |
0,00 |
0,00 |
0,00 |
0,00 |
|
|
6. Other investments: 12460 |
0,00 |
0,00 |
0,00 |
0,00 |
0,00 |
|
|
V. Short-term financial investments : 12500 |
7.775.989,00 |
1.341.112,00 |
1.087.756,00 |
1.771.656,00 |
2.763.786,00 |
|
|
1. Equity instruments: 12510 |
383.683,00 |
374.845,00 |
432.158,00 |
539.995,00 |
520.204,00 |
|
|
2. Credits to businesses: 12520 |
687.906,00 |
766.440,00 |
355.598,00 |
231.662,00 |
0,00 |
|
|
3. Debt securities: 12530 |
6.700.000,00 |
199.828,00 |
300.000,00 |
1.000.000,00 |
2.243.582,00 |
|
|
4. Derivatives : 12540 |
0,00 |
0,00 |
0,00 |
0,00 |
0,00 |
|
|
5. Other financial assets : 12550 |
4.400,00 |
0,00 |
0,00 |
0,00 |
0,00 |
|
|
6. Other investments: 12560 |
0,00 |
0,00 |
0,00 |
0,00 |
0,00 |
|
|
VI. Short-term accruals: 12600 |
0,00 |
0,00 |
0,00 |
0,00 |
0,00 |
|
|
VII. Cash and other equivalent liquid assets : 12700 |
379.608,00 |
990.424,00 |
1.815.800,00 |
847.527,00 |
798.583,00 |
|
|
1. Treasury: 12710 |
379.608,00 |
990.424,00 |
1.815.800,00 |
847.527,00 |
798.583,00 |
|
|
2. Other equivalent liquid assets: 12720 |
0,00 |
0,00 |
0,00 |
0,00 |
0,00 |
|
|
TOTAL ASSETS (A + B) : 10000 |
94.880.349,00 |
90.379.313,00 |
90.366.952,00 |
82.594.957,00 |
81.069.550,00 |
|
|
|
ORIGINAL |
ORIGINAL |
ORIGINAL |
ORIGINAL |
ORIGINAL |
|
|
Liabilities and Net Worth |
2012 |
2011 |
2010 |
2009 |
2008 |
|
|
A) NET WORTH: 20000 |
60.627.771,00 |
63.046.044,00 |
62.528.882,00 |
61.296.397,00 |
63.963.054,00 |
|
|
A-1) Shareholders' equity: 21000 |
60.303.681,00 |
62.710.302,00 |
62.262.968,00 |
61.023.480,00 |
63.638.779,00 |
|
|
I. Capital: 21100 |
6.484.800,00 |
6.484.800,00 |
6.484.800,00 |
6.484.800,00 |
6.611.133,00 |
|
|
1. Registered capital : 21110 |
6.484.800,00 |
6.484.800,00 |
6.484.800,00 |
6.484.800,00 |
6.611.133,00 |
|
|
2. (Uncalled capital): 21120 |
0,00 |
0,00 |
0,00 |
0,00 |
0,00 |
|
|
II. Share premium: 21200 |
2.704.554,00 |
2.704.554,00 |
2.704.554,00 |
2.704.554,00 |
2.704.554,00 |
|
|
III. Reserves: 21300 |
5.124.239,00 |
5.124.239,00 |
5.124.239,00 |
5.124.239,00 |
57.466.187,00 |
|
|
1. Legal y estatutarias: 21310 |
1.296.960,00 |
1.296.960,00 |
1.296.960,00 |
1.296.960,00 |
1.322.227,00 |
|
|
2. Other reserves: 21320 |
3.827.279,00 |
3.827.279,00 |
3.827.279,00 |
3.827.279,00 |
56.143.960,00 |
|
|
IV. (Common stock equity): 21400 |
0,00 |
0,00 |
0,00 |
0,00 |
-884.290,00 |
|
|
V. Results from previous periods: 21500 |
48.296.708,00 |
47.749.374,00 |
46.709.886,00 |
48.654.453,00 |
0,00 |
|
|
1. Brought forward: 21510 |
48.296.708,00 |
47.749.374,00 |
46.709.886,00 |
48.654.453,00 |
0,00 |
|
|
2. (Negative results from previous periods): 21520 |
0,00 |
0,00 |
0,00 |
0,00 |
0,00 |
|
|
VI. Other shareholders' contributions: 21600 |
0,00 |
0,00 |
0,00 |
0,00 |
0,00 |
|
|
VII. Result of the period: 21700 |
-2.306.621,00 |
647.334,00 |
1.239.488,00 |
-1.944.568,00 |
-2.258.805,00 |
|
|
VIII. (Interim dividend): 21800 |
0,00 |
0,00 |
0,00 |
0,00 |
0,00 |
|
|
IX. Other net worth instruments: 21900 |
0,00 |
0,00 |
0,00 |
0,00 |
0,00 |
|
|
A-2) Adjustments due to changes in value: 22000 |
0,00 |
0,00 |
0,00 |
0,00 |
0,00 |
|
|
I. Financial assets held for sale: 22100 |
0,00 |
0,00 |
0,00 |
0,00 |
0,00 |
|
|
II. Hedge operations: 22200 |
0,00 |
0,00 |
0,00 |
0,00 |
0,00 |
|
|
III. Linked non-current assets and liabilities held for sale : 22300 |
0,00 |
0,00 |
0,00 |
0,00 |
0,00 |
|
|
IV. Exchange rate difference: 22400 |
0,00 |
0,00 |
0,00 |
0,00 |
0,00 |
|
|
V. Other: 22500 |
0,00 |
0,00 |
0,00 |
0,00 |
0,00 |
|
|
A-3) Received subsidies, donations and legacies: 23000 |
324.089,00 |
335.742,00 |
265.914,00 |
272.918,00 |
324.275,00 |
|
|
B) NON-CURRENT LIABILITIES: 31000 |
1.557.777,00 |
2.420.015,00 |
3.968.122,00 |
2.970.390,00 |
3.278.292,00 |
|
|
I. Long-term provisions: 31100 |
0,00 |
0,00 |
177.100,00 |
106.766,00 |
851,00 |
|
|
1. Long-term employee benefits liability: 31110 |
0,00 |
0,00 |
0,00 |
0,00 |
0,00 |
|
|
2. Environmental actions: 31120 |
0,00 |
0,00 |
177.100,00 |
106.766,00 |
851,00 |
|
|
3. Restructuring provisions: 31130 |
0,00 |
0,00 |
0,00 |
0,00 |
0,00 |
|
|
4. Other provisions: 31140 |
0,00 |
0,00 |
0,00 |
0,00 |
0,00 |
|
|
II Long-term creditors: 31200 |
1.447.544,00 |
2.298.493,00 |
3.686.143,00 |
2.746.660,00 |
3.138.500,00 |
|
|
1. Liabilities and other securities: 31210 |
0,00 |
0,00 |
0,00 |
0,00 |
0,00 |
|
|
2. Amounts owed to credit institutions: 31220 |
1.447.544,00 |
2.298.493,00 |
3.686.143,00 |
2.746.660,00 |
3.138.500,00 |
|
|
3. Creditors from financial leasing: 31230 |
0,00 |
0,00 |
0,00 |
0,00 |
0,00 |
|
|
4. Derivatives : 31240 |
0,00 |
0,00 |
0,00 |
0,00 |
0,00 |
|
|
5. Other financial liabilities : 31250 |
0,00 |
0,00 |
0,00 |
0,00 |
0,00 |
|
|
III. Long-term debts with Group companies and associates: 31300 |
0,00 |
0,00 |
0,00 |
0,00 |
0,00 |
|
|
IV. Liabilities for deferred tax: 31400 |
110.233,00 |
121.522,00 |
104.879,00 |
116.965,00 |
138.941,00 |
|
|
V. Long-term accruals: 31500 |
0,00 |
0,00 |
0,00 |
0,00 |
0,00 |
|
|
VI. Non-current trade creditors : 31600 |
0,00 |
0,00 |
0,00 |
0,00 |
0,00 |
|
|
VII. Special long-term debts : 31700 |
0,00 |
0,00 |
0,00 |
0,00 |
0,00 |
|
|
C) CURRENT LIABILITIES : 32000 |
32.694.801,00 |
24.913.254,00 |
23.869.948,00 |
18.328.169,00 |
13.828.204,00 |
|
|
I. Liabilities linked to non-current assets held for sale: 32100 |
0,00 |
0,00 |
0,00 |
0,00 |
0,00 |
|
|
II. Short-term provisions: 32200 |
12.028,00 |
86.425,00 |
0,00 |
0,00 |
0,00 |
|
|
III. Short-term creditors : 32300 |
10.735.073,00 |
9.143.698,00 |
7.317.875,00 |
3.932.995,00 |
2.272.318,00 |
|
|
1. Liabilities and other securities: 32310 |
0,00 |
0,00 |
0,00 |
0,00 |
0,00 |
|
|
2. Amounts owed to credit institutions: 32320 |
10.735.073,00 |
9.143.698,00 |
6.851.642,00 |
3.700.570,00 |
2.033.897,00 |
|
|
3. Creditors from financial leasing: 32330 |
0,00 |
0,00 |
0,00 |
0,00 |
0,00 |
|
|
4. Derivatives : 32340 |
0,00 |
0,00 |
0,00 |
0,00 |
0,00 |
|
|
5. Other financial liabilities : 32350 |
0,00 |
0,00 |
466.234,00 |
232.425,00 |
238.421,00 |
|
|
IV. Short-term debts with Group companies and associates: 32400 |
0,00 |
0,00 |
0,00 |
0,00 |
0,00 |
|
|
V. Trade creditors and other accounts payable: 32500 |
21.947.700,00 |
15.683.131,00 |
16.552.072,00 |
14.395.174,00 |
11.555.886,00 |
|
|
1. Suppliers: 32510 |
19.803.039,00 |
12.759.155,00 |
14.781.831,00 |
12.823.337,00 |
8.848.917,00 |
|
|
a) Long-term debts : 32511 |
0,00 |
0,00 |
0,00 |
0,00 |
0,00 |
|
|
b) Short-term debts : 32512 |
19.803.039,00 |
12.759.155,00 |
14.781.831,00 |
12.823.337,00 |
8.848.917,00 |
|
|
2. Suppliers, Group companies and associates: 32520 |
932.242,00 |
1.035.940,00 |
319.422,00 |
358.420,00 |
1.112.648,00 |
|
|
3. Other creditors: 32530 |
316.185,00 |
928.275,00 |
525.489,00 |
385.833,00 |
638.557,00 |
|
|
4. Personnel (remuneration due): 32540 |
466.090,00 |
489.738,00 |
469.406,00 |
463.393,00 |
510.173,00 |
|
|
5. Liabilities for current tax: 32550 |
0,00 |
53.654,00 |
0,00 |
0,00 |
0,00 |
|
|
6. Otras deudas con las Administraciones Públicas. : 32560 |
430.144,00 |
416.368,00 |
455.924,00 |
364.190,00 |
440.491,00 |
|
|
7. Advances from clients: 32570 |
0,00 |
0,00 |
0,00 |
0,00 |
5.100,00 |
|
|
VI. Short-term accruals: 32600 |
0,00 |
0,00 |
0,00 |
0,00 |
0,00 |
|
|
VII. Special short-term debts : 32700 |
0,00 |
0,00 |
0,00 |
0,00 |
0,00 |
|
|
TOTAL NET WORTH AND LIABILITIES (A + B + C) : 30000 |
94.880.349,00 |
90.379.313,00 |
90.366.952,00 |
82.594.957,00 |
81.069.550,00 |
|
|
|
ORIGINAL |
ORIGINAL |
ORIGINAL |
ORIGINAL |
ORIGINAL |
|
|
Profit and Loss |
2012 |
2011 |
2010 |
2009 |
2008 |
|
|
1. Net turnover: 40100 |
118.003.505,00 |
107.854.933,00 |
93.927.936,00 |
75.524.878,00 |
73.135.095,00 |
|
|
a) Sales: 40110 |
117.999.951,00 |
107.849.952,00 |
93.924.581,00 |
75.522.722,00 |
73.135.095,00 |
|
|
b) Rendering of services: 40120 |
3.554,00 |
4.981,00 |
3.355,00 |
2.155,00 |
0,00 |
|
|
2. Changes in stocks of finished goods and work in progress: 40200 |
2.074.556,00 |
2.494.119,00 |
4.853.639,00 |
934.401,00 |
2.492.091,00 |
|
|
3. Works carried out by the company for its assets: 40300 |
0,00 |
0,00 |
0,00 |
0,00 |
0,00 |
|
|
4. Supplies : 40400 |
-92.366.882,00 |
-82.412.475,00 |
-70.401.522,00 |
-54.267.662,00 |
-48.709.370,00 |
|
|
a) Stock consumption: 40410 |
0,00 |
0,00 |
0,00 |
-45.551.053,00 |
0,00 |
|
|
b) Consumption of raw materials and miscellaneous consumable ones: 40420 |
-75.727.883,00 |
-69.394.705,00 |
-57.973.084,00 |
0,00 |
-40.431.816,00 |
|
|
c) Works carried out by other companies: 40430 |
-16.638.998,00 |
-13.017.771,00 |
-12.428.438,00 |
-8.716.609,00 |
-8.277.555,00 |
|
|
d) Impairment of stock, primary material and other supplies: 40440 |
0,00 |
0,00 |
0,00 |
0,00 |
0,00 |
|
|
5. Other operating income: 40500 |
290.163,00 |
375.635,00 |
413.553,00 |
825.705,00 |
422.447,00 |
|
|
a) Auxiliary income and other from current management: 40510 |
220.628,00 |
210.820,00 |
333.111,00 |
230.112,00 |
253.630,00 |
|
|
b) Operation subsidies included in the Period's result: 40520 |
69.535,00 |
164.816,00 |
80.442,00 |
595.593,00 |
168.817,00 |
|
|
6. Personnel costs: 40600 |
-10.707.296,00 |
-10.434.631,00 |
-10.488.560,00 |
-10.080.624,00 |
-11.040.534,00 |
|
|
a) Wages, salaries et al.: 40610 |
-8.103.564,00 |
-7.970.096,00 |
-8.000.281,00 |
-7.842.559,00 |
-8.649.256,00 |
|
|
b) Social security costs: 40620 |
-2.432.376,00 |
-2.464.535,00 |
-2.488.279,00 |
-2.238.065,00 |
-2.391.277,00 |
|
|
c) Provisions : 40630 |
-171.356,00 |
0,00 |
0,00 |
0,00 |
0,00 |
|
|
7. Other operating costs: 40700 |
-18.502.442,00 |
-16.157.004,00 |
-15.704.185,00 |
-13.554.544,00 |
-14.736.159,00 |
|
|
a) External services: 40710 |
-16.952.769,00 |
-15.330.019,00 |
-14.843.704,00 |
-12.342.898,00 |
-14.318.023,00 |
|
|
b) Taxes: 40720 |
-165.263,00 |
-90.974,00 |
-172.348,00 |
-165.196,00 |
-133.573,00 |
|
|
c) Losses, impairments and variation in provisions from trade operations : 40730 |
-1.205.079,00 |
-337.682,00 |
-300.613,00 |
-676.527,00 |
-282.878,00 |
|
|
d) Other current management expenditure : 40740 |
-179.331,00 |
-398.329,00 |
-387.520,00 |
-369.923,00 |
-1.685,00 |
|
|
8. Amortisation of fixed assets: 40800 |
-1.502.269,00 |
-1.582.084,00 |
-1.671.049,00 |
-1.653.654,00 |
-2.061.783,00 |
|
|
9. Allocation of subsidies of non-financial fixed assets and other: 40900 |
66.505,00 |
58.399,00 |
40.285,00 |
156.588,00 |
143.177,00 |
|
|
10. Excess provisions : 41000 |
0,00 |
0,00 |
0,00 |
0,00 |
0,00 |
|
|
11. Impairment and result of transfers of fixed assets: 41100 |
179.331,00 |
398.329,00 |
387.520,00 |
-76.676,00 |
0,00 |
|
|
a) Impairment and losses : 41110 |
0,00 |
0,00 |
0,00 |
0,00 |
0,00 |
|
|
b) Results for transfers and other : 41120 |
179.331,00 |
398.329,00 |
387.520,00 |
-76.676,00 |
0,00 |
|
|
12. Negative difference in combined businesses: 41200 |
0,00 |
0,00 |
0,00 |
0,00 |
0,00 |
|
|
13. Other results : 41300 |
-8.931,00 |
-61.827,00 |
0,00 |
0,00 |
0,00 |
|
|
A.1) OPERATING INCOME (1 + 2 + 3 + 4 + 5 + 6 + 7 + 8 + 9 + 10 + 11 + 12 + 13) : 49100 |
-2.473.759,00 |
533.393,00 |
1.357.617,00 |
-2.191.589,00 |
-355.035,00 |
|
|
14. Financial income : 41400 |
425.529,00 |
422.957,00 |
370.081,00 |
619.279,00 |
547.564,00 |
|
|
a) Of shares in equity instruments : 41410 |
14.626,00 |
0,00 |
17.786,00 |
36.949,00 |
18.594,00 |
|
|
a 1) In Group companies and associates: 41411 |
0,00 |
0,00 |
0,00 |
17.278,00 |
18.594,00 |
|
|
a 2) In third parties: 41412 |
14.626,00 |
0,00 |
17.786,00 |
19.671,00 |
0,00 |
|
|
b) From negotiable securities and other financial instruments : 41420 |
410.903,00 |
422.957,00 |
352.295,00 |
582.330,00 |
528.970,00 |
|
|
b 1) From Group companies and associates : 41421 |
372.922,00 |
397.076,00 |
283.181,00 |
499.805,00 |
0,00 |
|
|
b 2) From third parties : 41422 |
37.981,00 |
25.882,00 |
69.114,00 |
82.525,00 |
528.970,00 |
|
|
c) Allocation of financial subsidies, donations and legacies : 41430 |
0,00 |
0,00 |
0,00 |
0,00 |
0,00 |
|
|
15. Financial expenditure: 41500 |
-313.435,00 |
-323.813,00 |
-162.802,00 |
-64.493,00 |
-142.787,00 |
|
|
a) Amounts owed to Group companies and associates : 41510 |
0,00 |
0,00 |
0,00 |
0,00 |
0,00 |
|
|
b) For debts with third parties : 41520 |
-313.435,00 |
-323.813,00 |
-162.802,00 |
-64.493,00 |
-142.787,00 |
|
|
c) Stock renewal : 41530 |
0,00 |
0,00 |
0,00 |
0,00 |
0,00 |
|
|
16. Changes in fair value of financial instruments : 41600 |
13.461,00 |
-57.313,00 |
-107.837,00 |
182.627,00 |
-257.618,00 |
|
|
a) Trading book and other : 41610 |
13.461,00 |
-57.313,00 |
-107.837,00 |
182.627,00 |
-257.618,00 |
|
|
b) Allocation of financial assets held for sale to the result for the period: 41620 |
0,00 |
0,00 |
0,00 |
0,00 |
0,00 |
|
|
17. Exchange rate differences : 41700 |
54.908,00 |
-143.719,00 |
-217.572,00 |
-451.358,00 |
-49.775,00 |
|
|
18. Impairment and result for transfers of financial instruments: 41800 |
-990.208,00 |
269.482,00 |
1,00 |
-39.034,00 |
-2.001.153,00 |
|
|
a) Impairment and losses : 41810 |
115.782,00 |
269.482,00 |
0,00 |
-656.139,00 |
-1.943.707,00 |
|
|
b) Results for transfers and other : 41820 |
-1.105.990,00 |
0,00 |
1,00 |
617.105,00 |
-57.446,00 |
|
|
19. Other financial income and expenditure: 42100 |
0,00 |
0,00 |
0,00 |
0,00 |
0,00 |
|
|
a) Incorporation of financial expenditure to assets: 42110 |
0,00 |
0,00 |
0,00 |
0,00 |
0,00 |
|
|
b) Financial income from arrangement with creditors: 42120 |
0,00 |
0,00 |
0,00 |
0,00 |
0,00 |
|
|
c) Other income and expenditure: 42130 |
0,00 |
0,00 |
0,00 |
0,00 |
0,00 |
|
|
A.2) FINANCIAL REVENUE (14+15+16+17+18+19) : 49200 |
-809.746,00 |
167.594,00 |
-118.129,00 |
247.021,00 |
-1.903.770,00 |
|
|
A.3) NET RESULT BEFORE TAXES (A.1+A.2) : 49300 |
-3.283.505,00 |
700.988,00 |
1.239.488,00 |
-1.944.568,00 |
-2.258.805,00 |
|
|
20. Income taxes: 41900 |
976.884,00 |
-53.654,00 |
0,00 |
0,00 |
0,00 |
|
|
A.4) PROFIT AFTER TAXES (A.3+20) : 49400 |
-2.306.621,00 |
647.334,00 |
1.239.488,00 |
-1.944.568,00 |
-2.258.805,00 |
|
|
21. Result of the year coming from interrupted operations : 42000 |
0,00 |
0,00 |
0,00 |
0,00 |
0,00 |
|
|
A.5) RESULT OF THE PERIOD (A.4+21) : 49500 |
-2.306.621,00 |
647.334,00 |
1.239.488,00 |
-1.944.568,00 |
-2.258.805,00 |
|
> Normal Balance Sheet under the rules of the 1990 General Accounting Plan (repealed since 1st January of 2008)
Information corresponding to the fiscal year 2012 2011 2010 2009 2008 has been compiled based on the equivalence criteria stipulated in Act JUS/206/2009. Where the provisions of the Act did not establish relevant equivalence criteria, Axesor created such criteria using its own methodology. To view details on the methodology 2012 2011 2010 2009 2008 is taken from information submitted to the TRADE REGISTER.
|
|
EQUIVALENCIA |
EQUIVALENCIA |
EQUIVALENCIA |
EQUIVALENCIA |
EQUIVALENCIA |
|
|
ASSETS |
2012 |
2011 |
2010 |
2009 |
2008 |
|
|
A) SHAREHOLDERS (PARTNERS) BY UNCALLED SUSCRIBED CAPITAL: |
0,00 |
0,00 |
0,00 |
0,00 |
0,00 |
|
|
B) FIXED ASSETS: |
16.946.672,00 |
25.938.415,00 |
26.042.044,00 |
26.369.117,00 |
19.811.963,00 |
|
|
I. Formation expenses: |
0,00 |
0,00 |
0,00 |
0,00 |
0,00 |
|
|
II. Intangible fixed assets: |
66.879,00 |
52.192,00 |
21.196,00 |
11.366,00 |
931,00 |
|
|
1. Research and development costs: |
0,00 |
0,00 |
0,00 |
0,00 |
0,00 |
|
|
2. Concessions, patents, licences, trademarks et al.: |
66.879,00 |
52.192,00 |
21.196,00 |
11.366,00 |
931,00 |
|
|
3. Goodwill: |
0,00 |
0,00 |
0,00 |
0,00 |
0,00 |
|
|
4. Key money paid for premises: |
0,00 |
0,00 |
0,00 |
0,00 |
0,00 |
|
|
5. Software: |
0,00 |
0,00 |
0,00 |
0,00 |
0,00 |
|
|
6. Assets under capital leases: |
0,00 |
0,00 |
0,00 |
0,00 |
0,00 |
|
|
7. Payments on account: |
0,00 |
0,00 |
0,00 |
0,00 |
0,00 |
|
|
8. Provisions: |
0,00 |
0,00 |
0,00 |
0,00 |
0,00 |
|
|
9. Accumulated depreciation: |
0,00 |
0,00 |
0,00 |
0,00 |
0,00 |
|
|
III. Tangible fixed assets: |
11.514.413,00 |
11.915.954,00 |
12.855.889,00 |
13.168.536,00 |
13.845.403,00 |
|
|
1. Land and construction: |
6.849.433,00 |
7.233.025,00 |
7.699.719,00 |
8.000.850,00 |
8.405.001,00 |
|
|
2. Technical installations and machinery: |
4.541.891,00 |
4.559.367,00 |
5.020.122,00 |
5.031.334,00 |
5.296.853,00 |
|
|
3. Other installations, tools and furniture: |
36.830,00 |
36.972,00 |
40.708,00 |
40.799,00 |
42.952,00 |
|
|
4. Payments on account and tangible fixed assets under construction: |
0,00 |
0,00 |
0,00 |
0,00 |
0,00 |
|
|
5. Other tangible assets: |
86.258,00 |
86.590,00 |
95.341,00 |
95.554,00 |
100.596,00 |
|
|
6. Provisions: |
0,00 |
0,00 |
0,00 |
0,00 |
0,00 |
|
|
7. Accumulated depreciation: |
0,00 |
0,00 |
0,00 |
0,00 |
0,00 |
|
|
IV. Financial investments: |
5.365.380,00 |
13.970.268,00 |
13.164.959,00 |
13.189.215,00 |
5.081.338,00 |
|
|
1. Equity investments in group companies: |
24.440,00 |
38.949,00 |
36.559,00 |
36.559,00 |
42.587,00 |
|
|
2. Receivables from group companies: |
567.286,00 |
8.781.234,00 |
7.878.369,00 |
7.550.000,00 |
0,00 |
|
|
3. Equity investment in associated companies: |
2.731.648,00 |
4.353.326,00 |
4.086.233,00 |
4.086.233,00 |
4.759.938,00 |
|
|
4. Credits to associated companies: |
0,00 |
0,00 |
0,00 |
0,00 |
0,00 |
|
|
5. Long-term securities portfolio: |
0,00 |
0,00 |
0,00 |
0,00 |
0,00 |
|
|
6. Other receivables: |
2.041.106,00 |
615.556,00 |
978.513,00 |
1.328.438,00 |
90.150,00 |
|
|
7. Long term guarantees and deposits: |
900,00 |
181.204,00 |
185.284,00 |
187.984,00 |
188.664,00 |
|
|
8. Provisions: |
0,00 |
0,00 |
0,00 |
0,00 |
0,00 |
|
|
9. Long-term receivables from public bodies: |
0,00 |
0,00 |
0,00 |
0,00 |
0,00 |
|
|
V. Own shares: |
0,00 |
0,00 |
0,00 |
0,00 |
884.290,00 |
|
|
VI. Long-term trade receivables: |
0,00 |
0,00 |
0,00 |
0,00 |
0,00 |
|
|
C) Deferred expenses: |
0,00 |
0,00 |
0,00 |
0,00 |
0,00 |
|
|
D) CURRENT ASSETS: |
77.933.677,00 |
64.440.898,00 |
64.324.908,00 |
56.225.840,00 |
62.141.877,00 |
|
|
I. Called-up share capital (not paid): |
0,00 |
0,00 |
0,00 |
0,00 |
0,00 |
|
|
II. Stocks: |
35.782.726,00 |
34.517.987,00 |
32.157.454,00 |
25.908.283,00 |
24.707.956,00 |
|
|
1. Goods for resale: |
0,00 |
0,00 |
0,00 |
0,00 |
0,00 |
|
|
2. Raw materials and other consumables: |
2.764.181,00 |
3.315.536,00 |
3.707.585,00 |
2.312.053,00 |
2.046.127,00 |
|
|
3. Goods in process and semifinished ones: |
18.532.989,00 |
15.263.622,00 |
12.395.590,00 |
10.835.824,00 |
10.003.929,00 |
|
|
4. Finished products: |
14.464.278,00 |
15.663.697,00 |
16.028.596,00 |
12.741.140,00 |
12.634.086,00 |
|
|
5. Byproducts, scrap and recovered materials: |
21.278,00 |
16.669,00 |
25.683,00 |
19.265,00 |
0,00 |
|
|
6. Payments on account: |
0,00 |
258.463,00 |
0,00 |
0,00 |
23.814,00 |
|
|
7. Provisions: |
0,00 |
0,00 |
0,00 |
0,00 |
0,00 |
|
|
III. Debtors: |
33.825.734,00 |
27.158.549,00 |
29.231.073,00 |
27.489.382,00 |
27.214.643,00 |
|
|
1. Trade debtors / accounts receivable: |
29.497.739,00 |
25.688.170,00 |
27.536.678,00 |
25.820.445,00 |
26.150.973,00 |
|
|
2. Accounts receivable, Group companies: |
0,00 |
0,00 |
0,00 |
0,00 |
0,00 |
|
|
3. Accounts receivable, associated companies: |
262.868,00 |
473.909,00 |
807.092,00 |
1.106.131,00 |
814.816,00 |
|
|
4. Other debtors: |
123.478,00 |
279.621,00 |
192.463,00 |
153.253,00 |
124.285,00 |
|
|
5. Staff: |
1.731,00 |
1.767,00 |
1.839,00 |
1.839,00 |
2.007,00 |
|
|
6. Public bodies: |
3.939.917,00 |
715.083,00 |
693.001,00 |
407.714,00 |
122.563,00 |
|
|
7. Provisions: |
0,00 |
0,00 |
0,00 |
0,00 |
0,00 |
|
|
IV. Short-term investments: |
7.945.610,00 |
1.773.938,00 |
1.120.581,00 |
1.980.648,00 |
9.420.695,00 |
|
|
1. Equity investments in group companies: |
0,00 |
0,00 |
0,00 |
0,00 |
0,00 |
|
|
2. Receivables from group companies: |
29.438,00 |
75.118,00 |
5.697,00 |
36.271,00 |
1.155.331,00 |
|
|
3. Equity investment in associated companies: |
0,00 |
0,00 |
0,00 |
0,00 |
0,00 |
|
|
4. Credits to associated companies: |
140.183,00 |
357.707,00 |
27.128,00 |
172.720,00 |
5.501.577,00 |
|
|
5. Short term securities portfolio: |
7.083.683,00 |
574.672,00 |
732.158,00 |
1.539.995,00 |
2.763.786,00 |
|
|
6. Other receivables: |
687.906,00 |
766.440,00 |
355.598,00 |
231.662,00 |
0,00 |
|
|
7. Shor term guarantees and deposits: |
4.400,00 |
0,00 |
0,00 |
0,00 |
0,00 |
|
|
8. Provisions: |
0,00 |
0,00 |
0,00 |
0,00 |
0,00 |
|
|
V. Short-term treasury shares: |
0,00 |
0,00 |
0,00 |
0,00 |
0,00 |
|
|
VI. Cash at bank and in hand: |
379.608,00 |
990.424,00 |
1.815.800,00 |
847.527,00 |
798.583,00 |
|
|
VII. Prepayments and accrued income: |
0,00 |
0,00 |
0,00 |
0,00 |
0,00 |
|
|
GENERAL TOTAL (A + B + C + D): |
94.880.349,00 |
90.379.313,00 |
90.366.952,00 |
82.594.957,00 |
81.953.840,00 |
|
MERCANTILE REGISTRY.
|
|
EQUIVALENCIA |
EQUIVALENCIA |
EQUIVALENCIA |
EQUIVALENCIA |
EQUIVALENCIA |
|
|
LIABILITIES |
2012 |
2011 |
2010 |
2009 |
2008 |
|
|
A) EQUITY: |
60.400.908,00 |
62.811.025,00 |
62.519.842,00 |
61.212.121,00 |
64.621.203,00 |
|
|
I. Subscribed capital: |
6.484.800,00 |
6.484.800,00 |
6.484.800,00 |
6.484.800,00 |
6.611.133,00 |
|
|
II. Share premium: |
2.704.554,00 |
2.704.554,00 |
2.704.554,00 |
2.704.554,00 |
2.704.554,00 |
|
|
III. Revaluation reserves: |
0,00 |
0,00 |
0,00 |
0,00 |
0,00 |
|
|
IV. Reserves: |
5.221.466,00 |
5.224.962,00 |
5.381.113,00 |
5.312.880,00 |
57.564.320,00 |
|
|
1. Legal reserve: |
1.296.960,00 |
1.296.960,00 |
1.296.960,00 |
1.296.960,00 |
1.322.227,00 |
|
|
2. Reserves for own shares: |
52.385,00 |
53.764,00 |
57.372,00 |
60.200,00 |
884.642,00 |
|
|
3. Reserves for shares of the controlling company: |
0,00 |
0,00 |
0,00 |
0,00 |
0,00 |
|
|
4. Statutory reserves: |
0,00 |
0,00 |
0,00 |
0,00 |
0,00 |
|
|
5. Miscellaneous reserves: |
3.872.121,00 |
3.874.238,00 |
4.026.781,00 |
3.955.720,00 |
55.357.452,00 |
|
|
Differences due to capital adjustement to euros: |
0,00 |
0,00 |
0,00 |
0,00 |
0,00 |
|
|
V. Profit or loss brought forward: |
48.296.708,00 |
47.749.374,00 |
46.709.886,00 |
48.654.453,00 |
0,00 |
|
|
1. Retained earnings: |
48.296.708,00 |
47.749.374,00 |
46.709.886,00 |
48.654.453,00 |
0,00 |
|
|
2. Prior year losses: |
0,00 |
0,00 |
0,00 |
0,00 |
0,00 |
|
|
3. Partners' contributions so as to compensate losses: |
0,00 |
0,00 |
0,00 |
0,00 |
0,00 |
|
|
VI. Profit or loss for the financial year: |
-2.306.621,00 |
647.334,00 |
1.239.488,00 |
-1.944.568,00 |
-2.258.805,00 |
|
|
VII. Interim dividend paid: |
0,00 |
0,00 |
0,00 |
0,00 |
0,00 |
|
|
VIII. Own shares for capital reduction: |
0,00 |
0,00 |
0,00 |
0,00 |
0,00 |
|
|
B) Deferred income: |
226.863,00 |
235.020,00 |
186.140,00 |
191.042,00 |
226.993,00 |
|
|
1. Capital grants: |
226.863,00 |
235.020,00 |
186.140,00 |
191.042,00 |
226.993,00 |
|
|
2. Unrealised exchange gains: |
0,00 |
0,00 |
0,00 |
0,00 |
0,00 |
|
|
3. Other deferred income: |
0,00 |
0,00 |
0,00 |
0,00 |
0,00 |
|
|
4. Public revenues to distribute in several financial years: |
0,00 |
0,00 |
0,00 |
0,00 |
0,00 |
|
|
C) PROVISIONS FOR LIABILITIES AND CHARGES: |
0,00 |
0,00 |
0,00 |
0,00 |
0,00 |
|
|
1. Provisions for pension fund and other similar obligations: |
0,00 |
0,00 |
0,00 |
0,00 |
0,00 |
|
|
2. Provisions for taxes: |
0,00 |
0,00 |
0,00 |
0,00 |
0,00 |
|
|
3. Other provisions: |
0,00 |
0,00 |
0,00 |
0,00 |
0,00 |
|
|
4. Reversion fund: |
0,00 |
0,00 |
0,00 |
0,00 |
0,00 |
|
|
D) LONG TERM LIABILITIES: |
1.557.777,00 |
2.420.015,00 |
3.791.022,00 |
2.863.625,00 |
3.277.441,00 |
|
|
I. Issued debentures and other marketable securities: |
0,00 |
0,00 |
0,00 |
0,00 |
0,00 |
|
|
1. Non-convertible debentures: |
0,00 |
0,00 |
0,00 |
0,00 |
0,00 |
|
|
2. Convertible debentures: |
0,00 |
0,00 |
0,00 |
0,00 |
0,00 |
|
|
3. Other debt securities: |
0,00 |
0,00 |
0,00 |
0,00 |
0,00 |
|
|
II. Amounts owed to credit institutions: |
1.447.544,00 |
2.298.493,00 |
3.686.143,00 |
2.746.660,00 |
3.138.500,00 |
|
|
1. Loans and other liabilities: |
1.447.544,00 |
2.298.493,00 |
3.686.143,00 |
2.746.660,00 |
3.138.500,00 |
|
|
2. Long-term liabilities from capital leases: |
0,00 |
0,00 |
0,00 |
0,00 |
0,00 |
|
|
III. Debts with companies of the group and affiliated ones: |
0,00 |
0,00 |
0,00 |
0,00 |
0,00 |
|
|
1. Amounts owed to group companies: |
0,00 |
0,00 |
0,00 |
0,00 |
0,00 |
|
|
2. Amounts owed to associated companies: |
0,00 |
0,00 |
0,00 |
0,00 |
0,00 |
|
|
IV. Other creditors: |
110.233,00 |
121.522,00 |
104.879,00 |
116.965,00 |
138.941,00 |
|
|
1. Long-term bills of exchange payable: |
0,00 |
0,00 |
0,00 |
0,00 |
0,00 |
|
|
2. Other creditors: |
0,00 |
0,00 |
0,00 |
0,00 |
0,00 |
|
|
3. Long term guarantees and deposits received: |
0,00 |
0,00 |
0,00 |
0,00 |
0,00 |
|
|
4. Long term payables to public bodies: |
110.233,00 |
121.522,00 |
104.879,00 |
116.965,00 |
138.941,00 |
|
|
V. Unpaid portion of equity investment: |
0,00 |
0,00 |
0,00 |
0,00 |
0,00 |
|
|
1. Group companies: |
0,00 |
0,00 |
0,00 |
0,00 |
0,00 |
|
|
2. Associated companies: |
0,00 |
0,00 |
0,00 |
0,00 |
0,00 |
|
|
3. Third parties: |
0,00 |
0,00 |
0,00 |
0,00 |
0,00 |
|
|
VI. Long term trade creditors: |
0,00 |
0,00 |
0,00 |
0,00 |
0,00 |
|
|
E) SHORT TERM CREDITORS: |
32.682.773,00 |
24.826.829,00 |
23.869.948,00 |
18.328.169,00 |
13.828.204,00 |
|
|
I. Issued debentures and other marketable securities: |
0,00 |
0,00 |
0,00 |
0,00 |
0,00 |
|
|
1. Non-convertible debentures: |
0,00 |
0,00 |
0,00 |
0,00 |
0,00 |
|
|
2. Convertible debentures: |
0,00 |
0,00 |
0,00 |
0,00 |
0,00 |
|
|
3. Other debt securities: |
0,00 |
0,00 |
0,00 |
0,00 |
0,00 |
|
|
4. Accrued interest on debentures and other debt securities: |
0,00 |
0,00 |
0,00 |
0,00 |
0,00 |
|
|
II. Amounts owed to credit institutions: |
10.735.073,00 |
9.143.698,00 |
6.851.642,00 |
3.700.570,00 |
2.033.897,00 |
|
|
1. Loans and other liabilities: |
10.735.073,00 |
9.143.698,00 |
6.851.642,00 |
3.700.570,00 |
2.033.897,00 |
|
|
2. Accrued interest on liabilities with credit institutions: |
0,00 |
0,00 |
0,00 |
0,00 |
0,00 |
|
|
3. Short-term liabilities from capital leases: |
0,00 |
0,00 |
0,00 |
0,00 |
0,00 |
|
|
III. Short-term amounts owed to group and associated companies: |
932.242,00 |
1.035.940,00 |
319.422,00 |
358.420,00 |
1.112.648,00 |
|
|
1. Amounts owed to group companies: |
0,00 |
0,00 |
0,00 |
0,00 |
0,00 |
|
|
2. Amounts owed to associated companies: |
932.242,00 |
1.035.940,00 |
319.422,00 |
358.420,00 |
1.112.648,00 |
|
|
IV. Trade creditors: |
20.119.224,00 |
13.687.431,00 |
15.307.321,00 |
13.209.170,00 |
9.492.574,00 |
|
|
1. Advanced payments from customers: |
0,00 |
0,00 |
0,00 |
0,00 |
5.100,00 |
|
|
2. Amounts owed for purchases of goods or services: |
20.119.224,00 |
13.687.431,00 |
15.307.321,00 |
13.209.170,00 |
9.487.474,00 |
|
|
3. Debts represented by notes payable: |
0,00 |
0,00 |
0,00 |
0,00 |
0,00 |
|
|
V. Other creditors: |
896.234,00 |
959.760,00 |
1.391.564,00 |
1.060.008,00 |
1.189.085,00 |
|
|
1. Public bodies: |
430.144,00 |
470.022,00 |
455.924,00 |
364.190,00 |
440.491,00 |
|
|
2. Bills of exchange payable: |
0,00 |
0,00 |
0,00 |
0,00 |
0,00 |
|
|
3. Miscellaneous debts: |
0,00 |
0,00 |
466.234,00 |
232.425,00 |
238.421,00 |
|
|
4. Wages and salaries payable: |
466.090,00 |
489.738,00 |
469.406,00 |
463.393,00 |
510.173,00 |
|
|
5. Guarantees and deposits received at short term: |
0,00 |
0,00 |
0,00 |
0,00 |
0,00 |
|
|
VI. Provisions: |
0,00 |
0,00 |
0,00 |
0,00 |
0,00 |
|
|
VII. Prepayments and accrued income: |
0,00 |
0,00 |
0,00 |
0,00 |
0,00 |
|
|
F) SHORT-TERM PROVISIONS FOR LIABILITIES AND CHARGES: |
12.028,00 |
86.425,00 |
0,00 |
0,00 |
0,00 |
|
|
GENERAL TOTAL (A + B + C + D + E + F): |
94.880.349,00 |
90.379.313,00 |
90.366.952,00 |
82.594.957,00 |
81.953.840,00 |
|
MERCANTILE REGISTRY.
|
|
EQUIVALENCIA |
EQUIVALENCIA |
EQUIVALENCIA |
EQUIVALENCIA |
EQUIVALENCIA |
|
|
DEBIT |
2012 |
2011 |
2010 |
2009 |
2008 |
|
|
A) CHARGES (A.1 to A.15): |
123.414.579,00 |
110.957.038,00 |
98.753.528,00 |
80.805.151,00 |
78.999.178,00 |
|
|
A.1. Stock reduction of both manufactured goods and the ones in process: |
0,00 |
0,00 |
0,00 |
0,00 |
0,00 |
|
|
A.2. Supplies: |
92.366.882,00 |
82.412.475,00 |
70.401.522,00 |
54.267.662,00 |
48.709.370,00 |
|
|
a) Stock consumption: |
0,00 |
0,00 |
0,00 |
45.551.053,00 |
0,00 |
|
|
b) Consumption of raw materials and miscellaneous consumable ones: |
75.727.883,00 |
69.394.705,00 |
57.973.084,00 |
0,00 |
40.431.816,00 |
|
|
c) Miscellaneous external expenditure: |
16.638.998,00 |
13.017.771,00 |
12.428.438,00 |
8.716.609,00 |
8.277.555,00 |
|
|
A.3. Staff costs: |
10.707.296,00 |
10.434.631,00 |
10.488.560,00 |
10.080.624,00 |
11.040.534,00 |
|
|
a) Wages, salaries et al.: |
8.274.920,00 |
7.970.096,00 |
8.000.281,00 |
7.842.559,00 |
8.649.256,00 |
|
|
b) Social security costs: |
2.432.376,00 |
2.464.535,00 |
2.488.279,00 |
2.238.065,00 |
2.391.277,00 |
|
|
A.4. Depreciation expense: |
1.502.269,00 |
1.582.084,00 |
1.671.049,00 |
1.653.654,00 |
2.061.783,00 |
|
|
A.5. Variation of trade provisions and losses of unrecovered receivables: |
1.205.079,00 |
337.682,00 |
300.613,00 |
676.527,00 |
282.878,00 |
|
|
a) Stock provision variation: |
0,00 |
0,00 |
0,00 |
0,00 |
0,00 |
|
|
b) Variation in provision and bad debt losses: |
1.205.079,00 |
337.682,00 |
300.613,00 |
676.527,00 |
282.878,00 |
|
|
c) Variation of other trade provisions: |
0,00 |
0,00 |
0,00 |
0,00 |
0,00 |
|
|
A.6. Other operating charges: |
17.297.364,00 |
15.819.322,00 |
15.403.572,00 |
12.878.017,00 |
14.453.281,00 |
|
|
a) External services: |
16.952.769,00 |
15.330.019,00 |
14.843.704,00 |
12.342.898,00 |
14.318.023,00 |
|
|
b) Taxes: |
165.263,00 |
90.974,00 |
172.348,00 |
165.196,00 |
133.573,00 |
|
|
c) Other operating expenses: |
179.331,00 |
398.329,00 |
387.520,00 |
369.923,00 |
1.685,00 |
|
|
d) Allocation to revision fund: |
0,00 |
0,00 |
0,00 |
0,00 |
0,00 |
|
|
A.I. OPERATING BENEFITS (B.1+B.2+B.3+B.4-A.1-A.2-A.3-A.4-A.5-A.6): |
0,00 |
138.492,00 |
929.811,00 |
0,00 |
0,00 |
|
|
A.7. Financial and similar charges: |
1.419.425,00 |
323.813,00 |
162.802,00 |
81.180,00 |
200.234,00 |
|
|
a) Due to liabilities with companies of the group: |
0,00 |
0,00 |
0,00 |
0,00 |
0,00 |
|
|
b) Due to liabilities with associated companies: |
0,00 |
0,00 |
0,00 |
0,00 |
0,00 |
|
|
c) Due to other debts.: |
313.435,00 |
323.813,00 |
162.802,00 |
64.493,00 |
142.787,00 |
|
|
d) Losses from financial investments: |
1.105.990,00 |
0,00 |
0,00 |
16.687,00 |
57.446,00 |
|
|
A.8. Changes in financial investment provisions: |
-115.782,00 |
-212.169,00 |
107.837,00 |
444.463,00 |
1.530.075,00 |
|
|
A.9. Exchange losses: |
0,00 |
143.719,00 |
217.572,00 |
451.358,00 |
49.775,00 |
|
|
A.II. NET FINANCIAL INCOME (B.5+B.6+B.7+B.8-A.7-A.8-A.9): |
0,00 |
167.594,00 |
0,00 |
442.009,00 |
0,00 |
|
|
A.III. PROFIT FROM ORDINARY ACTIVITIES (A.I+A.II-B.I-B.II): |
0,00 |
306.087,00 |
811.683,00 |
0,00 |
0,00 |
|
|
A.10. Changes in provisions for intangible, tangible and securities portfolio: |
0,00 |
0,00 |
0,00 |
194.988,00 |
671.250,00 |
|
|
A.11. Losses from tangible and intangible fixed assets and securities portfolio: |
0,00 |
0,00 |
0,00 |
76.676,00 |
0,00 |
|
|
A.12. Losses from transactions with own shares and debentures: |
0,00 |
0,00 |
0,00 |
0,00 |
0,00 |
|
|
A.13. Extraordinary expenses: |
8.931,00 |
61.827,00 |
0,00 |
0,00 |
0,00 |
|
|
A.14. Expenses and losses of former financial years: |
0,00 |
0,00 |
0,00 |
0,00 |
0,00 |
|
|
A.IV. EXTRAORDINARY PROFIT (B.9+B.10+B.11+B.12+B.13-A.10-A.11-A.12-A.13-A.14): |
236.905,00 |
394.901,00 |
427.805,00 |
0,00 |
0,00 |
|
|
A.V. PROFIT BEFORE TAXES (A.III+A.IV-B.III-B.IV): |
0,00 |
700.988,00 |
1.239.488,00 |
0,00 |
0,00 |
|
|
A.15. Corporation tax: |
-976.884,00 |
53.654,00 |
0,00 |
0,00 |
0,00 |
|
|
A.16. Miscellaneous taxes: |
0,00 |
0,00 |
0,00 |
0,00 |
0,00 |
|
|
A.VI. FINANCIAL YEAR RESULTS (PROFIT) (A.V-A.15-A.16): |
0,00 |
647.334,00 |
1.239.488,00 |
0,00 |
0,00 |
|
MERCANTILE REGISTRY.
|
|
EQUIVALENCIA |
EQUIVALENCIA |
EQUIVALENCIA |
EQUIVALENCIA |
EQUIVALENCIA |
|
|
CREDIT |
2012 |
2011 |
2010 |
2009 |
2008 |
|
|
B) INCOME ( B.1 to B.13): |
121.107.958,00 |
111.604.372,00 |
99.993.016,00 |
78.860.583,00 |
76.740.374,00 |
|
|
B.1. Net total sales: |
118.003.505,00 |
107.854.933,00 |
93.927.936,00 |
75.524.878,00 |
73.135.095,00 |
|
|
a) Sales: |
123.011.145,00 |
112.430.098,00 |
97.913.347,00 |
78.730.003,00 |
76.240.979,00 |
|
|
b) Rendering of services: |
3.554,00 |
4.981,00 |
3.355,00 |
2.155,00 |
0,00 |
|
|
Returns and Rappel on sales: |
-5.011.194,00 |
-4.580.146,00 |
-3.988.767,00 |
-3.207.281,00 |
-3.105.884,00 |
|
|
B.2. Stock increase of manufactured goods and products in process: |
2.074.556,00 |
2.494.119,00 |
4.853.639,00 |
934.401,00 |
2.492.091,00 |
|
|
B.3. Works performed by the company for fixed assets: |
0,00 |
0,00 |
0,00 |
0,00 |
0,00 |
|
|
B.4. Miscellaneous operating income: |
290.163,00 |
375.635,00 |
413.553,00 |
825.705,00 |
422.447,00 |
|
|
a) Auxiliary income and other from current management: |
220.628,00 |
210.820,00 |
333.111,00 |
230.112,00 |
253.630,00 |
|
|
b) Grants: |
69.535,00 |
164.816,00 |
80.442,00 |
595.593,00 |
168.817,00 |
|
|
c) Liabilities and charges provisions surplus: |
0,00 |
0,00 |
0,00 |
0,00 |
0,00 |
|
|
B.I. PÉRDIDAS DE EXPLOTACIÓN (A.1+A.2+A.3+A.4+A.5-A.6-B.1-B.2-B.3-B.4): |
2.710.665,00 |
0,00 |
0,00 |
2.271.501,00 |
498.212,00 |
|
|
B.5. Income from equity investment: |
14.626,00 |
0,00 |
17.786,00 |
36.949,00 |
18.594,00 |
|
|
a) In companies of the group: |
0,00 |
0,00 |
0,00 |
17.278,00 |
18.594,00 |
|
|
b) In associated companies: |
0,00 |
0,00 |
0,00 |
0,00 |
0,00 |
|
|
c) Third parties: |
14.626,00 |
0,00 |
17.786,00 |
19.671,00 |
0,00 |
|
|
B.6. Income from other marketable securities and long-term receivables: |
0,00 |
0,00 |
0,00 |
0,00 |
0,00 |
|
|
a) From companies of the group: |
0,00 |
0,00 |
0,00 |
0,00 |
0,00 |
|
|
b) From associated companies: |
0,00 |
0,00 |
0,00 |
0,00 |
0,00 |
|
|
c) From companies out of the group: |
0,00 |
0,00 |
0,00 |
0,00 |
0,00 |
|
|
B.7. Miscellaneous interests or similar income: |
424.364,00 |
422.957,00 |
352.296,00 |
1.382.062,00 |
528.970,00 |
|
|
a) From companies of the group: |
372.922,00 |
397.076,00 |
283.181,00 |
499.805,00 |
0,00 |
|
|
b) From associated companies: |
0,00 |
0,00 |
0,00 |
0,00 |
0,00 |
|
|
c) Miscellaneous interests: |
37.981,00 |
25.882,00 |
69.114,00 |
82.525,00 |
528.970,00 |
|
|
d) Profit on financial investment: |
13.461,00 |
0,00 |
1,00 |
799.732,00 |
0,00 |
|
|
B.8. Exchange positive differences: |
54.908,00 |
0,00 |
0,00 |
0,00 |
0,00 |
|
|
B.II. NEGATIVE FINANCIAL RESULTS (A.7+A.8+A.9-B.5-B.6-B.7-B.8): |
809.746,00 |
0,00 |
118.129,00 |
0,00 |
1.232.520,00 |
|
|
B.III. LOSSES ON ORDINARY ACTIVITIES ( B.I + B.II - A.I - A.II ): |
3.520.410,00 |
0,00 |
0,00 |
1.829.492,00 |
1.730.732,00 |
|
|
B.9.Profit on disposal of both tangible and intangible fixed assets and securities portfolio: |
179.331,00 |
398.329,00 |
387.520,00 |
0,00 |
0,00 |
|
|
B.10. Profit on transactions with own shares and debentures: |
0,00 |
0,00 |
0,00 |
0,00 |
0,00 |
|
|
B.11. Capital grants transferred to profit and loss: |
66.505,00 |
58.399,00 |
40.285,00 |
156.588,00 |
143.177,00 |
|
|
B.12. Extraordinary income: |
0,00 |
0,00 |
0,00 |
0,00 |
0,00 |
|
|
B.13. Income and profit of former financial years: |
0,00 |
0,00 |
0,00 |
0,00 |
0,00 |
|
|
B.IV. NEGATIVE EXTRAORDINARY RESULTS (A.10+A.11+A.12+A.13+A.14-B.9-B.10-B.11-B.12-B.13): |
0,00 |
0,00 |
0,00 |
115.076,00 |
528.073,00 |
|
|
B.V. LOSSES BEFORE TAXES (B.III+B.IV-A.III-A.IV): |
3.283.505,00 |
0,00 |
0,00 |
1.944.568,00 |
2.258.805,00 |
|
|
B.VI. RESULT OF THE PERIOD (LOSSES) (B.V+A.15+A.16): |
2.306.621,00 |
0,00 |
0,00 |
1.944.568,00 |
2.258.805,00 |
|
CASHFLOW
STATEMENT
Model: Normal
> Source of information: Data contained in this section is taken from the information declared in the Annual Accounts submitted to the Trade Register.
|
|
2012 |
2011 |
2010 |
2009 |
2008 |
|
|
1. Fiscal year result before taxes.: 61100 |
-3.283.505,00 |
700.988,00 |
1.239.488,00 |
-1.944.568,00 |
-2.258.805,00 |
|
|
2. Results adjustments.: 61200 |
3.667.795,00 |
1.628.287,00 |
2.027.500,00 |
798.687,00 |
3.772.600,00 |
|
|
a) Fixed Assets Amortization (+).: 61201 |
1.502.269,00 |
1.582.084,00 |
1.671.049,00 |
1.653.654,00 |
2.061.783,00 |
|
|
b) Obsolescence Allowances (+/-). : 61202 |
1.089.296,00 |
-68.200,00 |
300.613,00 |
656.139,00 |
1.943.707,00 |
|
|
c) Variation in Provision (+/-). : 61203 |
96.960,00 |
0,00 |
0,00 |
0,00 |
0,00 |
|
|
d) Allocation of grants (-).: 61204 |
-69.535,00 |
69.828,00 |
70.334,00 |
-156.588,00 |
-143.177,00 |
|
|
e) Results on disposal of fixed assets (+/-). : 61205 |
1.105.990,00 |
0,00 |
0,00 |
-617.105,00 |
57.446,00 |
|
|
f) Results on disposal of financial instruments (+/-).: 61206 |
0,00 |
0,00 |
-7.004,00 |
0,00 |
0,00 |
|
|
g) Financial income (-).: 61207 |
-425.529,00 |
-422.957,00 |
-370.081,00 |
-619.279,00 |
-547.564,00 |
|
|
h) Financial Expenses (+). : 61208 |
313.435,00 |
323.813,00 |
145.016,00 |
64.493,00 |
142.787,00 |
|
|
i) Exchange differences (+/-). : 61209 |
54.908,00 |
143.719,00 |
217.572,00 |
0,00 |
0,00 |
|
|
j) Reasonable Value Variation in Financial Instruments (+/-).: 61210 |
0,00 |
0,00 |
0,00 |
-182.627,00 |
257.618,00 |
|
|
3. Changes in current capital equity.: 61300 |
-2.063.875,00 |
-2.622.449,00 |
-5.462.762,00 |
1.364.222,00 |
-5.634.341,00 |
|
|
a) Stock (+/-).: 61301 |
-1.264.739,00 |
-2.360.532,00 |
-6.249.171,00 |
-1.200.327,00 |
-1.829.185,00 |
|
|
d) Debtors and other accounts receivable (+/-). : 61302 |
-6.895.378,00 |
1.755.849,00 |
-1.741.691,00 |
-274.739,00 |
-1.125.715,00 |
|
|
c) Other current assets (+/-). : 61303 |
0,00 |
0,00 |
683.900,00 |
0,00 |
0,00 |
|
|
d) Creditors and other accounts payable (+/-). : 61304 |
6.093.213,00 |
-782.516,00 |
1.856.285,00 |
2.839.287,00 |
-2.679.440,00 |
|
|
f) Other non-current assets and liabilities (+/-).: 61306 |
3.030,00 |
-1.235.250,00 |
-12.086,00 |
0,00 |
0,00 |
|
|
4. Other cash flows for operating activities.: 61400 |
57.186,00 |
-98.228,00 |
7.493,00 |
237.608,00 |
122.725,00 |
|
|
a) Interest payments (-). : 61401 |
-313.435,00 |
-323.813,00 |
-162.802,00 |
118.134,00 |
-400.405,00 |
|
|
b) Dividend payment collection (+). : 61402 |
0,00 |
0,00 |
17.786,00 |
36.949,00 |
31.313,00 |
|
|
c) Interest collection (+). : 61403 |
425.529,00 |
422.957,00 |
370.081,00 |
82.525,00 |
516.251,00 |
|
|
d) Income tax payment collection (payments) (+/-).: 61404 |
0,00 |
-53.654,00 |
0,00 |
0,00 |
-24.433,00 |
|
|
e) Other payments (payment collection) (-/+) : 61405 |
-54.908,00 |
-143.719,00 |
-217.572,00 |
0,00 |
0,00 |
|
|
5. Operating activity cash flows (1 + 2 + 3 + 4) : 61500 |
-1.622.399,00 |
-391.403,00 |
-2.188.281,00 |
455.949,00 |
-3.997.820,00 |
|
|
6. Payments for investment (-).: 62100 |
-8.961.154,00 |
-693.341,00 |
-850.807,00 |
-2.138.153,00 |
-2.878.511,00 |
|
|
a) Companies of the group and affiliates. : 62101 |
0,00 |
0,00 |
0,00 |
-1.150.000,00 |
-286.045,00 |
|
|
b) Intangible fixed assets. : 62102 |
0,00 |
-51.192,00 |
-21.196,00 |
-11.366,00 |
-931,00 |
|
|
c) Fixed assets. : 62103 |
-1.022.825,00 |
-642.149,00 |
-1.358.402,00 |
-976.787,00 |
-2.591.535,00 |
|
|
d) Real estate investment. : 62104 |
-77.903,00 |
0,00 |
0,00 |
0,00 |
0,00 |
|
|
e) Other financial assets. : 62105 |
-7.860.426,00 |
0,00 |
528.792,00 |
0,00 |
0,00 |
|
|
7. Divestment payment collection (+). : 62200 |
9.303.435,00 |
21.196,00 |
-317.003,00 |
815.475,00 |
9.198.438,00 |
|
|
a) Companies of the group and affiliates. : 62201 |
9.123.131,00 |
0,00 |
-328.369,00 |
0,00 |
-16.703,00 |
|
|
b) Intangible fixed assets. : 62202 |
0,00 |
21.196,00 |
11.366,00 |
0,00 |
927,00 |
|
|
e) Other financial assets. : 62205 |
180.304,00 |
0,00 |
0,00 |
-176.655,00 |
-23.450,00 |
|
|
h) Other assets. : 62208 |
0,00 |
0,00 |
0,00 |
992.130,00 |
9.237.663,00 |
|
|
8. Investment activity cash flows (6 + 7) minus Amortization: 62300 |
342.281,00 |
-672.145,00 |
-1.167.810,00 |
-1.322.678,00 |
6.319.927,00 |
|
|
9. Payment collection and payments for equity instruments. : 63100 |
28.876,00 |
0,00 |
0,00 |
263.656,00 |
308.950,00 |
|
|
a) Issuance of equity instruments (+). : 63101 |
0,00 |
0,00 |
0,00 |
0,00 |
2.379.236,00 |
|
|
e) Grants, donations and bequests received (+). : 63105 |
28.876,00 |
0,00 |
0,00 |
263.656,00 |
308.950,00 |
|
|
10. Payment collection and payments for financial liabilities instruments.: 63200 |
740.427,00 |
438.172,00 |
4.324.363,00 |
1.322.749,00 |
-3.357.625,00 |
|
|
a) Issuance : 63201 |
2.612.719,00 |
1.825.822,00 |
5.697.554,00 |
2.796.258,00 |
1.758.841,00 |
|
|
2. Debts incurred with credit institutions (+). : 63203 |
2.612.719,00 |
1.825.822,00 |
5.463.746,00 |
2.748.342,00 |
6.963.750,00 |
|
|
3. Debts incurred with companies of the group and affiliates (+).: 63204 |
0,00 |
0,00 |
233.808,00 |
47.917,00 |
-5.204.909,00 |
|
|
b) Repayment and amortization of : 63207 |
-1.872.293,00 |
-1.387.651,00 |
-1.373.191,00 |
-1.473.509,00 |
-5.116.466,00 |
|
|
2. Debts incurred with credit institutions (-).: 63209 |
-1.872.293,00 |
-1.387.651,00 |
-1.373.191,00 |
-1.473.509,00 |
-5.116.466,00 |
|
|
11. Payments from dividends and remunerations from other assets instruments. : 63300 |
-100.000,00 |
-200.000,00 |
0,00 |
-670.732,00 |
-700.000,00 |
|
|
a) Dividends (-).: 63301 |
-100.000,00 |
-200.000,00 |
0,00 |
-670.732,00 |
-700.000,00 |
|
|
12. Cash flows for financing activities (9+10+11).: 63400 |
669.303,00 |
238.172,00 |
4.324.363,00 |
915.674,00 |
-3.748.675,00 |
|
|
D) EFECTO DE LAS VARIACIONES DE LOS TIPOS DE CAMBIO: 64000 |
0,00 |
0,00 |
0,00 |
0,00 |
0,00 |
|
|
E) NET INCREASE/DECREASE OF CASH OR EQUIVALENT ASSETS (+/-5+/-8+/12+/-D) : 65000 |
-610.816,00 |
-825.376,00 |
968.273,00 |
48.944,00 |
-1.426.569,00 |
|
|
Cash or equivalent assets as of beginning of the fiscal year.: 65100 |
990.424,00 |
1.815.800,00 |
847.527,00 |
798.583,00 |
2.225.152,00 |
|
|
Cash or equivalent assets as of end of the fiscal year.: 65200 |
379.608,00 |
990.424,00 |
1.815.800,00 |
847.527,00 |
798.583,00 |
|
FINANCIAL
DIAGNOSIS
> Economic-Financial Comparative Analysis
Data used in the following ratios and indicators is taken from the Annual Accounts submitted by the company to the TRADE REGISTER.
> Comparison within the Sector
|
Cash Flow |
2012 |
2011 |
Variación 2012 - 2011 |
|
|||
|
|
Empresa |
Sector |
Empresa |
Sector |
Empresa |
Sector |
|
|
Cash Flow over Sales: |
-0,01 % |
0,01 % |
-0,01 % |
0,00 % |
32,37 % |
|
|
|
EBITDA over Sales: |
-1,02 % |
9,61 % |
1,60 % |
10,07 % |
-164,19 % |
-4,54 % |
|
|
Cash Flow Yield: |
-0,01 % |
0,01 % |
-0,01 % |
0,00 % |
29,50 % |
|
|
|
Profitability |
2012 |
2011 |
Variación 2012 - 2011 |
|
|||
|
|
Empresa |
Sector |
Empresa |
Sector |
Empresa |
Sector |
|
|
Operating economic profitability: |
-3,02 % |
5,78 % |
0,80 % |
6,98 % |
-478,90 % |
-17,19 % |
|
|
Total economic profitability: |
-3,13 % |
2,77 % |
1,13 % |
4,18 % |
-376,07 % |
-33,75 % |
|
|
Financial profitability: |
-3,83 % |
1,86 % |
1,03 % |
5,88 % |
-470,55 % |
-68,36 % |
|
|
Margin: |
-2,08 % |
5,24 % |
0,55 % |
6,36 % |
-478,88 % |
-17,68 % |
|
|
Mark-up: |
-2,77 % |
2,01 % |
0,70 % |
4,74 % |
-492,76 % |
-57,54 % |
|
|
Solvency |
2012 |
2011 |
Variación 2012 - 2011 |
|
|||
|
|
Empresa |
Sector |
Empresa |
Sector |
Empresa |
Sector |
|
|
Liquidity: |
0,01 |
0,13 |
0,04 |
0,11 |
-70,88 |
19,68 |
|
|
Acid Test: |
1,26 |
0,88 |
1,21 |
0,83 |
4,53 |
6,01 |
|
|
Working Capital / Investment: |
0,47 |
0,04 |
0,44 |
0,03 |
6,67 |
45,10 |
|
|
Solvency: |
2,38 |
1,22 |
2,60 |
1,16 |
-8,13 |
5,23 |
|
|
Indebtedness |
2012 |
2011 |
Variación 2012 - 2011 |
|
|||
|
|
Empresa |
Sector |
Empresa |
Sector |
Empresa |
Sector |
|
|
Indebtedness level: |
0,56 |
1,56 |
0,43 |
1,65 |
30,68 |
-5,28 |
|
|
Borrowing Composition: |
0,05 |
1,13 |
0,10 |
1,04 |
-51,10 |
8,38 |
|
|
Repayment Ability: |
-56,06 |
116,52 |
-33,01 |
659,38 |
-69,81 |
-82,33 |
|
|
Warranty: |
2,77 |
1,65 |
3,32 |
1,62 |
-16,46 |
2,15 |
|
|
Generated resources / Total creditors: |
0,01 |
0,07 |
0,07 |
0,07 |
-92,45 |
1,50 |
|
|
Efficiency |
2012 |
2011 |
Variación 2012 - 2011 |
|
|||
|
|
Empresa |
Sector |
Empresa |
Sector |
Empresa |
Sector |
|
|
Productivity: |
0,89 |
1,76 |
1,16 |
1,75 |
-23,84 |
0,44 |
|
|
Turnover of Collection Rights : |
3,60 |
4,88 |
3,99 |
4,49 |
-9,64 |
8,78 |
|
|
Turnover of Payment Entitlements: |
5,15 |
3,53 |
6,44 |
3,27 |
-20,14 |
7,97 |
|
|
Stock rotation: |
3,38 |
6,87 |
3,13 |
6,09 |
7,99 |
12,82 |
|
|
Assets turnover: |
1,45 |
1,10 |
1,45 |
1,10 |
0,01 |
0,59 |
|
|
Borrowing Cost: |
0,92 |
3,06 |
1,19 |
2,93 |
-22,98 |
4,60 |
|
> Trend of indicators under the General Accounting Plan of 2007 (2012, 2011, 2010, 2009, 2008)
|
Cash Flow |
2012 |
2011 |
2010 |
2009 |
2008 |
|
|
Cash Flow over Sales: |
-0,01 % |
-0,01 % |
1,03 % |
0,06 % |
-1,95 % |
|
|
EBITDA over Sales: |
-1,02 % |
1,60 % |
2,77 % |
-0,82 % |
2,14 % |
|
|
Cash Flow Yield: |
-0,01 % |
-0,01 % |
1,07 % |
0,06 % |
-1,76 % |
|
|
Profitability |
2012 |
2011 |
2010 |
2009 |
2008 |
|
|
Operating economic profitability: |
-3,02 % |
0,80 % |
1,78 % |
-3,25 % |
-0,53 % |
|
|
Total economic profitability: |
-3,13 % |
1,13 % |
1,55 % |
-2,28 % |
-2,61 % |
|
|
Financial profitability: |
-3,83 % |
1,03 % |
1,99 % |
-3,19 % |
-3,55 % |
|
|
Margin: |
-2,08 % |
0,55 % |
1,44 % |
-2,87 % |
-0,48 % |
|
|
Mark-up: |
-2,77 % |
0,70 % |
1,31 % |
-2,55 % |
-2,59 % |
|
|
Solvency |
2012 |
2011 |
2010 |
2009 |
2008 |
|
|
Liquidity: |
0,01 |
0,04 |
0,08 |
0,05 |
0,06 |
|
|
Acid Test: |
1,26 |
1,21 |
1,35 |
1,65 |
2,71 |
|
|
Working Capital / Investment: |
0,47 |
0,44 |
0,45 |
0,46 |
0,60 |
|
|
Solvency: |
2,38 |
2,60 |
2,69 |
3,07 |
4,49 |
|
|
Indebtedness |
2012 |
2011 |
2010 |
2009 |
2008 |
|
|
Indebtedness level: |
0,56 |
0,43 |
0,44 |
0,35 |
0,27 |
|
|
Borrowing Composition: |
0,05 |
0,10 |
0,16 |
0,16 |
0,24 |
|
|
Repayment Ability: |
-56,06 |
-33,01 |
8,47 |
-18,49 |
2,97 |
|
|
Warranty: |
2,77 |
3,32 |
3,27 |
3,90 |
4,74 |
|
|
Generated resources / Total creditors: |
0,01 |
0,07 |
0,11 |
-0,01 |
0,11 |
|
|
Efficiency |
2012 |
2011 |
2010 |
2009 |
2008 |
|
|
Productivity: |
0,89 |
1,16 |
1,25 |
0,94 |
1,14 |
|
|
Turnover of Collection Rights : |
3,60 |
3,99 |
3,23 |
2,78 |
2,70 |
|
|
Turnover of Payment Entitlements: |
5,15 |
6,44 |
5,50 |
4,78 |
5,71 |
|
|
Stock rotation: |
3,38 |
3,13 |
2,90 |
3,03 |
3,00 |
|
|
Assets turnover: |
1,45 |
1,45 |
1,24 |
1,13 |
1,11 |
|
|
Borrowing Cost: |
0,92 |
1,19 |
0,59 |
0,30 |
0,83 |
|
COMPARATIVE SECTORIAL BALANCE
Sector-based Comparison under the rules of the New General Accounting Plan.
|
|
Variación - |
|
|
|
Empresa |
Sector |
|
|
Variación - |
|
|
|
Empresa |
Sector |
|
|
Variación - |
|
|
|
Empresa |
Sector |
|
|
|
El Diario Montañés |
16/01/2013 |
|
La empresa Textil Santanderina tendrá que pagar 600.000 euros por el 'céntimo verde' este año |
|
|
Companies related |
|
|
|
|
|
ABC |
16/01/2013 |
|
El Gobierno apoya la innovación en Textil Santanderina con más de 220.000 ? |
|
|
Companies related |
|
|
|
|
|
|
|
|
|
|
|
|
|
Organisation that calls the tender: |
|
DIRECCION DE ABASTECIMIENTO Y TRANSPORTES DE LA ARMADA |
|
Objective of Tender: |
|
ADQUISICION DE TEJIDO BLANCO |
|
Date Awarded: |
|
13/04/2005 |
|
Cost: |
|
230.000,00 EURO. |
|
|
|
Organisation that calls the tender: |
|
DIRECCION DE ABASTECIMIENTO Y TRANSPORTES DE LA ARMADA |
|
Objective of Tender: |
|
ADQUISICION DE TEJIDO CAMPAÑA DESIERTO |
|
Date Awarded: |
|
31/08/2004 |
|
Cost: |
|
132.000,00 EURO. |
|
|
|
Organisation that calls the tender: |
|
MINISTERIO DE DEFENSA |
|
Objective of Tender: |
|
LOTE 1: TEJIDOS VICUÑA LANA-POLIESTER LOTE 2: TEJIDO CAMPAÑA PARA DESIERTO. |
|
Date Awarded: |
|
17/02/2003 |
|
Cost: |
|
72.841,86 EURO. |
|
Organisation that calls the tender: |
|
DIRECCION DE APROVISIONAMIENTO Y TRANSPORTES DE LA ARMADA |
|
Objective of Tender: |
|
SUMINISTRO DE TEJIDO DE VICUÑA LANA-POLIESTER Y TEJIDO DE CAMPAÑA PARA DESIERTO |
|
Date Awarded: |
|
17/02/2003 |
|
Cost: |
|
84.496,58 EURO. |
|
|
|
Organisation that calls the tender: |
|
MINISTERIO DE DEFENSA |
|
Objective of Tender: |
|
TEJIDO SARGA AZUL IGNIFUGO, TEJIDO BLANCO ALGODON-POLIESTER, TEJIDO VICUÑA AUSTRALIA Y TEJIDO DE CAMPAÑA PARA DESIERTO |
|
Date Awarded: |
|
22/03/2002 |
|
Cost: |
|
VER IMAGEN |
|
|
|
Organisation that calls the tender: |
|
DIRECCION DE APROVISIONAMIENTO Y TRANSPORTES DE LA ARMADA |
|
Objective of Tender: |
|
SUMINISTRO DE TEJIDOS. |
|
Date Awarded: |
|
22/03/2002 |
|
Cost: |
|
LOTE 1, 300.248,64 EUROS; LOTE 2, 120.201,77 EUROS; LOTE 4, 117.192,04 EUROS |
|
|
|
Organisation that calls the tender: |
|
CUARTEL GENERAL DEL EJERCITO |
|
Objective of Tender: |
|
ADQUISICION DE TEJIDO PARA UNIFORME DE CAMPAÑA DE VERANO |
|
Date Awarded: |
|
22/06/2001 |
|
Cost: |
|
12.759.043 PTS. |
Detail of Subsidies appearing in Balances Memories
|
Entity |
ORGANISMO NO ESPECIFICADO |
|
Status |
CONCEDIDA |
|
Project |
Proyecto IRIS e IER para inversión en bienes de equipo. |
|
Amount Granted |
1.154.987,37 |
|
Entity |
ORGANISMO NO ESPECIFICADO |
|
Status |
CONCEDIDA |
|
Project |
Proyecto IRIS e IER para inversión en bienes de equipo. |
|
Amount Granted |
847.727,58 |
|
Entity |
ORGANISMO NO ESPECIFICADO |
|
Status |
CONCEDIDA |
|
Project |
Proyecto IER para inversión en bienes de equipo. |
|
Amount Granted |
827.130,89 |
|
Notes |
Subvención del 2002. |
|
Entity |
ORGANISMO NO ESPECIFICADO |
|
Status |
CONCEDIDA |
|
Project |
Proyecto IRIS para inversión en bienes de equipo. |
|
Amount Granted |
123.018,26 |
|
Notes |
Subvención del 2008. |
|
Entity |
ORGANISMO NO ESPECIFICADO |
|
Status |
CONCEDIDA |
|
Project |
Proyecto IRIS para inversión en bienes de equipo. |
|
Amount Granted |
114.662,16 |
|
Notes |
Subvención del 2009. |
|
Entity |
ORGANISMO NO ESPECIFICADO |
|
Status |
CONCEDIDA |
|
Project |
Inversión Industrial Gobierno de Cantabria. |
|
Amount Granted |
113.874,16 |
|
Notes |
Subvención del 2011. |
|
Entity |
ORGANISMO NO ESPECIFICADO |
|
Status |
CONCEDIDA |
|
Project |
Inversión Industrial Gobierno de Cantabria. |
|
Amount Granted |
28.876,00 |
|
Notes |
Subvención del 2012. |
|
Entity |
ORGANISMO NO ESPECIFICADO |
|
Status |
CONCEDIDA |
|
Project |
Proyecto GENERCAN para inversión en bienes de equipo. |
|
Amount Granted |
17.114,24 |
|
Notes |
Subvención del 2008. |
|
Entity |
ORGANISMO NO ESPECIFICADO |
|
Status |
CONCEDIDA |
|
Amount Granted |
717.307,95 |
|
Notes |
Subvención concedida en el 2003. |
|
Entity |
ORGANISMO NO ESPECIFICADO |
|
Status |
CONCEDIDA |
|
Amount Granted |
199.224,27 |
|
Notes |
Subvención concedida en el 2005. |
|
Entity |
ORGANISMO NO ESPECIFICADO |
|
Status |
CONCEDIDA |
|
Amount Granted |
84.898,38 |
|
Notes |
Subvención concedida en el 2006. |
|
Entity |
MINISTERIO DE ECONOMIA |
|
Subsidy Concept |
Subvención de capital. |
|
Status |
CONCEDIDA |
|
Amount Granted |
870.864,72 |
|
Notes |
Subvención de incentivos para la renovación de la Inudstria y de los Servicios (Iris). |
|
Entity |
MINISTERIO DE ECONOMINA Y HACIENDA |
|
Subsidy Concept |
Subvención de capital. |
|
Status |
CONCEDIDA |
|
Project |
"Iris". |
|
Amount Granted |
827.130,89 |
|
Notes |
Subvención recibida en el ejercicio 2002. |
|
Entity |
ORGANISMO NO ESPECIFICADO |
|
Subsidy Concept |
Subvención de capital. |
|
Status |
CONCEDIDA |
|
Project |
"Iris". |
|
Amount Granted |
717.307,95 |
|
Notes |
Subvención recibida en el ejercicio 2003. |
|
Entity |
GOBIERNO DE CANTABRIA |
|
Subsidy Concept |
Subvención de capital. |
|
Status |
CONCEDIDA |
|
Amount Granted |
687.680,75 |
|
Notes |
Subvención correspondiente a los derechos de emisión de gases. |
|
Entity |
GOBIERNO DE CANTABRIA |
|
Subsidy Concept |
Subvención de capital. |
|
Status |
CONCEDIDA |
|
Amount Granted |
199.224,27 |
|
Notes |
Subvención de incentivos para la renovación de la Industria y de los Servicios (Iris). |
|
Entity |
MINISTERIO DE ECONOMIA |
|
Subsidy Concept |
Subvención de capital. |
|
Status |
CONCEDIDA |
|
Amount Granted |
180.805,95 |
|
Notes |
Subvención correspondiente a los derechos de emisión de gases. |
|
Entity |
GOBIERNO DE CANTABRIA |
|
Subsidy Concept |
Subvención de capital. |
|
Status |
CONCEDIDA |
|
Amount Granted |
130.419,63 |
|
Notes |
Subvención para ayudas a empresas en el marco del Plan Ambiental Industrial. |
|
Entity |
GOBIERNO DE CANTABRIA |
|
Subsidy Concept |
Subvención de capital. |
|
Status |
CONCEDIDA |
|
Amount Granted |
84.898,38 |
|
Notes |
Subvención recibida en el ejercicio 2006. |
|
Research Summary |
|
The subject was founded in 1960 and it is engaged in manufacturing of home textiles. |
|
Sources |
|
Registry of Commerce's Official Gazette. Own and external data bases Company References |
FOREIGN EXCHANGE RATES
|
Currency |
Unit
|
Indian Rupees |
|
US Dollar |
1 |
Rs.62.28 |
|
|
1 |
Rs.103.84 |
|
Euro |
1 |
Rs.85.70 |
INFORMATION DETAILS
|
Report Prepared
by : |
NIS |
RATING EXPLANATIONS
|
RATING |
STATUS |
PROPOSED CREDIT LINE |
|
|
>86 |
Aaa |
Possesses an extremely sound financial base with the strongest capability
for timely payment of interest and principal sums |
Unlimited |
|
71-85 |
Aa |
Possesses adequate working capital. No caution needed for credit
transaction. It has above average (strong) capability for payment of interest
and principal sums |
Large |
|
56-70 |
A |
Financial & operational base are regarded healthy. General
unfavourable factors will not cause fatal effect. Satisfactory capability for
payment of interest and principal sums |
Fairly Large |
|
41-55 |
Ba |
Overall operation is considered normal. Capable to meet normal
commitments. |
Satisfactory |
|
26-40 |
B |
Capability to overcome financial difficulties seems comparatively
below average. |
Small |
|
11-25 |
Ca |
Adverse factors are apparent. Repayment of interest and principal sums
in default or expected to be in default upon maturity |
Limited with
full security |
|
<10 |
C |
Absolute credit risk exists. Caution needed to be exercised |
Credit not
recommended |
|
-- |
NB |
New Business |
-- |
This score serves as a reference to assess
SC’s credit risk and to set the amount of credit to be extended. It is
calculated from a composite of weighted scores obtained from each of the major sections
of this report. The assessed factors and their relative weights (as indicated
through %) are as follows:
Financial
condition (40%) Ownership
background (20%) Payment
record (10%)
Credit history
(10%) Market trend (10%) Operational size
(10%)
This report is issued at your request without any
risk and responsibility on the part of MIRA INFORM PRIVATE LIMITED (MIPL)
or its officials.