MIRA
INFORM REPORT
|
Report Date : |
27.02.2014 |
IDENTIFICATION DETAILS
|
Name : |
A. J. PLAST
PUBLIC COMPANY LIMITED |
|
|
|
|
Registered Office : |
|
|
|
|
|
Country : |
|
|
|
|
|
Financials (as on) : |
31.12.2012 |
|
|
|
|
Date of Incorporation : |
25.03.1987 |
|
|
|
|
Com. Reg. No.: |
0107537001285 |
|
|
|
|
Legal Form : |
Public Limited Company |
|
|
|
|
Line of Business : |
Subject is engaged in
manufacturing various types of
film products, consists of
BOPP [Biaxially Oriented
Polypropylene] film, BOPET [Biaxially Oriented
Polyester] film, BOPA [Oriented Polyamide] film, as well as MPP
[Metallized Biaxially Oriented
Polypropylene] film, MPT [Metallized
Biaxially Oriented Polyester]
film and MPA [Metallized Oriented
Polyamide] film for
various types of
packaging and other
industries |
|
|
|
|
No. of Employees : |
610 |
RATING & COMMENTS
|
MIRA’s Rating : |
B |
|
RATING |
STATUS |
PROPOSED CREDIT LINE |
|
|
26-40 |
B |
Capability to overcome financial difficulties seems comparatively
below average. |
Small |
|
Status : |
Moderate |
|
Payment Behaviour : |
No complaints |
|
Litigation : |
Clear |
NOTES :
Any query related to this report can be made
on e-mail : infodept@mirainform.com
while quoting report number, name and date.
ECGC Country Risk Classification List – September 30, 2013
|
Country Name |
Previous Rating (30.06.2013) |
Current Rating (30.09.2013) |
|
|
B1 |
B1 |
|
Risk Category |
ECGC
Classification |
|
Insignificant |
A1 |
|
Low |
A2 |
|
Moderate |
B1 |
|
High |
B2 |
|
Very High |
C1 |
|
Restricted |
C2 |
|
Off-credit |
D |
With a well-developed infrastructure, a free-enterprise
economy, generally pro-investment policies, and strong export industries,
|
Source
: CIA |
Company name
A. J. PLAST PUBLIC COMPANY LIMITED
SUMMARY
BUSINESS ADDRESS :
BANGKHUNTHIEN,
TELEPHONE : [66]
2415-0035
FAX
:
[66] 2415-3795
E-MAIL
ADDRESS : export@ajplast.co.th
REGISTRATION
ADDRESS : SAME
AS BUSINESS ADDRESS
ESTABLISHED : 1987
REGISTRATION
NO. : 0107537001285 [BOR
MOR JOR. 375]
TAX
ID NO. : 3101436198
CAPITAL
REGISTERED : BHT.
399,444,945
CAPITAL
PAID-UP : BHT.
399,439,227
FISCAL
YEAR CLOSING DATE : DECEMBER 31
LEGAL
STATUS : PUBLIC LIMITED
COMPANY
EXECUTIVE : MR.
NARONG SUTHISAMPHAT, THAI
MANAGING DIRECTOR
NO.
OF STAFF : 610
LINES
OF BUSINESS : BOPP
FILM AND RELATED
PRODUCTS
MANUFACTURER, DISTRIBUTOR &
EXPORTER
CORPORATE PROFILE
OPERATING
TREND : STABLE
PRESENT
SITUATION : OPERATING
NORMALLY
REPUTATION : GOOD
FOR
MANAGEMENT
STANDARD : MANAGEMENT
WITH FAIR PERFORMANCE
HISTORY
The subject was
established on March
25, 1987 as
a private limited
company under the
registered name A. J.
PLAST CO., LTD.,
by Thai group,
Suthisamphat family, with the
purpose of manufacturing
BOPP film and
related products for
packaging industries with
the promotional privilege
granted by the
Board of Investment,
Thailand.
On December 7,
1999, the subject
was listed on
the Stock Exchange
of Thailand and
converted its status
to a public
limited company under
the name style
A. J. PLAST PUBLIC
COMPANY LIMITED on
May 3, 1994.
It currently employs
610 staff.
The subject
received the ISO
9001:2000, ISO 9001 : 2008
Certification for Quality
Management System of the
products.
The subject’s registered
address was 19/111
Moo 7, Thakarm
Rd., Samaedam, Bangkhunthien, Bangkok
10150.
In 2011,
its registered address
was changed from “19/111 Moo 7”
to
“95” by the
Government district office,
actually both are
the same location.
This is also
the subject’s current operation
address.
THE BOARD
OF DIRECTOR
|
Name |
|
Nationality
|
Age
|
|
|
|
|
|
|
Mr. Narong Suthisamphat |
: [x] Chairman |
Thai |
72 |
|
Mr. Supote Tonurat |
|
Thai |
78 |
|
Mr. Ninnat Olanvoravuth |
|
Thai |
68 |
|
Mr. Thien Ratitamkul |
|
Thai |
74 |
|
Mrs. Napaporn Suthipongchai |
: [x] Vice
Chairman |
Thai |
70 |
|
Mr. Kittiphat Suthisamphat |
: [x] Vice
Chairman |
Thai |
43 |
|
Mrs. Chavida Srisangnam |
|
Thai |
70 |
|
Mr. Surasak Kosiyachinda |
|
Thai |
71 |
AUTHORIZED PERSON
One of the
above directors [x]
can sign or
any two of
the rest directors
can jointly sign
on behalf of
the subject with
the company’s affixed.
MANAGEMENT
Mr.
Narong Suthisamphat is
the Managing Director.
He is
Thai nationality with
the age of
72 years old.
Mr. Thosapol Jinandech
is the Deputy
Managing Director.
He is
Thai nationality.
Dr. Vorawis Veerakachane is
the Assistant Managing
Director.
He is
Thai nationality.
Mr. Pongnetr Muntukanon
is the Marketing
Manager.
He is
Thai nationality with
the age of
76 years old.
He has been
worked on this
position since 1989.
Mr. Boonyarith Liketcharoen is
the Finance &
Account Manager.
He is
Thai nationality.
Ms. Varaporn Posakabutr is
the Purchasing Manager.
She is Thai
nationality.
Mr. Peter Barnes
is the General
Manager [Metallized].
He is
Taiwanese nationality with
the age of
65 years old.
He has been
worked on this
position since 2000.
Mr. Alano Lopez
Matias is the
General Manager [BOPP].
He is American
nationality.
Mr. Rajeev Parashar is the
General Manager [BOPET].
He is
Thai nationality with
the age of
76 years old.
He has been
working in this
position since 1989.
Mr. Fritz Friedrich
Schanzer is the
Advisor of General
Manager.
He is American
nationality.
Mr. Pradit Boonkanpai
is the Computer
Manager.
He is
Thai nationality with
the age of
60 years old.
He has started
worked on this
position since 1999.
Mr. Sophon Maneerat
is the Personnel
and Administration Manager.
He is
Thai nationality with
the age of
55 years old.
He has started
worked on this
position since 1994.
Ms. Patcharaporn Suebsantiwong is
the Planning Manager.
She is
Thai nationality.
BUSINESS OPERATIONS
The subject is engaged in
manufacturing various types of
film products, consists of
BOPP [Biaxially Oriented
Polypropylene] film, BOPET [Biaxially Oriented
Polyester] film, BOPA [Oriented Polyamide] film, as well as MPP
[Metallized Biaxially Oriented Polypropylene]
film, MPT [Metallized Biaxially Oriented
Polyester] film and
MPA [Metallized Oriented Polyamide]
film for various
types of packaging
and other industries.
TOTAL PRODUCTION CAPACITY
163,800 tons per
annum
The products and
application used are as follows:
- BOPP Film :
BOPP
cigarette wrapping, BOPP
Co-ex printing & lamination, BOPP
Co-ex film one
side heat seal,
BOPP-Co-ex matt, BOPP
pearlized film, BOPP
opaque white film,
BOPP plain printing * lamination, BOPP
for paper lamination,
BOPP plain brown
film, BOPP plain
adhesive tape and etc.
Application Used :
Printing
and lamination, adhesive
tape, side seal
bag, flower wraps
and
flower
sheet and paper
lamination
- BOPET Film :
BOPET
hot stamping polyester
film, BOPET high
haze polyester film,
BOPET pancake polyester
film, BOPET plain
polyester film, BOPET
plain polyester isotropic
film, BOPET ultra
clear BOPET film,
BOPET plain polyester
film for lamination
and candy wrapping,
BOPET metallic yarn
film and etc.
Application
Used :
used for
printing and lamination
from high speed
wrapping machine, cable
and electrical
application and hot stamping
- Metallized Film :
M-BOPP
Co-ex metallized polypropylene
film, M-BOPET metallized
pancake film, M-BOPET
metallized polyester film,
M-BOPET metallized isotropic
polyester film, M-BOPET
metallized polyester film
for candy and
paper lamination, M-BOPET
metallizes polyester yarn
film and etc.
Application Used :
used
for barrier film
for snack food
and confectionery in
printing and
lamination
- BOPA Film :
Nylon
and nylon polyamide
base film for
metallizing
Application Used :
used for
retort foods, packaging
for frozen foods and
liquid foods, precooked
foods, ham
and sausage, jam
and preserves, rice
pack, vegetable pack,
seasoning and
metallized balloons
PRODUCTION CAPACITY [in
2013]
BOPP film 3
lines : 104,000 tons
per year
BOPET film 2 lines : 31,000
tons per year
Metalized Film 2
lines : 10,800
tons per year
BOPA 2 lines : 18,000
tons per year
BRAND NAME
“AJ PLAST” and
etc.
PURCHASE
80% of the raw
materials such as
polypropylene, polyester and
other chemicals are
purchased from local
suppliers, the remaining
20% such as
specialized and special
chemicals are imported
from United States
of America, Japan,
Republic of China,
Germany, Singapore and
Hong Kong.
MAJOR SUPPLIERS
HMC
Polymer Co., Ltd. :
Indo Poly [
IRPC Public Company
Limited :
SALES
56% of the
products is exported to
manufacturers and agents in
Singapore, Hong Kong, Taiwan,
Japan, Malaysia, Indonesia,
Vietnam, Philippines, Australia,
India, Switzerland and
Italy, the remaining
44% is sold
locally.
Revenue Structure:
|
Products |
2011 |
2012 |
||
|
|
Thousand Baht |
% |
Thousand Baht |
% |
|
Local |
|
|
|
|
|
- BOPP film |
1,366,516 |
21.00 |
1,279,973 |
24.86 |
|
- BOPET film |
789,547 |
12.13 |
491,402 |
9.54 |
|
- Metallized film |
217,245 |
3.33 |
159,297 |
3.09 |
|
- BOPA [Nylon] film |
247,232 |
3.80 |
307,850 |
5.98 |
|
Total |
2,620,540 |
40.26 |
2,238,522 |
43.47 |
|
Overseas |
|
|
|
|
|
- BOPP film |
1,836,043 |
28.21 |
1,698,225 |
32.98 |
|
- BOPET film |
1,232,950 |
18.94 |
469,357 |
9.12 |
|
- Metallized film |
260,437 |
4.01 |
165,711 |
3.22 |
|
- BOPA [Nylon] film |
558,720 |
8.58 |
576,976 |
11.21 |
|
Total |
3,888,150 |
59.74 |
2,910,269 |
56.53 |
|
Total Revenue |
6,508,690 |
100.00 |
5,148,791 |
100.00 |
MAJOR CUSTOMERS
The subject’s major
customers are as
follows:
- Printing house,
side seal packaging
factory for consumer,
food & confectionery
industries.
- Adhesive Tape
Factory
- Electronic
Industry
SUBSIDIARIES & AFFILIATED
COMPANY
The subject is
not found to have
any subsidiaries or
affiliated companies here
in Thailand.
LITIGATION
Bankruptcy and Receivership
There are no
litigation on bankruptcy
and receivership cases
filed against the
subject found at
Legal Execution Department
for the past
five years.
Others
There are no
legal suits filed
against the for
the past two
years.
CREDIT
Sales are by
cash or on
the credit terms
of 30-60 days.
Local bills are paid by
cash or on
the credits term
of 30-60 days.
Imports are by
L/C at sight
or T/T.
Exports are against
T/T.
BANKING
Bangkok Bank Public
Co., Ltd.
[Head Office
:
[Plabplachai Branch
:
Kasikornbank Public Co., Ltd.
[Head Office
:
[Plabplachai Branch
:
The Siam Commercial
Bank Public Co.,
Ltd.
[Charoennakorn Branch
:
EMPLOYMENT
The subject currently
employs 610 staff
[office, sales staff
and factory workers].
LOCATION DETAILS
The premise is
owned for administrative office
at the heading
address. The premise
is located in
an industrial area.
Factory and warehouse are located
at 38/11 Moo
5, Laemchabang Industrial
Estate, Tungsukhla, Sriracha, Chonburi
20230.
Tel.: [66] 38
490-330-5 Fax :
[66] 38 490-337.
COMMENT
The
company was formed
in 1987 as
a manufacturer of
Bopp Film and
related products. Its
products are for
industrial users. The
company has ensured
a continuous growth
and stability in
its operation. It
has acquired a
strong support from
the government as
well as trust
from both domestic
and overseas customers,
which allows the company
to be highly successful
in high efficiency
and standard manufacturing
and to be able to
expand the market
globally.
However,
in 2012 overall
domestic industry seems
to slowdown from
economic uncertainty, shrinking
consumption and decline purchasing
power. This caused
to decrease demand
of BOPP film
products.
FINANCIAL INFORMATION
The capital was
initially registered at
Bht. 1,000,000 divided
into 10,000 shares
of Bht. 100
each.
The capital was
increased later as
follows:
Bht.
40,000,000 on January
29, 1988
Bht.
80,000,000 on December
28, 1989
Bht.
120,000,000 on November
1, 1990
Bht.
300,000,000 on July
28, 1991
Bht.
600,000,000 in 1995
The latest registered
capital was decreased
to Bht. 399,444,945 divided
into 399,444,945 shares
of Bht. 1
each, with the
current capital paid-up
at Bht. 399,439,227.
MAIN SHAREHOLDERS : [as at
May 7, 2013]
at Bht. 399,439,227
of
capitalization.
|
NAME |
HOLDING |
% |
|
|
|
|
|
Mr. Narong Suthisamphat |
76,295,555 |
19.10 |
|
Mr. Kittiphat Suthisamphat |
55,737,842 |
13.95 |
|
Mrs. Suleemas Suthisamphat |
52,622,222 |
13.17 |
|
Ms. Ajala Suthisamphat |
27,776,800 |
6.95 |
|
Mrs. Nongnipa Suthisamphat |
5,600,000 |
1.40 |
|
Mrs. Prinya Khancharoensuk |
4,745,444 |
1.19 |
|
Thai NVDR Co.,
Ltd. |
3,254,212 |
0.81 |
|
Mr. Chanyuth Chatpiriyaphan |
3,250,000 |
0.81 |
|
Mr. Somkiat Terdtooltaweedej |
2,700,000 |
0.68 |
|
Others |
167,457,152 |
41.94 |
Total Shareholders :
6,673
NAME OF AUDITOR
& CERTIFIED PUBLIC
ACCOUNTANT NO. :
Dr. Virach Aphimeteetamrong No. 1378
BALANCE SHEET [BAHT]
The
latest financial figures
published for December
31, 2012, 2011
& 2010 were:
ASSETS
|
Current Assets |
2012 |
2011 |
2010 |
|
|
|
|
|
|
Cash & Cash
Equivalents |
2,375,061 |
1,188,778 |
11,127,156 |
|
Trade & Other Receivables |
664,439,902 |
709,862,164 |
980,668,225 |
|
Inventories |
862,609,162 |
864,589,134 |
759,052,497 |
|
Other Current Assets
Refundable Value
Added Tax |
50,120,868 |
28,646,164 |
30,893,622 |
|
Prepaid Spare
Parts |
37,135 |
1,188,619 |
2,045,386 |
|
Selling &
Buying Forward Exchange
Contracts |
31,743,652 |
- |
33,142,037 |
|
Assets under Buying Forward
Exchange Contracts |
365,459 |
1,875,410 |
- |
|
Prepaid Commission from Machinery
Disposal |
- |
2,660,529 |
- |
|
Others |
467 |
8,975 |
3,091 |
|
Total Other Current Assets |
82,267,581 |
34,379,697 |
66,084,136 |
|
Total Current Assets
|
1,611,691,706 |
1,610,019,773 |
1,816,932,014 |
|
Investments in Related
Party |
23,952,000 |
23,952,000 |
23,952,000 |
|
Property, Plant &
Equipment |
4,307,664,215 |
4,139,288,896 |
3,495,429,117 |
|
Intangible Assets -
Deferred Computer Software |
593,500 |
979,956 |
1,217,589 |
|
Other Assets Prepaid Machineries & Accessories |
145,670,261 |
211,586,633 |
155,619,727 |
|
Guarantee for Leasing
Assets |
7,057,204 |
7,057,204 |
2,927,576 |
|
Accounts Receivable - Customs Department |
9,225,964 |
12,644,909 |
14,889,887 |
|
Others |
1,942,575 |
2,091,674 |
638,530 |
|
Total Non-current
Assets |
163,896,004 |
233,380,420 |
5,511,606,440 |
|
Total Assets |
6,107,797,425 |
6,007,621,045 |
5,511,606,440 |
LIABILITIES & SHAREHOLDERS' EQUITY [BAHT]
|
Current
Liabilities |
2012 |
2011 |
2010 |
|
|
|
|
|
|
Bank Overdraft &
Short-term Loan from Financial Institutions |
1,059,548,779 |
1,145,955,952 |
1,252,056,771 |
|
Trade & Other
Payable |
1,051,955,902 |
1,164,457,798 |
1,022,208,952 |
|
Current Portion of Long-term
Liabilities Liabilities under
Long-term Leases |
14,882,051 |
30,986,138 |
86,415,992 |
|
Long-term Loans |
- |
- |
308,352,000 |
|
Current Portion of Deferred Surplus on |
171,786 |
1,091,882 |
23,397,645 |
|
Acquisition Payable |
163,512,375 |
31,315,581 |
40,312,341 |
|
Accrued Interest |
394,998 |
229,483 |
452,981 |
|
Other Current Liabilities Advance received
for Machineries Disposals |
- |
169,887,264 |
- |
|
Selling &
Buying Forward Exchange Contracts |
- |
5,552,611 |
- |
|
Commitment from Purchasing of Machinery |
365,459 |
1,875,410 |
- |
|
Others |
3,261,151 |
3,707,083 |
3,001,288 |
|
|
|
|
|
|
Total Current Liabilities |
2,294,092,501 |
2,555,059,202 |
2,736,197,970 |
|
Liabilities under
Long-term Leases- Net |
3,771,316 |
16,996,078 |
46,633,691 |
|
Long-term Loans - Net |
221,120,000 |
- |
502,072,438 |
|
Deferred Surplus on Sale &
Lease Back - Net |
- |
171,786 |
1,263,668 |
|
Provision for Long-term Employee Benefits |
30,565,809 |
27,216,308 |
- |
|
Total Liabilities |
2,549,549,626 |
2,599,443,374 |
3,286,167,767 |
|
Shareholders' Equity |
2012 |
2011 |
2010 |
|
|
|
|
|
|
Share capital : Baht 1
par value Authorized &
issued share capital
399,444,945 shares
in 2012 & 2011; 600,000,000 shares
in 2010 respectively |
399,444,945 |
399,444,945 |
600,000,000 |
|
|
|
|
|
|
Capital Paid |
399,439,227 |
399,439,227 |
359,500,450 |
|
Premium on Share
Capital |
876,616,300 |
876,616,300 |
- |
|
Retained Earning Appropriated for
Legal Reserve |
60,000,000 |
60,000,000 |
60,000,000 |
|
Unappropriated |
2,222,192,272 |
2,072,122,144 |
1,631,553,083 |
|
Other Components of
Equity |
- |
- |
174,385,140 |
|
Total Shareholders' Equity |
3,558,247,799 |
3,408,177,671 |
2,225,438,673 |
|
Total Liabilities &
Shareholders' Equity |
6,107,797,425 |
6,007,621,045 |
5,511,606,440 |
PROFIT & LOSS ACCOUNT
|
Revenue |
2012 |
2011 |
2010 |
|
|
|
|
|
|
Sales |
5,148,791,323 |
6,508,690,341 |
5,996,402,810 |
|
Other Income Scrap Sales
|
10,222,266 |
8,487,824 |
35,440,133 |
|
Gain on
Exchange Rates |
82,995,895 |
- |
126,366,610 |
|
Gain on
Assets Held for Disposal |
- |
- |
37,635,263 |
|
Gain on Fixed
Assets Disposal |
- |
74,765 |
- |
|
Tax Cards
Income |
19,066,323 |
26,154,201 |
34,655,090 |
|
Others |
25,517,404 |
30,299,705 |
18,723,450 |
|
Total Revenues |
5,286,593,211 |
6,573,706,836 |
6,249,223,356 |
|
Expenses |
|
|
|
|
|
|
|
|
|
Cost of Sales
|
4,733,501,943 |
5,325,239,197 |
4,862,271,871 |
|
Selling Expenses |
147,589,329 |
162,558,918 |
167,969,729 |
|
Administrative Expenses |
162,330,245 |
160,324,219 |
152,862,814 |
|
Loss on Exchange
Rate |
- |
11,860,465 |
- |
|
Loss on Fixed
Assets Disposal |
2,878,471 |
- |
6,835,227 |
|
Loss on |
15,893,766 |
- |
- |
|
Directors’ Remuneration |
3,520,000 |
3,620,000 |
2,565,000 |
|
Total Expenses |
5,065,713,754 |
5,663,602,799 |
5,192,504,641 |
|
|
|
|
|
|
Profit / [Loss] before Finance
Costs |
220,879,457 |
910,104,037 |
1,056,718,715 |
|
Financial Costs |
[30,872,756] |
[31,503,850] |
[71,794,948] |
|
|
|
|
|
|
Net Profit / [Loss] |
190,006,701 |
878,600,187 |
984,923,767 |
BALANCE SHEET [BAHT]
The
latest financial figures
published for September 30,
2013 was :
ASSETS
[Thousand Baht]
[Unaudited]
|
Current Assets |
2013 |
|
|
|
|
Cash & Cash
Equivalents |
2,448 |
|
Trade and Other
Receivables |
744,744 |
|
Inventories |
849,094 |
|
Other Current Assets
Refundable Value
Added Tax |
73,791 |
|
Prepaid Spare
Parts |
4,715 |
|
Receivables from Buying
and Selling Forward Exchange
Contracts |
41,881 |
|
Others |
5 |
|
Total Other Current Assets |
120,392 |
|
Total Current Assets
|
1,716,678 |
|
Investments in Related Party
|
23,952 |
|
Property, Plant &
Equipment |
5,426,547 |
|
Intangible Assets -
Deferred Computer Software |
285 |
|
Other Non-current Assets Prepaid Machineries & Accessories |
91,366 |
|
Guarantee for Leasing
Assets |
7,285 |
|
Accounts Receivable - Customs Department |
12,443 |
|
Others |
1,787 |
|
Total Non-current
Assets |
112,881 |
|
Total Assets |
7,280,343 |
LIABILITIES & SHAREHOLDERS' EQUITY [BAHT]
[Thousand Baht]
[Unaudited]
|
Current
Liabilities |
2013 |
|
|
|
|
Bank Overdraft &
Short-term Loan from Financial
Institutions |
|
|
Bank overdrafts |
16,115 |
|
Trust receipt |
1,161,872 |
|
Short-term loans from financial institutions |
430,908 |
|
Total |
1,608,895 |
|
Trade and Other
Payable |
1,211,155 |
|
Current Portion of Long-term
Liabilities Liabilities under
financial leases |
1,487 |
|
Long-term loans |
62,500 |
|
Acquisition Payable |
52,986 |
|
Accrued Interest |
773 |
|
Other Current Liabilities |
|
|
Others |
3,327 |
|
Total |
3,327 |
|
|
|
|
Total Current Liabilities |
2,941,123 |
|
Liabilities under Financial
Leases- Net |
2,604 |
|
Long-term Loans - Net |
797,500 |
|
Provision for Long-term Employee Benefits |
33,136 |
|
Total Liabilities |
3,774,363 |
|
|
|
|
Shareholders' Equity |
|
|
Share capital
Authorized share
capital 399,444,945 common
stock of Baht 1 par
value |
399,445 |
|
Issued and
paid-up share capital |
|
|
399,439,227 common
stock of Baht 1 par
value |
399,439 |
|
Premium on Share
Capital |
876,616 |
|
Retained Earning Appropriated for
Legal Reserve |
60,000 |
|
Unappropriated |
2,169,925 |
|
Total Shareholders' Equity |
3,505,980 |
|
Total Liabilities &
Shareholders' Equity |
7,280,343 |
PROFIT &
LOSS ACCOUNT
For the nine-month
periods ended September
30, 2013.
[Thousand Baht]
[Unaudited]
|
Revenue |
2013 |
|
|
|
|
Sales |
4,004,237 |
|
Other Income Scrap Sales
|
7,088 |
|
Tax Cards
Income |
13,832 |
|
Others |
14,102 |
|
Total Revenues |
4,039,259 |
|
Expenses |
|
|
|
|
|
Cost of Sales
|
3,734,518 |
|
Selling Expenses |
118,866 |
|
Administrative Expenses |
133,838 |
|
Loss on Exchange Rates |
59 |
|
Loss on Machineries and Accessories Disposal |
7,285 |
|
Directors’ Remuneration |
3,405 |
|
Total Expenses |
3,997,971 |
|
|
|
|
Profit / [Loss] before Finance
Costs |
41,288 |
|
Financial Costs |
[33,639] |
|
|
|
|
Net Profit / [Loss] |
7,649 |
FINANCIAL ANALYSIS
|
ITEM |
UNIT |
2012 |
2011 |
2010 |
|
|
|
|
|
|
|
LIQUIDITY RATIO |
|
|
|
|
|
CURRENT RATIO |
TIMES |
0.70 |
0.63 |
0.66 |
|
QUICK RATIO |
TIMES |
0.29 |
0.28 |
0.36 |
|
|
|
|
|
|
|
ACTIVITY RATIO |
|
|
|
|
|
FIXED ASSETS TURNOVER |
TIMES |
1.20 |
1.57 |
1.72 |
|
TOTAL ASSETS TURNOVER |
TIMES |
0.84 |
1.08 |
1.09 |
|
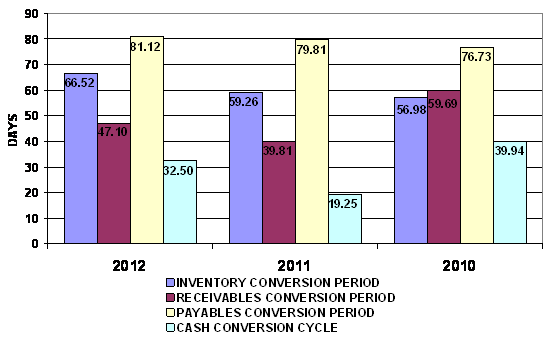
INVENTORY CONVERSION PERIOD |
DAYS |
66.52 |
59.26 |
56.98 |
|
INVENTORY TURNOVER |
TIMES |
5.49 |
6.16 |
6.41 |
|
RECEIVABLES CONVERSION PERIOD |
DAYS |
47.10 |
39.81 |
59.69 |
|
RECEIVABLES TURNOVER |
TIMES |
7.75 |
9.17 |
6.11 |
|
PAYABLES CONVERSION PERIOD |
DAYS |
81.12 |
79.81 |
76.73 |
|
CASH CONVERSION CYCLE |
DAYS |
32.50 |
19.25 |
39.94 |
|
|
|
|
|
|
|
PROFITABILITY
RATIO |
|
|
|
|
|
COST OF GOODS SOLD |
% |
91.93 |
81.82 |
81.09 |
|
SELLING & ADMINISTRATION |
% |
6.02 |
4.96 |
5.35 |
|
INTEREST |
% |
0.60 |
0.48 |
1.20 |
|
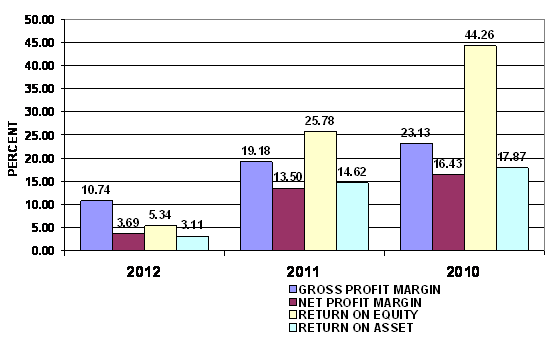
GROSS PROFIT MARGIN |
% |
10.74 |
19.18 |
23.13 |
|
NET PROFIT MARGIN BEFORE EX. ITEM |
% |
4.29 |
13.98 |
17.62 |
|
NET PROFIT MARGIN |
% |
3.69 |
13.50 |
16.43 |
|
RETURN ON EQUITY |
% |
5.34 |
25.78 |
44.26 |
|
RETURN ON ASSET |
% |
3.11 |
14.62 |
17.87 |
|
EARNING PER SHARE |
BAHT |
0.48 |
2.20 |
2.74 |
|
|
|
|
|
|
|
LEVERAGE RATIO |
|
|
|
|
|
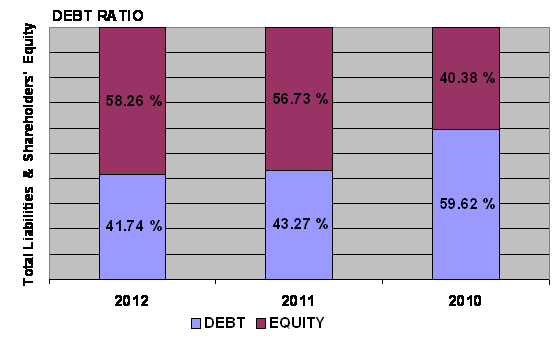
DEBT RATIO |
TIMES |
0.42 |
0.43 |
0.60 |
|
DEBT TO EQUITY RATIO |
TIMES |
0.72 |
0.76 |
1.48 |
|
TIME INTEREST EARNED |
TIMES |
7.15 |
28.89 |
14.72 |
|
|
|
|
|
|
|
ANNUAL GROWTH |
|
|
|
|
|
SALES GROWTH |
% |
(20.89) |
8.54 |
|
|
OPERATING PROFIT |
% |
(75.73) |
(13.87) |
|
|
NET PROFIT |
% |
(78.37) |
(10.80) |
|
|
FIXED ASSETS |
% |
4.07 |
18.42 |
|
|
TOTAL ASSETS |
% |
1.67 |
9.00 |
|
ANNUAL GROWTH :
ACCEPTABLE
An annual sales growth is -20.89%. Turnover has decreased from THB
6,508,690,341.00 in 2011 to THB 5,148,791,323.00 in 2012. While net profit has
decreased from THB 878,600,187.00 in 2011 to THB 190,006,701.00 in 2012. And
total assets has increased from THB 6,007,621,045.00 in 2011 to THB
6,107,797,425.00 in 2012.
PROFITABILITY :
SATISFACTORY
PROFITABILITY
RATIO
|
Gross Profit Margin |
10.74 |
Impressive |
Industrial
Average |
4.66 |
|
Net Profit Margin |
3.69 |
Impressive |
Industrial
Average |
2.41 |
|
Return on Assets |
3.11 |
Acceptable |
Industrial
Average |
4.66 |
|
Return on Equity |
5.34 |
Deteriorated |
Industrial
Average |
11.75 |
Gross Profit Margin used to assess a firm's financial health by revealing
the proportion of money left over from revenues after accounting for the cost
of goods sold. Gross profit margin serves as the source for paying additional
expenses and future savings. The company’s
figure is 10.74%. When compared with the industry average, the ratio of
the company was higher, indicated that company was more profitable than the
same industry.
Net Profit Margin is the indicator of the company's efficiency in that net
profit takes into consideration all expenses of the company. A low profit
margin indicates a low margin of safety, higher risk that a decline in sales
will erase profits and result in a net loss. The company’s figure is
3.69%, higher figure when compared with those of its average competitors
in the same industry, indicated that business was an efficient operator in a dominant position within its industry.
Return on Assets measures how efficiently profits are being generated
from the assets employed in the business when compared with the ratios of firms
in a similar business. A low ratio in comparison with industry averages
indicates an inefficient use of business assets. When compared with the
industry average, it was lower, the
company's figure is 3.11%.
Return on Equity indicates how profitable a company is by comparing its
net income to its average shareholders' equity, ROE measures how much the
shareholders earned for their investment in the company. When compared with the
industry average, it was lower, the company's figure is 5.34%.
Trend of the
average competitors in the same industry for last 5 years
Return on Assets Uptrend
Return on Equity Uptrend
LIQUIDITY : RISKY
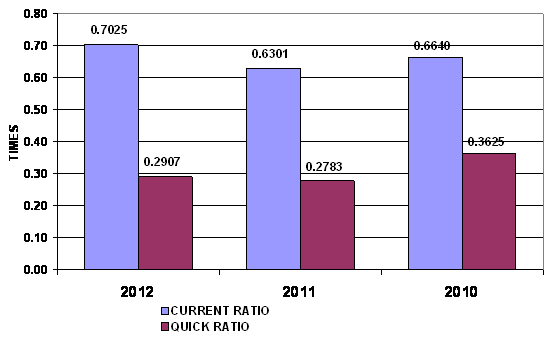
LIQUIDITY RATIO
|
Current Ratio |
0.70 |
Risky |
Industrial Average |
0.88 |
|
Quick Ratio |
0.29 |
|
|
|
|
Cash Conversion Cycle |
32.50 |
|
|
|
The Current Ratio is to ascertain whether a company's short-term assets
are readily available to pay off its short-term liabilities. The company's figure
is 0.7 times in 2012, increased from 0.63 times, then the company may not be
efficiently using its current assets. When compared with the industry average,
the ratio of the company was lower.
The Quick Ratio is a liquidity indicator that further refines the
current ratio by measuring the amount of the most liquid current assets there
are to cover current liabilities. The company's figure is 0.29 times in 2012,
increased from 0.28 times, then the company has not enough current assets that
presumably can be quickly converted to cash for pay financial obligations.
The Cash Conversion Cycle measures the number of days a company's cash
is tied up in the production and sales process of its operations and the
benefit from payment terms from its creditors. It meant the company could
survive when no cash inflow was received from sale for 33 days.
Trend of the
average competitors in the same industry for last 5 years
Current Ratio Downtrend
LEVERAGE :
EXCELLENT
LEVERAGE RATIO
|
Debt Ratio |
0.42 |
Impressive |
Industrial
Average |
0.66 |
|
Debt to Equity Ratio |
0.72 |
Impressive |
Industrial
Average |
1.92 |
|
Times Interest Earned |
7.15 |
Impressive |
Industrial
Average |
- |
Debt to Equity Ratio a measurement of how much suppliers, lenders, creditors
and obligors have committed to the company versus what the shareholders have
committed. A lower the percentage means that the company is using less leverage
and has a stronger equity position.
Times Interest Earned measuring a company's ability to meet its debt
obligations. Ratio is 7.16 higher than 1, so the company can pay interest
expenses on outstanding debt.
Debt Ratio shows the proportion of a company's assets which are financed
through debt. The company's figure is 0.42 less than 0.5, most of the company's
assets are financed through equity.
Trend of the
average competitors in the same industry for last 5 years
Debt Ratio Uptrend
Times Interest Earned Downtrend
ACTIVITY : SATISFACTORY
ACTIVITY RATIO
|
Fixed Assets Turnover |
1.20 |
Impressive |
Industrial
Average |
- |
|
Total Assets Turnover |
0.84 |
Deteriorated |
Industrial
Average |
1.93 |
|
Inventory Conversion Period |
66.52 |
|
|
|
|
Inventory Turnover |
5.49 |
Acceptable |
Industrial
Average |
9.78 |
|
Receivables Conversion Period |
47.10 |
|
|
|
|
Receivables Turnover |
7.75 |
Impressive |
Industrial
Average |
3.20 |
|
Payables Conversion Period |
81.12 |
|
|
|
The company's Account Receivable Ratio is calculated as 7.75 and 9.17 in
2012 and 2011 respectively. This ratio measures the efficiency of the company
in managing its trade debtors to generate revenue. A lower ratio may indicate
over extension and collection problems. Conversely, a higher ratio may indicate
an overtly stringent policy. In this case, the company's A/R ratio in 2012
decreased from 2011. This would suggest the company had deteriorated in the
management of its debt collections.
Inventory Turnover in Days Ratio indicates the liquidity of inventory.
It estimates the number of days that it will take to sell the current
inventory. Inventory is particularly sensitive to change in business
activities. The inventory turnover in days has increased from 59 days at the
end of 2011 to 67 days at the end of 2012. This represents a negative trend.
And Inventory turnover has decreased from 6.16 times in year 2011 to 5.49 times
in year 2012.
The company's Total Asset Turnover is calculated as 0.84 times and 1.08
times in 2012 and 2011 respectively. This ratio is determined by dividing total
assets into total sales turnover. The ratio measures the activity of the assets
and the ability of the firm to generate sales through the use of the assets.
Trend of the average
competitors in the same industry for last 5 years
Fixed Assets Turnover Downtrend
Total Assets Turnover Uptrend
Inventory Turnover Uptrend
Receivables Turnover Downtrend
FOREIGN EXCHANGE RATES
|
Currency |
Unit
|
Indian Rupees |
|
US Dollar |
1 |
Rs.61.94 |
|
|
1 |
Rs.103.31 |
|
Euro |
1 |
Rs.85.11 |
INFORMATION DETAILS
|
Report Prepared
by : |
NIS |
RATING EXPLANATIONS
|
RATING |
STATUS |
PROPOSED CREDIT LINE |
|
|
>86 |
Aaa |
Possesses an extremely sound financial base with the strongest
capability for timely payment of interest and principal sums |
Unlimited |
|
71-85 |
Aa |
Possesses adequate working capital. No caution needed for credit
transaction. It has above average (strong) capability for payment of interest
and principal sums |
Large |
|
56-70 |
A |
Financial & operational base are regarded healthy. General
unfavourable factors will not cause fatal effect. Satisfactory capability for
payment of interest and principal sums |
Fairly Large |
|
41-55 |
Ba |
Overall operation is considered normal. Capable to meet normal
commitments. |
Satisfactory |
|
26-40 |
B |
Capability to overcome
financial difficulties seems comparatively below average. |
Small |
|
11-25 |
Ca |
Adverse factors are apparent. Repayment of interest and principal sums
in default or expected to be in default upon maturity |
Limited with
full security |
|
<10 |
C |
Absolute credit risk exists. Caution needed to be exercised |
Credit not
recommended |
|
-- |
NB |
New Business |
-- |
This score serves as a reference to assess SC’s credit risk
and to set the amount of credit to be extended. It is calculated from a
composite of weighted scores obtained from each of the major sections of this
report. The assessed factors and their relative weights (as indicated through
%) are as follows:
Financial
condition (40%) Ownership
background (20%) Payment record
(10%)
Credit history
(10%) Market trend
(10%) Operational
size (10%)
This report is issued at your request without any
risk and responsibility on the part of MIRA INFORM PRIVATE LIMITED (MIPL)
or its officials.