MIRA
INFORM REPORT
|
Report Date : |
28.02.2014 |
IDENTIFICATION DETAILS
|
Name : |
MARMOLSPAIN SL |
|
|
|
|
Registered Office : |
C/ |
|
|
|
|
Country : |
|
|
|
|
|
Financials (as on) : |
2012 |
|
|
|
|
Date of Incorporation : |
26.03.2003 |
|
|
|
|
Legal Form : |
Private Company |
|
|
|
|
Line of Business : |
· Engaged in Quarrying of ornamental and building stone, limestone, gypsum, chalk and slate engaged in the Extraction, Processing
and marketing of marble. engaged in the Cutting, shaping and
finishing of stone |
|
|
|
|
No. of Employees |
09 (2014) |
RATING & COMMENTS
|
MIRA’s Rating : |
Ba |
|
RATING |
STATUS |
PROPOSED CREDIT LINE |
|
|
41-55 |
Ba |
Overall operation is considered normal. Capable to meet normal
commitments. |
Satisfactory |
|
Status : |
Satisfactory |
|
Payment Behaviour : |
Slow but Correct |
|
Litigation : |
Clear |
NOTES :
Any query related to this report can be made
on e-mail : infodept@mirainform.com
while quoting report number, name and date.
ECGC Country Risk Classification List – december 01, 2013
|
Country Name |
Previous Rating (30.09.2013) |
Current Rating (01.12.2013) |
|
Spain |
A2 |
A2 |
|
Risk Category |
ECGC
Classification |
|
Insignificant |
A1 |
|
Low |
A2 |
|
Moderate |
B1 |
|
High |
B2 |
|
Very High |
C1 |
|
Restricted |
C2 |
|
Off-credit |
D |
Spain ECONOMIC OVERVIEW
After almost 15
years of above average GDP growth, the Spanish economy began to slow in late
2007 and entered into a recession in the second quarter of 2008. GDP contracted
by 3.7% in 2009, ending a 16-year growth trend, and by another 0.3% in 2010;
GDP expanded 0.4% in 2011, before contracting 1.4% in 2012. The economy has
once again fallen into recession as deleveraging in the private sector, fiscal
consolidation, and continued high unemployment weigh on domestic demand and
investment, even as exports have shown signs of resiliency. The unemployment
rate rose from a low of about 8% in 2007 to 26.0% in 2012. The economic
downturn has also hurt Spain's public finances. The government budget deficit
peaked at 11.2% of GDP in 2010 and the process to reduce this imbalance has
been slow despite the central government's efforts to raise new tax revenue and
cut spending. Spain reduced its budget deficit to 9.4% of GDP in 2011, and
roughly 7.4% of GDP in 2012, above the 6.3% target negotiated between Spain and
the EU. Although Spain''s large budget deficit and poor economic growth
prospects remain a source of concern for foreign investors, the government''s
ongoing efforts to cut spending and introduce flexibility into the labor
markets are intended to assuage these concerns. The government is also taking
steps to shore up the banking system, namely by using up to $130 billion in EU
funds to recapitalize struggling banks exposed to the collapsed domestic
construction and real estate sectors.
|
Source : CIA |
EXECUTIVE SUMMARY
|
Name: |
MARMOLSPAIN
SL |
|
NIF
/ Fiscal code: |
B53754503 |
|
Trade
Name |
MARMOLSPAIN |
|
Status: |
ACTIVE |
|
Incorporation
Date: |
26/03/2003 |
|
Register
Data |
Register
Section 8 Sheet 75848 |
|
Last
Publication in BORME: |
16/05/2013
[Dismissal/Resignation] |
|
Last
Published Account Deposit: |
2012 |
|
Share
Capital: |
180.000 |
|
|
|
|
Localization: |
C/
ALTAMIRA, 13. - NOVELDA - 03660 - ALICANTE |
|
Telephone
- Fax - Email – Website: |
Ph.:.
965601088/965601580 Email. admin@marmolspain.es
Website.
www.marmolspain.es |
|
Number
of Branches |
1 |
|
|
|
|
Activity: |
|
|
NACE: |
0811
- Quarrying of ornamental and building stone, limestone, gypsum, chalk and
slate |
|
Registered
Trademarks: |
|
|
Audited
/ Opinion: |
Si
/ |
|
Tenders
and Awards: |
0
for a total cost of 0 |
|
Subsidies: |
3
for a total cost of 13659.43 |
|
Quality
Certificate: |
No |
|
Defaults,
Legal Claims and Insolvency Proceedings : |
||||
|
|
|
Number |
Amount
(€) |
Most
Recent Entry |
|
Insolvency
Proceedings, Bankruptcy and Suspension of Payments |
|
Unpublished |
--- |
--- |
|
Defaults
on debt with Financial Institutions and Large Companies |
|
None |
--- |
--- |
|
Judicial
Claims (Notices, Executive Proceedings, Attachments, Auctions, Bad Debt) |
|
None |
0 |
--- |
|
Proceedings
heard by the Civil Court |
|
Unpublished |
0 |
--- |
|
Proceedings
heard by the Labour Court |
|
1 |
0 |
--- |
|
Partners: |
|
BELTORRE
CAPITAL SL |
100
% |
|
|
Shares: |
1 |
|
|
Other
Links: |
1 |
|
|
No.
of Active Corporate Bodies: |
|
|
|
Ratios |
2012 |
2011 |
Change |
|
|
|
|
|||||
|
Guarantees: |
|
||||
|
Properties
Registered: |
Company
NO, Administrator NO |
||||
|
Financing
/ Guarantee Sources : |
Sources
YES, Guarantees NO |
||||
|
|
|||||
|
INVESTIGATION SUMMARY |
|||||
|
The company MARMOLSPAIN SL with VAT No. B53754503 was incorporated in Alicante in March, 2003. It is an indefinite duration company engaged in the Cutting, shaping and finishing of stone. After analyzing the information in our possession and 2012 financial information, it is estimated that the overall structure is favourable. |
|||||
Identification
|
|
|
Social
Denomination: |
MARMOLSPAIN SL |
|
Trade
Name: |
MARMOLSPAIN |
|
NIF
/ Fiscal code: |
B53754503 |
|
Corporate
Status: |
ACTIVE |
|
Start
of activity: |
2003 |
|
Registered
Office: |
C/ ALTAMIRA, 13. |
|
Locality: |
NOVELDA |
|
Province: |
ALICANTE |
|
Postal
Code: |
03660 |
|
Telephone: |
965601088/965601580 |
|
Fax: |
965605400 |
|
Website: |
|
|
Email: |
|
Branch Offices
|
Address |
Postal Code |
City |
Province |
|
Calle Encina, 17, Poligono
Industrial de Arinaga |
35118 |
Agüimes |
Las Palmas |
Activity
|
NACE: |
0811 |
|
Additional
Information: |
It is a family business
engaged in the extraction, processing and marketing of marble. |
|
Additional
Address: |
Calle Rafael Altamira 13,
Barrio Estación de Novelda, 03660 Alicante, registered office, believed to be
owned by the subject. Also has a post office box nº83 in the same city, to
receive its documents. It has a delegation in the Canary Islands. |
|
Franchise: |
No |
|
Import
/ export: |
EXPORTS |
|
Future
Perspective: |
Product / service
improvement |
|
Industry
situation: |
Maturity |
Number of Employees
|
|
Year |
No. of employees |
Established |
Incidentals |
|
|
|
2014 |
9 |
|
|
|
Chronological
Summary
|
|
Year |
Act |
|
|
|
2003 |
Appointments/ Re-elections
(4) Company Formation (1) Declaration of Sole Propietorship (1) |
|
|
|
2004 |
Accounts deposit (ejer.
2003) |
|
|
|
2005 |
Accounts deposit (ejer.
2004) Appointments/ Re-elections (2) Cessations/ Resignations/ Reversals (1) |
|
|
|
2006 |
Accounts deposit (ejer.
2005) Appointments/ Re-elections (1) Cessations/ Resignations/ Reversals (2) |
|
|
|
2007 |
Accounts deposit (ejer.
2006) Appointments/ Re-elections (2) |
|
|
|
2008 |
Accounts deposit (ejer.
2007) |
|
|
|
2010 |
Accounts deposit (ejer.
2008, 2009) Appointments/ Re-elections (2) |
|
|
|
2011 |
Accounts deposit (ejer. 2010)
Appointments/ Re-elections (1) Cessations/ Resignations/ Reversals (2) |
|
|
|
2012 |
Accounts deposit (ejer.
2011) |
|
|
|
2013 |
Accounts deposit (ejer.
2012) Appointments/ Re-elections (2) Cessations/ Resignations/ Reversals (2) |
|
Breakdown of
Owners' Equity
|
|
|
Registered
Capital: |
180.000 |
|
Paid
up capital: |
180.000 |
|
Updated Evolution of the Subscribed and Paid-in
Capital |
|||||
|
|
|
|
|
|
|
|
|
|
|
|
|
|
|
Publishing Date |
Registration Type |
Capital Subscribed |
Paid up capital |
Underwritten result |
Disbursed Result |
|
04/04/2003 |
Company Formation |
180.000 |
180.000 |
180.000 |
180.000 |
Active Social Bodies
|
Post published |
Social Body's Name |
Appointment Date |
Other Positions in this
Company |
|
SINGLE PARTNER |
BELTORRE CAPITAL SL |
04/04/2003 |
1 |
|
PRESIDENT |
BELTRA TORREGROSA MANUEL |
24/10/2005 |
5 |
|
MEMBER OF THE BOARD |
TORREGROSA VALERO ISABEL |
24/10/2005 |
1 |
|
|
BELTRA TORREGROSA ANA |
24/10/2005 |
1 |
|
|
BELTRA TORREGROSA DAVID |
24/10/2005 |
5 |
|
|
BELTRA TORREGROSA MANUEL |
24/10/2005 |
5 |
|
COMBINED PROXY |
BELTRA TORREGROSA MANUEL |
03/05/2013 |
5 |
|
|
BELTRA TORREGROSA ISABEL |
03/05/2013 |
1 |
|
PROXY |
BELTRA TORREGROSA DAVID |
07/05/2013 |
5 |
|
|
BELTRA TORREGROSA PABLO |
10/08/2010 |
6 |
|
SECRETARY |
BELTRA TORREGROSA ISABEL
MARIA |
11/07/2011 |
2 |
|
ACCOUNTS' AUDITOR / HOLDER |
M & A ASESORES
CONSULTORES LEVANTE SL |
06/08/2010 |
2 |
Historical Social Bodies
|
Social Body's Name |
Post published |
End Date |
Other Positions in this
Company |
|
ARAGONES SIGNES JOAN
BAPTISTA |
MEMBER OF THE BOARD |
13/07/2011 |
1 |
|
BELTRA DIEZ JOSE MARIA |
MEMBER OF THE BOARD |
24/10/2005 |
2 |
|
|
PRESIDENT |
24/10/2005 |
|
|
BELTRA TORREGROSA DAVID |
COMBINED PROXY |
03/08/2006 |
5 |
|
|
MEMBER OF THE BOARD |
24/10/2005 |
|
|
|
COMBINED PROXY |
03/05/2013 |
|
|
BELTRA TORREGROSA ISABEL
MARIA |
MEMBER OF THE BOARD |
11/07/2011 |
2 |
|
BELTRA TORREGROSA JOSE
MARIA |
MEMBER OF THE BOARD |
24/10/2005 |
3 |
|
|
MEMBER OF THE BOARD |
03/08/2006 |
|
|
|
COMBINED PROXY |
03/08/2006 |
|
|
BELTRA TORREGROSA MANUEL |
MEMBER OF THE BOARD |
24/10/2005 |
5 |
|
|
COMBINED PROXY |
03/05/2013 |
|
|
BELTRA TORREGROSA PABLO |
MEMBER OF THE BOARD |
24/10/2005 |
6 |
|
|
VICE CHAIRMAN |
24/10/2005 |
|
|
|
VICE CHAIRMAN |
08/05/2013 |
|
|
|
MEMBER OF THE BOARD |
08/05/2013 |
|
|
|
PROXY |
10/08/2010 |
|
|
BELTRA TORREGROSA PABLO
LUIS |
PROXY |
03/05/2013 |
1 |
|
M & A ASESORES
CONSULTORES LEVANTE SL |
ACCOUNTS' AUDITOR / HOLDER |
06/08/2010 |
2 |
|
MESEGUER POVEDA PEDRO |
ACCOUNTS' AUDITOR / HOLDER |
22/06/2007 |
1 |
|
SENTENERO ARACIL LUIS |
SECRETARY |
24/10/2005 |
2 |
|
|
SECRETARY |
11/07/2011 |
|
Executive board
|
Post |
NIF |
Name |
|
FINANCIAL DIRECTOR |
|
MARIA JOSE RIQUELME TORREGROSA |
|
MANAGING DIRECTOR |
|
PABLO BELTRA TORREGROSA |
Defaults, Legal Claims and Insolvency Proceedings
Section enabling assessment of the degree of compliance of the company queried
with its payment obligations. It provides information on the existence and
nature of all stages of Insolvency and Legal Proceedings published with
reference to the Company in the country's various Official Bulletins and
national newspapers, as well Defaults Registered in the main national credit
bureaus (ASNEF Industrial and RAI ).
> Summary
Chronological summary
|
|
|
Number
of Publications |
Amount
(_) |
Start
date |
End
date |
|
Insolvency
Proceedings, Bankruptcy and Suspension of Payments |
|
Unpublished |
--- |
--- |
--- |
|
Request/Declaration |
|
0 |
--- |
date |
|
|
Proceedings |
|
--- |
--- |
|
--- |
|
Resolution |
|
--- |
--- |
|
--- |
|
Defaults
on debt with Financial Institutions and Large Companies |
Bank and Commercial Delinquency |
None |
0 |
|
|
|
Status:
Friendly |
|
--- |
|
|
|
|
Status:
Pre-Litigation |
|
--- |
|
|
|
|
Status:
Litigation |
|
--- |
|
|
|
|
Status:
Non-performing |
|
--- |
|
|
|
|
Status:
insolvency proceedings, bankruptcy and suspension of payments |
|
--- |
|
|
|
|
Other
status |
|
--- |
|
|
|
|
Legal
and Administrative Proceedings |
|
Unpublished |
--- |
|
|
|
Notices
of defaults and enforcement |
|
--- |
--- |
|
--- |
|
Seizures |
|
--- |
--- |
|
--- |
|
Auctions |
|
--- |
--- |
|
--- |
|
Declarations
of insolvency and bad debt |
|
--- |
--- |
|
--- |
|
Proceedings
heard by the Civil Court |
|
Unpublished |
--- |
|
|
|
Proceedings
heard by the Labour Court |
|
1 |
--- |
10/03/2011 |
10/03/2011 |
> Details
> Basis for rating
|
Positive Factors |
Adverse Factors |
|
It has been found to have regular payment performance
and has paid all of its debts in a timely manner. Productivity increase. Its salaried staff
productivity has increased with respect to the previous fiscal year. Positive Working Capital. Its Working Capital
quality is significant, i.e. much of its financing comes from its equity. A
structure is considered optimal if its liquidity level is slightly above its
debt volume as a result of low idleness levels of its financial resources
involved. Financial Cost Reduction. Its average financial
expense in 2012 with respect to its operating gross result is 44.85%. As this
value is lower than that of the previous fiscal year, the financial situation
is deemed, in principle, to have improved. Adequate long-term solvency. As Real Assets
exceed total debts, it offers, in principle, real property guarantee for
settlement of long-term obligations to third parties. |
It has minor judicial claims. of outstanding
debts with Public Administration bodies or resulting from claims filed by
individuals before Courts of the different jurisdictions have been published
in the Official Gazettes. However, these judicial claims are in stages prior
to the execution phase. ROE lowering effect. Total Economic Rate of
Return in 2012 is lower than the Borrowing Cost; therefore, the leverage is
lower than the unit and has a ROE lowering effect. This indicates that the
Company should not incur any further debts, as this would reduce its
shareholders' profitability. During 2012 the company renewed its customer portfolio
3.45 times. This reflects an approximate average payment collection term of
120 días days. Average payment term to suppliers is longer than average
payment term from customers.This means that the company pays to suppliers
later than it receives payment from its customers. This benefits the company
from a financial perspective, as it may increase its income; whereas it is
risky for suppliers, who are, therefore, financing the company. |
The
information contained in the latest annual statements has led to a Scoring
review for the company.
Probability of default
> Probabilidad Estimada
de Impago para los próximos 12 meses: 2.2 %
> Latest Rating Changes :
|
Sector
in which comparison is carried out : 081 Quarrying
of stone, sand and clay |
|
|
Relative
Position:
|
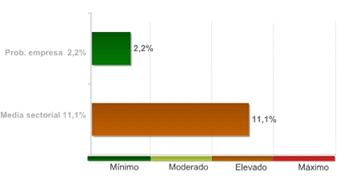
The
company's comparative analysis with the rest of the companies that comprise the
sector, shows the company holds a better position with regard to the
probability of non-compliance.
The
86.00% of the companies of the sector MARMOLSPAIN SL belongs to show a higher
probability of non-compliance.
The
probability of the company's non-compliance with its payment obligations within
deadlines estimated by our qualifications models is 2.18%.
In the event they fail to comply with the payment, the seriousness of the loss will depend on factors such as the promptness of the commencement of the charging management, the existence of executive documents which match the credit or the existence of guarantees and free debt assets under the name of the debtor. Therefore, the probability of non-compliance should not be solely interpreted as the total loss of the owed amount.
Result of query submitted to the R.A.I. (Spanish Bad Debt Register) on
LEGAL CLAIMS
|
Summary
of Judicial Claims |
|
|
|
|
|
|
|
No se han publicado |
|
|
|
No se han publicado |
|
|
|
|
|
|
|
No se han publicado |
|
|
|
No se han publicado |
|
|
|
No se han publicado |
|
|
|
No se han publicado |
|
|
|
|
|
|
|
No se han publicado |
|
|
|
No se han publicado |
|
|
|
|
|
|
|
|
Guarantees
|
References |
|
|
|
|
|
Clients |
|
|
Name |
NIF |
Telephone |
|
|
GRUPO RICO CISNEROS S,L |
B97475917 |
963959701 |
|
Link List
|
RESULTING FROM THE TOTAL
SPIN-OFF: |
1 Entities |
|
PARTICIPATES IN: |
1 Entities |
|
SHAREHOLDERS: |
1 Entities |
> Shareholders
|
Relationship |
Entity |
Province |
Shareholding stake |
|
SHAREHOLDERS |
BELTORRE CAPITAL SL |
ALICANTE |
100 |
|
PARTICIPATES IN |
MARMOLSPAIN SARL
(MARRUECOS) |
|
100 |
> Other relationships
|
Relationship |
Entity |
Province |
Shareholding stake |
|
RESULTING FROM THE TOTAL
SPIN-OFF |
MARMOLSPAIN SA |
ALICANTE |
|
|
Turnover |
|
|
Total
Sales 2012 |
4.679.893,16 |
Financial Accounts and Balance Sheets
Financial Years Presented
|
Ejercicio |
Tipo
de Cuentas Anuales |
Fecha
Presentacion |
|
2012 |
Normales |
July
2013 |
|
2011 |
Normales |
July
2012 |
|
2010 |
Normales |
September
2011 |
|
2009 |
Normales |
September
2010 |
|
2008 |
Normales |
January
2010 |
|
2007 |
Normales |
August
2008 |
|
2006 |
Normales |
July
2007 |
|
2005 |
Normales |
August
2006 |
|
2004 |
Normales |
July
2005 |
|
2003 |
Normales |
August
2004 |
The
data in the report regarding the last Company Accounts submitted by the company
is taken from the TRADE REGISTER serving the region in which the company's
address is located 31/12/2012
> Balance en
formato Abreviado de acuerdo al Nuevo Plan General Contable 2007
Information
corresponding to the fiscal year
2012 2011 2010 2009 2008 is taken from information
submitted to the TRADE REGISTER. Data corresponding to fiscal years before
2012 2011 2010 2009 2008 has been compiled based on
the equivalence criteria stipulated in Act JUS/206/2009. Where the provisions
of the Act did not establish relevant equivalence criteria.
|
|
ORIGINAL |
ORIGINAL |
ORIGINAL |
ORIGINAL |
ORIGINAL |
|
|
Assets |
2012 |
2011 |
2010 |
2009 |
2008 |
|
|
A)
NON-CURRENT ASSETS: 11000 |
1.133.226,00 |
1.178.788,00 |
1.174.646,00 |
1.249.813,00 |
946.441,00 |
|
|
I. Intangible fixed assets : 11100 |
301,00 |
301,00 |
301,00 |
301,00 |
301,00 |
|
|
II. Tangible fixed assets : 11200 |
608.351,00 |
633.500,00 |
629.551,00 |
654.697,00 |
667.204,00 |
|
|
III. Real estate investment: 11300 |
0,00 |
0,00 |
0,00 |
0,00 |
0,00 |
|
|
IV. Long-term investments in Group companies and associates :
11400 |
235.942,00 |
235.942,00 |
235.942,00 |
235.942,00 |
211.916,00 |
|
|
V. Long-term financial investments: 11500 |
131.711,00 |
134.995,00 |
136.090,00 |
136.220,00 |
67.021,00 |
|
|
VI. Assets for deferred tax : 11600 |
156.922,00 |
174.051,00 |
172.763,00 |
222.654,00 |
0,00 |
|
|
VII. Non-current trade debtors : 11700 |
0,00 |
0,00 |
0,00 |
0,00 |
0,00 |
|
|
B)
CURRENT ASSETS: 12000 |
4.326.506,00 |
4.974.219,00 |
4.886.992,00 |
4.166.901,00 |
5.410.341,00 |
|
|
I. Non-current assets held for sale : 12100 |
0,00 |
0,00 |
0,00 |
0,00 |
0,00 |
|
|
II. Stocks: 12200 |
2.518.307,00 |
2.551.885,00 |
2.608.886,00 |
2.001.463,00 |
2.197.314,00 |
|
|
III. Trade debtors and others receivable accounts: 12300 |
1.393.462,00 |
1.914.107,00 |
1.874.595,00 |
1.618.003,00 |
2.573.604,00 |
|
|
1.- Customers for sales and provisions of
services : 12380 |
1.393.462,00 |
1.333.063,00 |
1.399.436,00 |
1.471.031,00 |
2.543.476,00 |
|
|
a) Long-term
receivables from sales and services supplied: 12381 |
0,00 |
0,00 |
0,00 |
0,00 |
0,00 |
|
|
b) Customers for
sales and provisions of services : 12382 |
1.393.462,00 |
1.333.063,00 |
1.399.436,00 |
1.471.031,00 |
2.543.476,00 |
|
|
2.- Called up share capital : 12370 |
0,00 |
380.370,00 |
436.324,00 |
107.822,00 |
0,00 |
|
|
3.- Other accounts receivable :
12390 |
0,00 |
200.675,00 |
38.835,00 |
39.149,00 |
30.128,00 |
|
|
IV. Short-term investments in Group companies and associates:
12400 |
4.261,00 |
10.499,00 |
1.987,00 |
0,00 |
22.178,00 |
|
|
V. Short-term financial investments : 12500 |
248.284,00 |
249.692,00 |
292.132,00 |
1.408,00 |
0,00 |
|
|
VI. Short-term accruals: 12600 |
0,00 |
0,00 |
0,00 |
0,00 |
0,00 |
|
|
VII. Cash and other equivalent liquid assets : 12700 |
162.193,00 |
248.035,00 |
109.392,00 |
546.027,00 |
617.245,00 |
|
|
TOTAL
ASSETS (A + B) : 10000 |
5.459.732,00 |
6.153.007,00 |
6.061.638,00 |
5.416.713,00 |
6.356.783,00 |
|
|
|
ORIGINAL |
ORIGINAL |
ORIGINAL |
ORIGINAL |
ORIGINAL |
|
|
Liabilities
and Net Worth |
2012 |
2011 |
2010 |
2009 |
2008 |
|
|
A)
NET WORTH: 20000 |
3.909.694,00 |
3.865.636,00 |
3.859.049,00 |
3.855.642,00 |
4.924.952,00 |
|
|
A1) Shareholders' equity : 21000 |
3.909.694,00 |
3.865.636,00 |
3.859.049,00 |
3.855.642,00 |
4.924.690,00 |
|
|
I. Capital: 21100 |
180.000,00 |
180.000,00 |
180.000,00 |
180.000,00 |
180.000,00 |
|
|
1.- Registered
capital: 21110 |
180.000,00 |
180.000,00 |
180.000,00 |
180.000,00 |
180.000,00 |
|
|
2.- (Uncalled
capital) : 21120 |
0,00 |
0,00 |
0,00 |
0,00 |
0,00 |
|
|
II. Share premium: 21200 |
1.906.886,00 |
1.906.886,00 |
1.906.886,00 |
1.906.886,00 |
1.906.886,00 |
|
|
III. Reserves: 21300 |
2.285.461,00 |
2.285.461,00 |
2.285.242,00 |
2.285.242,00 |
2.710.463,00 |
|
|
IV. (Common stock equity): 21400 |
0,00 |
0,00 |
0,00 |
0,00 |
0,00 |
|
|
V. Profit or loss brought forward:
21500 |
-506.712,00 |
-513.080,00 |
-516.486,00 |
0,00 |
0,00 |
|
|
VI. Other shareholders' contributions:
21600 |
0,00 |
0,00 |
0,00 |
0,00 |
0,00 |
|
|
VII. Result of the period: 21700 |
44.058,00 |
6.368,00 |
3.406,00 |
-516.486,00 |
127.341,00 |
|
|
VIII. (Interim dividend): 21800 |
0,00 |
0,00 |
0,00 |
0,00 |
0,00 |
|
|
IX. Other net worth instruments:
21900 |
0,00 |
0,00 |
0,00 |
0,00 |
0,00 |
|
|
A2) Adjustments due to changes in value : 22000 |
0,00 |
0,00 |
0,00 |
0,00 |
0,00 |
|
|
A-3) Received subsidies, donations and legacies: 23000 |
0,00 |
0,00 |
0,00 |
0,00 |
261,00 |
|
|
B)
NON-CURRENT LIABILITIES: 31000 |
142.713,00 |
216.624,00 |
309.956,00 |
438.935,00 |
280.759,00 |
|
|
I. Long-term provisions: 31100 |
0,00 |
0,00 |
0,00 |
0,00 |
0,00 |
|
|
II. Long-term creditors : 31200 |
130.097,00 |
202.793,00 |
305.110,00 |
431.940,00 |
273.514,00 |
|
|
1.- Amounts owed to credit institutions:
31220 |
130.097,00 |
202.793,00 |
305.110,00 |
431.940,00 |
273.514,00 |
|
|
2.- Creditors from financial leasing :
31230 |
0,00 |
0,00 |
0,00 |
0,00 |
0,00 |
|
|
3.- Other long-term creditors :
31290 |
0,00 |
0,00 |
0,00 |
0,00 |
0,00 |
|
|
III. Long-term debts with Group companies and associates:
31300 |
0,00 |
0,00 |
0,00 |
0,00 |
0,00 |
|
|
IV. Liabilities for deferred tax: 31400 |
12.616,00 |
13.831,00 |
4.846,00 |
6.995,00 |
7.245,00 |
|
|
V. Long-term accruals: 31500 |
0,00 |
0,00 |
0,00 |
0,00 |
0,00 |
|
|
VI. Non-current trade creditors : 31600 |
0,00 |
0,00 |
0,00 |
0,00 |
0,00 |
|
|
VII. Special long-term debts : 31700 |
0,00 |
0,00 |
0,00 |
0,00 |
0,00 |
|
|
C)
CURRENT LIABILITIES : 32000 |
1.407.325,00 |
2.070.748,00 |
1.892.633,00 |
1.122.136,00 |
1.151.073,00 |
|
|
I. Liabilities linked to non-current assets held for sale :
32100 |
0,00 |
0,00 |
0,00 |
0,00 |
0,00 |
|
|
II. Short-term provisions: 32200 |
0,00 |
0,00 |
0,00 |
0,00 |
0,00 |
|
|
III. Short-term creditors : 32300 |
563.389,00 |
609.041,00 |
890.730,00 |
574.264,00 |
249.688,00 |
|
|
1.- Amounts owed to credit institutions: 32320 |
560.460,00 |
606.102,00 |
890.730,00 |
574.264,00 |
249.688,00 |
|
|
2.- Creditors from financial leasing :
32330 |
0,00 |
0,00 |
0,00 |
0,00 |
0,00 |
|
|
3.- Other short-term creditors :
32390 |
2.930,00 |
2.939,00 |
0,00 |
0,00 |
0,00 |
|
|
IV. Short-term debts with Group companies and associates:
32400 |
0,00 |
0,00 |
0,00 |
0,00 |
0,00 |
|
|
V. Trade creditors and other accounts payable: 32500 |
843.936,00 |
1.461.707,00 |
1.001.903,00 |
547.872,00 |
901.384,00 |
|
|
1.- Suppliers: 32580 |
575.407,00 |
1.049.376,00 |
872.892,00 |
389.367,00 |
703.377,00 |
|
|
a) Long-term debts :
32581 |
0,00 |
0,00 |
0,00 |
0,00 |
0,00 |
|
|
b) Short-term debts :
32582 |
575.407,00 |
1.049.376,00 |
872.892,00 |
389.367,00 |
703.377,00 |
|
|
2.- Other creditors : 32590 |
268.528,00 |
412.330,00 |
129.011,00 |
158.505,00 |
198.008,00 |
|
|
VI. Short-term accruals: 32600 |
0,00 |
0,00 |
0,00 |
0,00 |
0,00 |
|
|
VII. Special short-term debts : 32700 |
0,00 |
0,00 |
0,00 |
0,00 |
0,00 |
|
|
TOTAL
NET WORTH AND LIABILITIES (A + B + C) : 30000 |
5.459.732,00 |
6.153.007,00 |
6.061.638,00 |
5.416.713,00 |
6.356.783,00 |
|
|
|
ORIGINAL |
ORIGINAL |
ORIGINAL |
ORIGINAL |
ORIGINAL |
|
|
Profit
and Loss |
2012 |
2011 |
2010 |
2009 |
2008 |
|
|
1. Net turnover: 40100 |
4.679.893,00 |
4.843.105,00 |
4.886.637,00 |
4.410.840,00 |
8.674.949,00 |
|
|
2. Changes in stocks of finished goods and work in progress:
40200 |
0,00 |
0,00 |
0,00 |
0,00 |
0,00 |
|
|
3. Works carried out by the company for its assets: 40300 |
0,00 |
0,00 |
0,00 |
0,00 |
0,00 |
|
|
4. Supplies : 40400 |
-3.556.477,00 |
-3.735.242,00 |
-3.654.410,00 |
-3.524.309,00 |
-6.907.576,00 |
|
|
5. Other operating income: 40500 |
132.551,00 |
223.224,00 |
29.882,00 |
103.926,00 |
67.423,00 |
|
|
6. Personnel costs: 40600 |
-362.683,00 |
-380.880,00 |
-352.509,00 |
-392.413,00 |
-504.071,00 |
|
|
7. Other operating costs: 40700 |
-825.677,00 |
-880.420,00 |
-870.933,00 |
-1.311.170,00 |
-1.083.209,00 |
|
|
8. Amortisation of fixed assets: 40800 |
-29.046,00 |
-40.345,00 |
-32.419,00 |
-49.605,00 |
-91.949,00 |
|
|
9. Allocation of subsidies of non-financial fixed assets and
other: 40900 |
0,00 |
0,00 |
0,00 |
261,00 |
2.006,00 |
|
|
10. Excess provisions : 41000 |
0,00 |
0,00 |
0,00 |
0,00 |
0,00 |
|
|
11. Impairment and result of transfers of fixed assets:
41100 |
5.500,00 |
0,00 |
0,00 |
6.279,00 |
0,00 |
|
|
12. Negative difference in combined businesses: 41200 |
0,00 |
0,00 |
0,00 |
0,00 |
0,00 |
|
|
13. Other results : 41300 |
46.101,00 |
1.399,00 |
41.929,00 |
21.861,00 |
24.630,00 |
|
|
A)
OPERATING INCOME (1 + 2 + 3 + 4 + 5 + 6 + 7 + 8 + 9 + 10 + 11 + 12 + 13) :
49100 |
90.162,00 |
30.842,00 |
48.178,00 |
-734.331,00 |
182.203,00 |
|
|
14. Financial income : 41400 |
13.783,00 |
13.131,00 |
10.353,00 |
25.021,00 |
65.058,00 |
|
|
a) Allocation of financial subsidies,
donations and legacies: 41430 |
0,00 |
0,00 |
0,00 |
0,00 |
0,00 |
|
|
b) Other financial income: 41490 |
13.783,00 |
13.131,00 |
10.353,00 |
25.021,00 |
65.058,00 |
|
|
15. Financial expenditure: 41500 |
-30.320,00 |
-37.834,00 |
0,00 |
0,00 |
-72.262,00 |
|
|
16. Changes in fair value of financial instruments :
41600 |
0,00 |
0,00 |
-32.418,00 |
-25.846,00 |
0,00 |
|
|
17. Exchange rate differences : 41700 |
-3.968,00 |
1.649,00 |
23.482,00 |
-4.447,00 |
7.114,00 |
|
|
18. Impairment and result for transfers of financial
instruments: 41800 |
-11.092,00 |
-1.095,00 |
-127,00 |
214,00 |
-5.389,00 |
|
|
19. Other financial income and expenditure: 42100 |
0,00 |
0,00 |
0,00 |
0,00 |
0,00 |
|
|
a) Incorporation of financial expenditure
to assets: 42110 |
0,00 |
0,00 |
0,00 |
0,00 |
0,00 |
|
|
b) Financial income from arrangement with
creditors: 42120 |
0,00 |
0,00 |
0,00 |
0,00 |
0,00 |
|
|
c) Other income and expenditure:
42130 |
0,00 |
0,00 |
0,00 |
0,00 |
0,00 |
|
|
B)
FINANCIAL REVENUE (14 + 15 + 16 + 17 + 18 + 19) : 49200 |
-31.597,00 |
-24.149,00 |
1.291,00 |
-5.059,00 |
-5.479,00 |
|
|
C)
NET RESULT BEFORE TAXES (A + B) : 49300 |
58.565,00 |
6.693,00 |
49.469,00 |
-739.390,00 |
176.724,00 |
|
|
20. Income taxes: 41900 |
-14.507,00 |
-325,00 |
-46.063,00 |
222.903,00 |
-49.383,00 |
|
|
D)
RESULT OF THE PERIOD (C + 20) : 49500 |
44.058,00 |
6.368,00 |
3.406,00 |
-516.486,00 |
127.341,00 |
|
>
Normal Balance Sheet under the rules of the 1990 General Accounting Plan
(repealed since 1st January of 2008)
Information
corresponding to the fiscal year
2012 2011 2010 2009 2008 has been compiled based on
the equivalence criteria stipulated in Act JUS/206/2009. Where the provisions
of the Act did not establish relevant equivalence criteria.
|
|
EQUIVALENCIA |
EQUIVALENCIA |
EQUIVALENCIA |
EQUIVALENCIA |
EQUIVALENCIA |
|
|
ASSETS |
2012 |
2011 |
2010 |
2009 |
2008 |
|
|
A)
SHAREHOLDERS (PARTNERS) BY UNCALLED SUSCRIBED CAPITAL: |
0,00 |
0,00 |
0,00 |
0,00 |
0,00 |
|
|
B)
FIXED ASSETS: |
976.304,00 |
1.004.737,00 |
1.001.882,00 |
1.027.159,00 |
946.441,00 |
|
|
I. Formation expenses: |
0,00 |
0,00 |
0,00 |
0,00 |
0,00 |
|
|
II. Intangible fixed assets: |
301,00 |
301,00 |
301,00 |
301,00 |
301,00 |
|
|
1. Research and development costs: |
0,00 |
0,00 |
0,00 |
0,00 |
0,00 |
|
|
2. Concessions, patents, licences,
trademarks et al.: |
0,00 |
0,00 |
0,00 |
0,00 |
301,00 |
|
|
3. Goodwill: |
0,00 |
0,00 |
0,00 |
0,00 |
0,00 |
|
|
4. Key money paid for premises: |
0,00 |
0,00 |
0,00 |
0,00 |
0,00 |
|
|
5. Software: |
0,00 |
0,00 |
0,00 |
0,00 |
0,00 |
|
|
6. Assets under capital leases: |
0,00 |
0,00 |
0,00 |
0,00 |
0,00 |
|
|
7. Payments on account: |
0,00 |
0,00 |
0,00 |
0,00 |
0,00 |
|
|
8. Provisions: |
0,00 |
0,00 |
0,00 |
0,00 |
0,00 |
|
|
9. Accumulated depreciation: |
0,00 |
0,00 |
0,00 |
0,00 |
0,00 |
|
|
III. Tangible fixed assets: |
608.351,00 |
633.500,00 |
629.551,00 |
654.697,00 |
667.204,00 |
|
|
1. Land and construction: |
0,00 |
0,00 |
0,00 |
0,00 |
517.813,00 |
|
|
2. Technical installations and machinery:
|
0,00 |
0,00 |
0,00 |
0,00 |
105.164,00 |
|
|
3. Other installations, tools and
furniture: |
0,00 |
0,00 |
0,00 |
0,00 |
18.244,00 |
|
|
4. Payments on account and tangible fixed
assets under construction: |
0,00 |
0,00 |
0,00 |
0,00 |
0,00 |
|
|
5. Other tangible assets: |
0,00 |
0,00 |
0,00 |
0,00 |
25.983,00 |
|
|
6. Provisions: |
0,00 |
0,00 |
0,00 |
0,00 |
0,00 |
|
|
7. Accumulated depreciation: |
0,00 |
0,00 |
0,00 |
0,00 |
0,00 |
|
|
IV. Financial investments: |
367.652,00 |
370.937,00 |
372.031,00 |
372.161,00 |
278.937,00 |
|
|
1. Equity investments in group companies:
|
0,00 |
0,00 |
0,00 |
0,00 |
0,00 |
|
|
2. Receivables from group companies:
|
279.315,00 |
281.811,00 |
282.642,00 |
282.741,00 |
211.916,00 |
|
|
3. Equity investment in associated
companies: |
0,00 |
0,00 |
0,00 |
0,00 |
0,00 |
|
|
4. Credits to associated companies: |
0,00 |
0,00 |
0,00 |
0,00 |
0,00 |
|
|
5. Long-term securities portfolio: |
70.758,00 |
71.390,00 |
71.601,00 |
71.626,00 |
53.684,00 |
|
|
6. Other receivables: |
0,00 |
0,00 |
0,00 |
0,00 |
0,00 |
|
|
7. Long term guarantees and deposits:
|
17.579,00 |
17.736,00 |
17.789,00 |
17.795,00 |
13.337,00 |
|
|
8. Provisions: |
0,00 |
0,00 |
0,00 |
0,00 |
0,00 |
|
|
9. Long-term receivables from public
bodies: |
0,00 |
0,00 |
0,00 |
0,00 |
0,00 |
|
|
V. Own shares: |
0,00 |
0,00 |
0,00 |
0,00 |
0,00 |
|
|
VI. Long-term trade receivables: |
0,00 |
0,00 |
0,00 |
0,00 |
0,00 |
|
|
C)
Deferred expenses: |
0,00 |
0,00 |
0,00 |
0,00 |
0,00 |
|
|
D)
CURRENT ASSETS: |
4.483.429,00 |
5.148.270,00 |
5.059.755,00 |
4.389.555,00 |
5.410.341,00 |
|
|
I. Called-up share capital (not paid): |
0,00 |
380.370,00 |
436.324,00 |
107.822,00 |
0,00 |
|
|
II. Stocks: |
2.518.307,00 |
2.551.885,00 |
2.608.886,00 |
2.001.463,00 |
2.197.314,00 |
|
|
1. Goods for resale: |
2.451.437,00 |
2.484.123,00 |
2.539.611,00 |
1.948.317,00 |
2.138.968,00 |
|
|
2. Raw materials and other consumables:
|
66.870,00 |
67.761,00 |
69.275,00 |
53.146,00 |
58.346,00 |
|
|
3. Goods in process and semifinished ones:
|
0,00 |
0,00 |
0,00 |
0,00 |
0,00 |
|
|
4. Finished products: |
0,00 |
0,00 |
0,00 |
0,00 |
0,00 |
|
|
5. Byproducts, scrap and recovered
materials: |
0,00 |
0,00 |
0,00 |
0,00 |
0,00 |
|
|
6. Payments on account: |
0,00 |
0,00 |
0,00 |
0,00 |
0,00 |
|
|
7. Provisions: |
0,00 |
0,00 |
0,00 |
0,00 |
0,00 |
|
|
III. Debtors: |
1.550.384,00 |
1.707.788,00 |
1.611.034,00 |
1.732.835,00 |
2.573.604,00 |
|
|
1. Trade debtors / accounts receivable:
|
1.532.235,00 |
1.687.796,00 |
1.592.174,00 |
1.712.549,00 |
2.543.476,00 |
|
|
2. Accounts receivable, Group companies:
|
0,00 |
0,00 |
0,00 |
0,00 |
0,00 |
|
|
3. Accounts receivable, associated
companies: |
0,00 |
0,00 |
0,00 |
0,00 |
0,00 |
|
|
4. Other debtors: |
2.053,00 |
2.261,00 |
2.133,00 |
2.295,00 |
3.408,00 |
|
|
5. Staff: |
0,00 |
0,00 |
0,00 |
0,00 |
0,00 |
|
|
6. Public bodies: |
16.097,00 |
17.731,00 |
16.726,00 |
17.991,00 |
26.720,00 |
|
|
7. Provisions: |
0,00 |
0,00 |
0,00 |
0,00 |
0,00 |
|
|
IV. Short-term investments: |
252.545,00 |
260.192,00 |
294.119,00 |
1.408,00 |
22.178,00 |
|
|
1. Equity investments in group companies:
|
0,00 |
0,00 |
0,00 |
0,00 |
0,00 |
|
|
2. Receivables from group companies: |
252.545,00 |
260.192,00 |
294.119,00 |
1.408,00 |
22.178,00 |
|
|
3. Equity investment in associated
companies: |
0,00 |
0,00 |
0,00 |
0,00 |
0,00 |
|
|
4. Credits to associated companies: |
0,00 |
0,00 |
0,00 |
0,00 |
0,00 |
|
|
5. Short term securities portfolio: |
0,00 |
0,00 |
0,00 |
0,00 |
0,00 |
|
|
6. Other receivables: |
0,00 |
0,00 |
0,00 |
0,00 |
0,00 |
|
|
7. Shor term guarantees and deposits:
|
0,00 |
0,00 |
0,00 |
0,00 |
0,00 |
|
|
8. Provisions: |
0,00 |
0,00 |
0,00 |
0,00 |
0,00 |
|
|
V. Short-term treasury shares: |
0,00 |
0,00 |
0,00 |
0,00 |
0,00 |
|
|
VI. Cash at bank and in hand: |
162.193,00 |
248.035,00 |
109.392,00 |
546.027,00 |
617.245,00 |
|
|
VII. Prepayments and accrued income: |
0,00 |
0,00 |
0,00 |
0,00 |
0,00 |
|
|
GENERAL
TOTAL (A + B + C + D): |
5.459.732,00 |
6.153.007,00 |
6.061.638,00 |
5.416.713,00 |
6.356.783,00 |
|
MERCANTILE
REGISTRY.
|
|
EQUIVALENCIA |
EQUIVALENCIA |
EQUIVALENCIA |
EQUIVALENCIA |
EQUIVALENCIA |
|
|
LIABILITIES |
2012 |
2011 |
2010 |
2009 |
2008 |
|
|
A)
EQUITY: |
3.909.694,00 |
3.865.636,00 |
3.859.049,00 |
3.855.642,00 |
4.924.769,00 |
|
|
I. Subscribed capital: |
180.000,00 |
180.000,00 |
180.000,00 |
180.000,00 |
180.000,00 |
|
|
II. Share premium: |
1.906.886,00 |
1.906.886,00 |
1.906.886,00 |
1.906.886,00 |
1.906.886,00 |
|
|
III. Revaluation reserves: |
0,00 |
0,00 |
0,00 |
0,00 |
0,00 |
|
|
IV. Reserves: |
2.285.461,00 |
2.285.461,00 |
2.285.242,00 |
2.285.242,00 |
2.710.541,00 |
|
|
1. Legal reserve: |
30.354,00 |
30.354,00 |
30.351,00 |
30.351,00 |
36.000,00 |
|
|
2. Reserves for own shares: |
0,00 |
0,00 |
0,00 |
0,00 |
0,00 |
|
|
3. Reserves for shares of the controlling
company: |
0,00 |
0,00 |
0,00 |
0,00 |
0,00 |
|
|
4. Statutory reserves: |
0,00 |
0,00 |
0,00 |
0,00 |
0,00 |
|
|
5. Miscellaneous reserves: |
2.255.107,00 |
2.255.107,00 |
2.254.891,00 |
2.254.891,00 |
2.674.541,00 |
|
|
Differences due to capital adjustement to
euros: |
0,00 |
0,00 |
0,00 |
0,00 |
0,00 |
|
|
V. Profit or loss brought forward: |
-506.712,00 |
-513.080,00 |
-516.486,00 |
0,00 |
0,00 |
|
|
1. Retained earnings: |
-506.712,00 |
-513.080,00 |
-516.486,00 |
0,00 |
0,00 |
|
|
2. Prior year losses: |
0,00 |
0,00 |
0,00 |
0,00 |
0,00 |
|
|
3. Partners' contributions so as
to compensate losses: |
0,00 |
0,00 |
0,00 |
0,00 |
0,00 |
|
|
VI. Profit or loss for the financial year: |
44.058,00 |
6.368,00 |
3.406,00 |
-516.486,00 |
127.341,00 |
|
|
VII. Interim dividend paid: |
0,00 |
0,00 |
0,00 |
0,00 |
0,00 |
|
|
VIII. Own shares for capital reduction: |
0,00 |
0,00 |
0,00 |
0,00 |
0,00 |
|
|
B)
Deferred income: |
0,00 |
0,00 |
0,00 |
0,00 |
183,00 |
|
|
1. Capital grants: |
0,00 |
0,00 |
0,00 |
0,00 |
183,00 |
|
|
2. Unrealised exchange gains: |
0,00 |
0,00 |
0,00 |
0,00 |
0,00 |
|
|
3. Other deferred income: |
0,00 |
0,00 |
0,00 |
0,00 |
0,00 |
|
|
4. Public revenues to distribute in
several financial years: |
0,00 |
0,00 |
0,00 |
0,00 |
0,00 |
|
|
C)
PROVISIONS FOR LIABILITIES AND CHARGES: |
0,00 |
0,00 |
0,00 |
0,00 |
0,00 |
|
|
1. Provisions for pension fund and other similar
obligations: |
0,00 |
0,00 |
0,00 |
0,00 |
0,00 |
|
|
2. Provisions for taxes: |
0,00 |
0,00 |
0,00 |
0,00 |
0,00 |
|
|
3. Other provisions: |
0,00 |
0,00 |
0,00 |
0,00 |
0,00 |
|
|
4. Reversion fund: |
0,00 |
0,00 |
0,00 |
0,00 |
0,00 |
|
|
D)
LONG TERM LIABILITIES: |
142.713,00 |
216.624,00 |
309.956,00 |
438.935,00 |
280.759,00 |
|
|
I. Issued debentures and other marketable securities: |
0,00 |
0,00 |
0,00 |
0,00 |
0,00 |
|
|
1. Non-convertible debentures: |
0,00 |
0,00 |
0,00 |
0,00 |
0,00 |
|
|
2. Convertible debentures: |
0,00 |
0,00 |
0,00 |
0,00 |
0,00 |
|
|
3. Other debt securities: |
0,00 |
0,00 |
0,00 |
0,00 |
0,00 |
|
|
II. Amounts owed to credit institutions: |
130.097,00 |
202.793,00 |
305.110,00 |
431.940,00 |
273.514,00 |
|
|
1. Loans and other liabilities: |
130.097,00 |
202.793,00 |
305.110,00 |
431.940,00 |
273.514,00 |
|
|
2. Long-term liabilities from capital
leases: |
0,00 |
0,00 |
0,00 |
0,00 |
0,00 |
|
|
III. Debts with companies of the group and affiliated ones:
|
0,00 |
0,00 |
0,00 |
0,00 |
0,00 |
|
|
1. Amounts owed to group companies: |
0,00 |
0,00 |
0,00 |
0,00 |
0,00 |
|
|
2. Amounts owed to associated companies:
|
0,00 |
0,00 |
0,00 |
0,00 |
0,00 |
|
|
IV. Other creditors: |
12.616,00 |
13.831,00 |
4.846,00 |
6.995,00 |
7.245,00 |
|
|
1. Long-term bills of exchange payable:
|
0,00 |
0,00 |
0,00 |
0,00 |
0,00 |
|
|
2. Other creditors: |
0,00 |
0,00 |
0,00 |
0,00 |
0,00 |
|
|
3. Long term guarantees and deposits
received: |
0,00 |
0,00 |
0,00 |
0,00 |
0,00 |
|
|
4. Long term payables to public bodies:
|
12.616,00 |
13.831,00 |
4.846,00 |
6.995,00 |
7.245,00 |
|
|
V. Unpaid portion of equity investment: |
0,00 |
0,00 |
0,00 |
0,00 |
0,00 |
|
|
1. Group companies: |
0,00 |
0,00 |
0,00 |
0,00 |
0,00 |
|
|
2. Associated companies: |
0,00 |
0,00 |
0,00 |
0,00 |
0,00 |
|
|
3. Third parties: |
0,00 |
0,00 |
0,00 |
0,00 |
0,00 |
|
|
VI. Long term trade creditors: |
0,00 |
0,00 |
0,00 |
0,00 |
0,00 |
|
|
E)
SHORT TERM CREDITORS: |
1.407.325,00 |
2.070.748,00 |
1.892.633,00 |
1.122.136,00 |
1.151.073,00 |
|
|
I. Issued debentures and other marketable securities: |
2.930,00 |
2.939,00 |
0,00 |
0,00 |
0,00 |
|
|
1. Non-convertible debentures: |
2.930,00 |
2.939,00 |
0,00 |
0,00 |
0,00 |
|
|
2. Convertible debentures: |
0,00 |
0,00 |
0,00 |
0,00 |
0,00 |
|
|
3. Other debt securities: |
0,00 |
0,00 |
0,00 |
0,00 |
0,00 |
|
|
4. Accrued interest on debentures and
other debt securities: |
0,00 |
0,00 |
0,00 |
0,00 |
0,00 |
|
|
II. Amounts owed to credit institutions: |
560.460,00 |
606.102,00 |
890.730,00 |
574.264,00 |
249.688,00 |
|
|
1. Loans and other liabilities: |
560.460,00 |
606.102,00 |
890.730,00 |
574.264,00 |
249.688,00 |
|
|
2. Accrued interest on liabilities with
credit institutions: |
0,00 |
0,00 |
0,00 |
0,00 |
0,00 |
|
|
3. Short-term liabilities from capital
leases: |
0,00 |
0,00 |
0,00 |
0,00 |
0,00 |
|
|
III. Short-term amounts owed to group and associated companies:
|
0,00 |
0,00 |
0,00 |
0,00 |
0,00 |
|
|
1. Amounts owed to group companies: |
0,00 |
0,00 |
0,00 |
0,00 |
0,00 |
|
|
2. Amounts owed to associated companies:
|
0,00 |
0,00 |
0,00 |
0,00 |
0,00 |
|
|
IV. Trade creditors: |
843.936,00 |
1.461.707,00 |
1.001.903,00 |
547.872,00 |
875.966,00 |
|
|
1. Advanced payments from customers:
|
0,00 |
0,00 |
0,00 |
0,00 |
0,00 |
|
|
2. Amounts owed for purchases of goods or
services: |
575.407,00 |
1.049.376,00 |
872.892,00 |
389.367,00 |
875.966,00 |
|
|
3. Debts represented by notes payable:
|
268.528,00 |
412.330,00 |
129.011,00 |
158.505,00 |
0,00 |
|
|
V. Other creditors: |
0,00 |
0,00 |
0,00 |
0,00 |
25.418,00 |
|
|
1. Public bodies: |
0,00 |
0,00 |
0,00 |
0,00 |
25.418,00 |
|
|
2. Bills of exchange payable: |
0,00 |
0,00 |
0,00 |
0,00 |
0,00 |
|
|
3. Miscellaneous debts: |
0,00 |
0,00 |
0,00 |
0,00 |
0,00 |
|
|
4. Wages and salaries payable: |
0,00 |
0,00 |
0,00 |
0,00 |
0,00 |
|
|
5. Guarantees and deposits received at
short term: |
0,00 |
0,00 |
0,00 |
0,00 |
0,00 |
|
|
VI. Provisions: |
0,00 |
0,00 |
0,00 |
0,00 |
0,00 |
|
|
VII. Prepayments and accrued income: |
0,00 |
0,00 |
0,00 |
0,00 |
0,00 |
|
|
F)
SHORT-TERM PROVISIONS FOR LIABILITIES AND CHARGES: |
0,00 |
0,00 |
0,00 |
0,00 |
0,00 |
|
|
GENERAL
TOTAL (A + B + C + D + E + F): |
5.459.732,00 |
6.153.007,00 |
6.061.638,00 |
5.416.713,00 |
6.356.783,00 |
|
MERCANTILE
REGISTRY.
|
|
EQUIVALENCIA |
EQUIVALENCIA |
EQUIVALENCIA |
EQUIVALENCIA |
EQUIVALENCIA |
|
|
DEBIT |
2012 |
2011 |
2010 |
2009 |
2008 |
|
|
A)
CHARGES (A.1 to A.15): |
4.828.270,00 |
5.076.140,00 |
4.988.877,00 |
5.078.395,00 |
8.713.839,00 |
|
|
A.1. Stock reduction of both manufactured
goods and the ones in process: |
0,00 |
0,00 |
0,00 |
0,00 |
0,00 |
|
|
A.2. Supplies: |
3.556.477,00 |
3.735.242,00 |
3.654.410,00 |
3.524.309,00 |
6.907.576,00 |
|
|
a) Stock consumption:
|
3.367.830,00 |
3.537.112,00 |
3.460.568,00 |
3.337.368,00 |
6.541.176,00 |
|
|
b) Consumption of raw
materials and miscellaneous consumable ones: |
120.547,00 |
126.606,00 |
123.866,00 |
119.456,00 |
234.132,00 |
|
|
c) Miscellaneous
external expenditure: |
68.101,00 |
71.524,00 |
69.976,00 |
67.485,00 |
132.268,00 |
|
|
A.3. Staff costs: |
362.683,00 |
380.880,00 |
352.509,00 |
392.413,00 |
504.071,00 |
|
|
a) Wages, salaries et
al.: |
280.080,00 |
294.133,00 |
272.224,00 |
303.039,00 |
389.267,00 |
|
|
b) Social security
costs: |
82.602,00 |
86.747,00 |
80.285,00 |
89.374,00 |
114.804,00 |
|
|
A.4. Depreciation expense: |
29.046,00 |
40.345,00 |
32.419,00 |
49.605,00 |
91.949,00 |
|
|
A.5. Variation of trade provisions and
losses of unrecovered receivables: |
14.472,00 |
15.431,00 |
15.265,00 |
22.981,00 |
18.986,00 |
|
|
a) Stock provision
variation: |
0,00 |
0,00 |
0,00 |
0,00 |
0,00 |
|
|
b) Variation in
provision and bad debt losses: |
14.472,00 |
15.431,00 |
15.265,00 |
22.981,00 |
18.986,00 |
|
|
c) Variation of other
trade provisions: |
0,00 |
0,00 |
0,00 |
0,00 |
0,00 |
|
|
A.6. Other operating charges: |
811.206,00 |
864.989,00 |
855.668,00 |
1.288.189,00 |
1.064.223,00 |
|
|
a) External services:
|
785.273,00 |
837.337,00 |
828.314,00 |
1.247.009,00 |
1.030.202,00 |
|
|
b) Taxes: |
23.696,00 |
25.267,00 |
24.995,00 |
37.629,00 |
31.087,00 |
|
|
c) Other operating
expenses: |
2.236,00 |
2.385,00 |
2.359,00 |
3.551,00 |
2.934,00 |
|
|
d) Allocation to
revision fund: |
0,00 |
0,00 |
0,00 |
0,00 |
0,00 |
|
|
A.I. OPERATING BENEFITS
(B.1+B.2+B.3+B.4-A.1-A.2-A.3-A.4-A.5-A.6): |
38.561,00 |
29.443,00 |
6.248,00 |
0,00 |
155.567,00 |
|
|
A.7. Financial and similar charges: |
30.320,00 |
37.834,00 |
0,00 |
0,00 |
72.262,00 |
|
|
a) Due to liabilities
with companies of the group: |
30.320,00 |
37.834,00 |
0,00 |
0,00 |
0,00 |
|
|
b) Due to liabilities
with associated companies: |
0,00 |
0,00 |
0,00 |
0,00 |
0,00 |
|
|
c) Due to other
debts.: |
0,00 |
0,00 |
0,00 |
0,00 |
72.262,00 |
|
|
d) Losses from
financial investments: |
0,00 |
0,00 |
0,00 |
0,00 |
0,00 |
|
|
A.8. Changes in financial investment
provisions: |
11.106,00 |
1.097,00 |
32.585,00 |
25.633,00 |
5.389,00 |
|
|
A.9. Exchange losses: |
3.968,00 |
0,00 |
0,00 |
4.447,00 |
0,00 |
|
|
A.II. NET FINANCIAL INCOME (B.5+B.6+B.7+B.8-A.7-A.8-A.9):
|
0,00 |
0,00 |
1.250,00 |
0,00 |
0,00 |
|
|
A.III. PROFIT FROM ORDINARY ACTIVITIES (A.I+A.II-B.I-B.II):
|
6.950,00 |
5.293,00 |
7.498,00 |
0,00 |
150.088,00 |
|
|
A.10. Changes in provisions for
intangible, tangible and securities portfolio: |
-5.514,00 |
-1,00 |
-41,00 |
-6.279,00 |
0,00 |
|
|
A.11. Losses from tangible and intangible
fixed assets and securities portfolio: |
0,00 |
0,00 |
0,00 |
0,00 |
0,00 |
|
|
A.12. Losses from transactions with own
shares and debentures: |
0,00 |
0,00 |
0,00 |
0,00 |
0,00 |
|
|
A.13. Extraordinary expenses: |
0,00 |
0,00 |
0,00 |
0,00 |
0,00 |
|
|
A.14. Expenses and losses of former
financial years: |
0,00 |
0,00 |
0,00 |
0,00 |
0,00 |
|
|
A.IV. EXTRAORDINARY PROFIT
(B.9+B.10+B.11+B.12+B.13-A.10-A.11-A.12-A.13-A.14): |
51.615,00 |
1.400,00 |
41.971,00 |
28.400,00 |
26.636,00 |
|
|
A.V. PROFIT BEFORE TAXES (A.III+A.IV-B.III-B.IV): |
58.565,00 |
6.693,00 |
49.469,00 |
0,00 |
176.724,00 |
|
|
A.15. Corporation tax: |
14.507,00 |
325,00 |
46.063,00 |
-222.903,00 |
49.383,00 |
|
|
A.16. Miscellaneous taxes: |
0,00 |
0,00 |
0,00 |
0,00 |
0,00 |
|
|
A.VI. FINANCIAL YEAR RESULTS (PROFIT) (A.V-A.15-A.16): |
44.058,00 |
6.368,00 |
3.406,00 |
0,00 |
127.341,00 |
|
MERCANTILE
REGISTRY.
|
|
EQUIVALENCIA |
EQUIVALENCIA |
EQUIVALENCIA |
EQUIVALENCIA |
EQUIVALENCIA |
|
|
CREDIT |
2012 |
2011 |
2010 |
2009 |
2008 |
|
|
B)
INCOME ( B.1 to B.13): |
4.872.328,00 |
5.082.508,00 |
4.992.283,00 |
4.561.909,00 |
8.841.180,00 |
|
|
B.1. Net total sales: |
4.679.893,00 |
4.843.105,00 |
4.886.637,00 |
4.410.840,00 |
8.674.949,00 |
|
|
a) Sales: |
4.679.893,00 |
4.843.105,00 |
4.886.637,00 |
4.410.840,00 |
8.751.126,00 |
|
|
b) Rendering of
services: |
0,00 |
0,00 |
0,00 |
0,00 |
0,00 |
|
|
Returns and Rappel on
sales: |
0,00 |
0,00 |
0,00 |
0,00 |
-76.177,00 |
|
|
B.2. Stock increase of manufactured goods
and products in process: |
0,00 |
0,00 |
0,00 |
0,00 |
0,00 |
|
|
B.3. Works performed by the company for
fixed assets: |
0,00 |
0,00 |
0,00 |
0,00 |
0,00 |
|
|
B.4. Miscellaneous operating income:
|
132.551,00 |
223.224,00 |
29.882,00 |
103.926,00 |
67.423,00 |
|
|
a) Auxiliary income
and other from current management: |
121.935,00 |
205.346,00 |
27.488,00 |
95.602,00 |
62.023,00 |
|
|
b) Grants: |
10.616,00 |
17.878,00 |
2.393,00 |
8.324,00 |
5.400,00 |
|
|
c) Liabilities and
charges provisions surplus: |
0,00 |
0,00 |
0,00 |
0,00 |
0,00 |
|
|
B.I. PÉRDIDAS DE EXPLOTACIÓN
(A.1+A.2+A.3+A.4+A.5-A.6-B.1-B.2-B.3-B.4): |
0,00 |
0,00 |
0,00 |
762.731,00 |
0,00 |
|
|
B.5. Income from equity investment: |
319,00 |
304,00 |
240,00 |
579,00 |
1.506,00 |
|
|
a) In companies of
the group: |
0,00 |
0,00 |
0,00 |
0,00 |
0,00 |
|
|
b) In associated
companies: |
0,00 |
0,00 |
0,00 |
0,00 |
0,00 |
|
|
c) Third parties:
|
319,00 |
304,00 |
240,00 |
579,00 |
1.506,00 |
|
|
B.6. Income from other marketable
securities and long-term receivables: |
3.009,00 |
2.867,00 |
2.260,00 |
5.463,00 |
14.204,00 |
|
|
a) From companies of
the group: |
3.009,00 |
2.867,00 |
2.260,00 |
5.463,00 |
14.204,00 |
|
|
b) From associated
companies: |
0,00 |
0,00 |
0,00 |
0,00 |
0,00 |
|
|
c) From companies out
of the group: |
0,00 |
0,00 |
0,00 |
0,00 |
0,00 |
|
|
B.7. Miscellaneous interests or similar
income: |
10.455,00 |
9.960,00 |
7.853,00 |
18.980,00 |
49.349,00 |
|
|
a) From companies of
the group: |
0,00 |
0,00 |
0,00 |
0,00 |
0,00 |
|
|
b) From associated companies:
|
0,00 |
0,00 |
0,00 |
0,00 |
0,00 |
|
|
c) Miscellaneous
interests: |
10.455,00 |
9.960,00 |
7.853,00 |
18.980,00 |
49.349,00 |
|
|
d) Profit on
financial investment: |
0,00 |
0,00 |
0,00 |
0,00 |
0,00 |
|
|
B.8. Exchange positive differences: |
0,00 |
1.649,00 |
23.482,00 |
0,00 |
7.114,00 |
|
|
B.II. NEGATIVE FINANCIAL RESULTS (A.7+A.8+A.9-B.5-B.6-B.7-B.8):
|
31.611,00 |
24.150,00 |
0,00 |
5.059,00 |
5.479,00 |
|
|
B.III. LOSSES ON ORDINARY ACTIVITIES ( B.I + B.II - A.I - A.II
): |
0,00 |
0,00 |
0,00 |
767.790,00 |
0,00 |
|
|
B.9.Profit on disposal of both tangible
and intangible fixed assets and securities portfolio: |
0,00 |
0,00 |
0,00 |
0,00 |
0,00 |
|
|
B.10. Profit on transactions with own
shares and debentures: |
0,00 |
0,00 |
0,00 |
0,00 |
0,00 |
|
|
B.11. Capital grants transferred to profit
and loss: |
0,00 |
0,00 |
0,00 |
261,00 |
2.006,00 |
|
|
B.12. Extraordinary income: |
46.101,00 |
1.399,00 |
41.929,00 |
21.861,00 |
24.630,00 |
|
|
B.13. Income and profit of former
financial years: |
0,00 |
0,00 |
0,00 |
0,00 |
0,00 |
|
|
B.IV. NEGATIVE EXTRAORDINARY RESULTS
(A.10+A.11+A.12+A.13+A.14-B.9-B.10-B.11-B.12-B.13): |
0,00 |
0,00 |
0,00 |
0,00 |
0,00 |
|
|
B.V. LOSSES BEFORE TAXES (B.III+B.IV-A.III-A.IV): |
0,00 |
0,00 |
0,00 |
739.390,00 |
0,00 |
|
|
B.VI. RESULT OF THE PERIOD (LOSSES) (B.V+A.15+A.16): |
0,00 |
0,00 |
0,00 |
516.486,00 |
0,00 |
|
MERCANTILE
REGISTRY.
CASHFLOW STATEMENT
Model: Normal
>
Source of information: Data contained in this section is taken from the
information declared in the Annual Accounts submitted to the Trade Register.
|
|
2012 |
2011 |
2010 |
2009 |
2008 |
|
|
1.
Fiscal year result before taxes.: 61100 |
58.565,00 |
6.693,00 |
49.469,00 |
-739.390,00 |
176.724,00 |
|
|
2.
Results adjustments.: 61200 |
45.583,00 |
65.047,00 |
22.065,00 |
234.277,00 |
110.985,00 |
|
|
a) Fixed Assets Amortization (+).: 61201 |
29.046,00 |
40.345,00 |
32.419,00 |
49.605,00 |
91.949,00 |
|
|
b) Obsolescence Allowances (+/-). : 61202 |
0,00 |
0,00 |
0,00 |
185.940,00 |
18.986,00 |
|
|
d) Allocation of grants (-).: 61204 |
0,00 |
0,00 |
0,00 |
-261,00 |
-2.006,00 |
|
|
e) Results on disposal of fixed assets (+/-). : 61205 |
0,00 |
0,00 |
0,00 |
-6.279,00 |
0,00 |
|
|
g) Financial income (-).: 61207 |
-13.783,00 |
-13.131,00 |
-10.353,00 |
-25.021,00 |
-65.058,00 |
|
|
h) Financial Expenses (+). : 61208 |
30.320,00 |
37.834,00 |
0,00 |
25.846,00 |
72.262,00 |
|
|
i) Exchange differences (+/-). : 61209 |
0,00 |
0,00 |
0,00 |
4.447,00 |
-7.114,00 |
|
|
k) Other income and expense (-/+). : 61211 |
0,00 |
0,00 |
0,00 |
0,00 |
1.967,00 |
|
|
3.
Changes in current capital equity.: 61300 |
-70.408,00 |
510.895,00 |
-748.757,00 |
425.176,00 |
-335.277,00 |
|
|
a) Stock (+/-).: 61301 |
33.578,00 |
57.002,00 |
-607.424,00 |
195.851,00 |
-110.374,00 |
|
|
d) Debtors and other accounts receivable (+/-). : 61302 |
520.645,00 |
-39.512,00 |
-256.592,00 |
582.838,00 |
-158.093,00 |
|
|
c) Other current assets (+/-). : 61303 |
7.647,00 |
33.928,00 |
-292.711,00 |
0,00 |
0,00 |
|
|
d) Creditors and other accounts payable (+/-). : 61304 |
-632.278,00 |
459.478,00 |
407.969,00 |
-353.513,00 |
-66.811,00 |
|
|
4.
Other cash flows for operating activities.: 61400 |
-16.537,00 |
-24.702,00 |
10.353,00 |
-10.813,00 |
-99.369,00 |
|
|
a) Interest payments (-). : 61401 |
-30.320,00 |
-37.834,00 |
0,00 |
-25.846,00 |
-72.262,00 |
|
|
c) Interest collection (+). : 61403 |
13.783,00 |
13.131,00 |
10.353,00 |
25.021,00 |
65.058,00 |
|
|
d) Income tax payment collection (payments) (+/-).: 61404 |
0,00 |
0,00 |
0,00 |
-9.988,00 |
-92.166,00 |
|
|
5.
Operating activity cash flows (1 + 2 + 3 + 4) : 61500 |
17.203,00 |
557.933,00 |
-666.869,00 |
-90.749,00 |
-146.938,00 |
|
|
6.
Payments for investment (-).: 62100 |
0,00 |
-5.237,00 |
0,00 |
-372.408,00 |
0,00 |
|
|
a) Companies of the group and affiliates. : 62101 |
0,00 |
0,00 |
0,00 |
-258.982,00 |
0,00 |
|
|
c) Fixed assets. : 62103 |
0,00 |
-3.949,00 |
0,00 |
-42.820,00 |
0,00 |
|
|
e) Other financial assets. : 62105 |
0,00 |
0,00 |
0,00 |
-70.607,00 |
0,00 |
|
|
h) Other assets. : 62108 |
0,00 |
-1.288,00 |
0,00 |
0,00 |
0,00 |
|
|
7.
Divestment payment collection (+). : 62200 |
45.563,00 |
1.094,00 |
75.167,00 |
6.000,00 |
450.000,00 |
|
|
c) Fixed assets. : 62203 |
25.149,00 |
0,00 |
25.146,00 |
6.000,00 |
0,00 |
|
|
e) Other financial assets. : 62205 |
3.285,00 |
1.094,00 |
130,00 |
0,00 |
450.000,00 |
|
|
h) Other assets. : 62208 |
17.129,00 |
0,00 |
49.891,00 |
0,00 |
0,00 |
|
|
8.
Investment activity cash flows (6 + 7) minus Amortization: 62300 |
16.517,00 |
-44.487,00 |
42.748,00 |
-366.408,00 |
450.000,00 |
|
|
9.
Payment collection and payments for equity instruments. : 63100 |
0,00 |
219,00 |
0,00 |
0,00 |
0,00 |
|
|
a) Issuance of equity instruments (+). : 63101 |
0,00 |
219,00 |
0,00 |
0,00 |
115.281,00 |
|
|
10.
Payment collection and payments for financial liabilities instruments.:
63200 |
-119.562,00 |
-375.021,00 |
187.486,00 |
442.914,00 |
-510.944,00 |
|
|
a) Issuance : 63201 |
0,00 |
11.924,00 |
316.466,00 |
1.291.083,00 |
251.624,00 |
|
|
2. Debts incurred with credit institutions (+). : 63203 |
0,00 |
0,00 |
316.466,00 |
1.291.083,00 |
204.398,00 |
|
|
3. Debts incurred with companies of the group and affiliates
(+).: 63204 |
0,00 |
0,00 |
0,00 |
0,00 |
47.226,00 |
|
|
5. Other debts (+). : 63206 |
0,00 |
11.924,00 |
0,00 |
0,00 |
0,00 |
|
|
b) Repayment and amortization of : 63207 |
-119.562,00 |
-386.945,00 |
-128.979,00 |
-848.169,00 |
-762.568,00 |
|
|
2. Debts incurred with credit institutions (-).: 63209 |
-118.338,00 |
-386.945,00 |
-126.830,00 |
-848.169,00 |
-752.634,00 |
|
|
3. Debts incurred with companies of the group and affiliates
(-). : 63210 |
0,00 |
0,00 |
0,00 |
0,00 |
-9.933,00 |
|
|
5. Other debts (-). : 63212 |
-1.224,00 |
0,00 |
-2.150,00 |
0,00 |
0,00 |
|
|
11.
Payments from dividends and remunerations from other assets instruments. :
63300 |
0,00 |
0,00 |
0,00 |
-52.528,00 |
-196.980,00 |
|
|
a) Dividends (-).: 63301 |
0,00 |
0,00 |
0,00 |
-52.528,00 |
-196.980,00 |
|
|
12.
Cash flows for financing activities (9+10+11).: 63400 |
-119.562,00 |
-374.802,00 |
187.486,00 |
390.386,00 |
-707.924,00 |
|
|
D)
EFECTO DE LAS VARIACIONES DE LOS TIPOS DE CAMBIO: 64000 |
0,00 |
0,00 |
0,00 |
-4.447,00 |
7.114,00 |
|
|
E)
NET INCREASE/DECREASE OF CASH OR EQUIVALENT ASSETS (+/-5+/-8+/12+/-D) :
65000 |
-85.842,00 |
138.644,00 |
-436.635,00 |
-71.219,00 |
-397.748,00 |
|
|
Cash or equivalent assets as of beginning of the fiscal year.:
65100 |
248.035,00 |
109.392,00 |
546.027,00 |
617.245,00 |
1.014.993,00 |
|
|
Cash or equivalent assets as of end of the fiscal year.:
65200 |
162.193,00 |
248.035,00 |
109.392,00 |
546.027,00 |
617.245,00 |
|
FINANCIAL DIAGNOSIS
>
Economic-Financial Comparative Analysis
Data used in the following ratios and indicators is taken from the
Annual Accounts submitted by the company to the TRADE REGISTER.
>
Comparison within the Sector
|
Cash
Flow |
2012 |
2011 |
Variación
2012 - 2011 |
|
|||
|
|
Empresa |
Sector |
Empresa |
Sector |
Empresa |
Sector |
|
|
Cash
Flow over Sales: |
-0,02
% |
0,02
% |
0,03
% |
0,14
% |
-164,08
% |
-85,56
% |
|
|
EBITDA
over Sales: |
1,44
% |
0,05
% |
1,44
% |
5,98
% |
0,25
% |
-99,23
% |
|
|
Cash
Flow Yield: |
-0,02
% |
0,00
% |
0,02
% |
0,03
% |
-169,78
% |
-86,16
% |
|
|
Profitability |
2012 |
2011 |
Variación
2012 - 2011 |
|
|||
|
|
Empresa |
Sector |
Empresa |
Sector |
Empresa |
Sector |
|
|
Operating
economic profitability: |
0,91
% |
-3,15
% |
0,57
% |
0,35
% |
58,99
% |
-1.003,88
% |
|
|
Total
economic profitability: |
1,63
% |
-1,72
% |
0,72
% |
-0,19
% |
124,97
% |
-814,85
% |
|
|
Financial
profitability: |
1,13
% |
-6,30
% |
0,16
% |
-3,85
% |
584,11
% |
-63,75
% |
|
|
Margin:
|
0,92
% |
-6,06
% |
0,58
% |
0,70
% |
57,54
% |
-960,37
% |
|
|
Mark-up:
|
0,26
% |
-13,34
% |
0,10
% |
-6,92
% |
147,85
% |
-92,81
% |
|
|
Solvency |
2012 |
2011 |
Variación
2012 - 2011 |
|
|||
|
|
Empresa |
Sector |
Empresa |
Sector |
Empresa |
Sector |
|
|
Liquidity:
|
0,12 |
0,16 |
0,12 |
0,13 |
-3,78 |
19,84 |
|
|
Acid
Test: |
1,28 |
0,86 |
1,17 |
0,84 |
9,84 |
2,01 |
|
|
Working
Capital / Investment: |
0,53 |
0,08 |
0,47 |
0,11 |
13,31 |
-28,27 |
|
|
Solvency:
|
3,19 |
1,43 |
2,49 |
1,50 |
28,14 |
-4,91 |
|
|
Indebtedness |
2012 |
2011 |
Variación
2012 - 2011 |
|
|||
|
|
Empresa |
Sector |
Empresa |
Sector |
Empresa |
Sector |
|
|
Indebtedness
level: |
0,40 |
1,04 |
0,59 |
1,32 |
-33,00 |
-20,65 |
|
|
Borrowing
Composition: |
0,10 |
1,21 |
0,10 |
1,24 |
-3,06 |
-2,48 |
|
|
Repayment
Ability: |
-18,06 |
109,01 |
16,50 |
16,79 |
-209,45 |
549,12 |
|
|
Warranty:
|
3,52 |
1,96 |
2,69 |
1,76 |
30,94 |
11,34 |
|
|
Generated
resources / Total creditors: |
0,05 |
-0,01 |
0,02 |
0,01 |
159,89 |
-184,53 |
|
|
Efficiency |
2012 |
2011 |
Variación
2012 - 2011 |
|
|||
|
|
Empresa |
Sector |
Empresa |
Sector |
Empresa |
Sector |
|
|
Productivity:
|
1,19 |
1,00 |
1,18 |
1,27 |
0,27 |
-21,31 |
|
|
Turnover
of Collection Rights : |
3,45 |
3,49 |
3,30 |
3,45 |
4,55 |
1,42 |
|
|
Turnover
of Payment Entitlements: |
5,19 |
2,39 |
3,16 |
2,24 |
64,44 |
6,75 |
|
|
Stock
rotation: |
1,90 |
2,30 |
1,97 |
1,72 |
-3,96 |
33,48 |
|
|
Assets
turnover: |
0,99 |
0,52 |
0,99 |
0,49 |
0,92 |
5,06 |
|
|
Borrowing
Cost: |
1,96 |
2,82 |
1,65 |
2,81 |
18,26 |
0,06 |
|
>
Trend of indicators under the General Accounting Plan of 2007 (2012, 2011,
2010, 2009, 2008)
|
Cash
Flow |
2012 |
2011 |
2010 |
2009 |
2008 |
|
|
Cash
Flow over Sales: |
-0,02
% |
0,03
% |
-0,09
% |
-1,61
% |
-4,59
% |
|
|
EBITDA
over Sales: |
1,44
% |
1,44
% |
0,79
% |
-16,17
% |
2,85
% |
|
|
Cash
Flow Yield: |
-0,02
% |
0,02
% |
-0,07
% |
-1,31
% |
-6,26
% |
|
|
Profitability |
2012 |
2011 |
2010 |
2009 |
2008 |
|
|
Operating
economic profitability: |
0,91
% |
0,57
% |
0,13
% |
-14,99
% |
2,60
% |
|
|
Total
economic profitability: |
1,63
% |
0,72
% |
0,82
% |
-13,17
% |
3,92
% |
|
|
Financial
profitability: |
1,13
% |
0,16
% |
0,09
% |
-13,40
% |
2,59
% |
|
|
Margin:
|
0,92
% |
0,58
% |
0,13
% |
-16,75
% |
1,80
% |
|
|
Mark-up:
|
0,26
% |
0,10
% |
0,15
% |
-16,86
% |
-0,34
% |
|
|
Solvency |
2012 |
2011 |
2010 |
2009 |
2008 |
|
|
Liquidity:
|
0,12 |
0,12 |
0,06 |
0,49 |
0,54 |
|
|
Acid
Test: |
1,28 |
1,17 |
1,20 |
1,93 |
2,79 |
|
|
Working
Capital / Investment: |
0,53 |
0,47 |
0,49 |
0,60 |
0,67 |
|
|
Solvency:
|
3,19 |
2,49 |
2,67 |
3,91 |
4,70 |
|
|
Indebtedness |
2012 |
2011 |
2010 |
2009 |
2008 |
|
|
Indebtedness
level: |
0,40 |
0,59 |
0,57 |
0,40 |
0,29 |
|
|
Borrowing
Composition: |
0,10 |
0,10 |
0,16 |
0,39 |
0,24 |
|
|
Repayment
Ability: |
-18,06 |
16,50 |
-5,04 |
-3,09 |
6,07 |
|
|
Warranty:
|
3,52 |
2,69 |
2,75 |
3,47 |
4,44 |
|
|
Generated
resources / Total creditors: |
0,05 |
0,02 |
0,02 |
-0,30 |
0,16 |
|
|
Efficiency |
2012 |
2011 |
2010 |
2009 |
2008 |
|
|
Productivity:
|
1,19 |
1,18 |
1,11 |
-0,82 |
1,49 |
|
|
Turnover
of Collection Rights : |
3,45 |
3,30 |
3,42 |
2,79 |
3,40 |
|
|
Turnover
of Payment Entitlements: |
5,19 |
3,16 |
4,52 |
8,83 |
8,87 |
|
|
Stock
rotation: |
1,90 |
1,97 |
1,88 |
2,64 |
3,91 |
|
|
Assets
turnover: |
0,99 |
0,99 |
0,99 |
0,90 |
1,44 |
|
|
Borrowing
Cost: |
1,96 |
1,65 |
0,00 |
1,66 |
5,05 |
|
COMPARATIVE SECTORIAL BALANCE
Sector-based
Comparison under the rules of the New General Accounting Plan.
|
|
Variación
- |
|
|
|
Empresa |
Sector |
|
|
Variación
- |
|
|
|
Empresa |
Sector |
|
|
Variación
- |
|
|
|
Empresa |
Sector |
Public Tenders and
Works Won
No Public Tenders assigned to the name of the company.
Detail of Subsidies appearing in Balances Memories
|
Entity |
ORGANISMO
NO ESPECIFICADO |
|
Status |
CONCEDIDA |
|
Amount
Granted |
3.832,51 |
|
Notes |
El
importe reflejado corresponde al traspasado a resultados durante el
ejercicio. |
|
Entity |
ORGANISMO
NO ESPECIFICADO |
|
Status |
CONCEDIDA |
|
Amount
Granted |
4.606,68 |
|
Notes |
El
importe reflejado corresponde al traspasado a resultados durante el
ejercicio. |
|
Entity |
ORGANISMO
NO ESPECIFICADO |
|
Status |
CONCEDIDA |
|
Amount
Granted |
5.220,24 |
|
Notes |
IMPORTE
IMPUTADO A RESULTADOS DEL EJERCICIO |
|
Research Summary |
|
The company MARMOLSPAIN SL with VAT No. B53754503 was incorporated in Alicante in March, 2003. It is an indefinite duration company engaged in the Cutting, shaping and finishing of stone. After analyzing the information in our possession and 2012 financial information, it is estimated that the overall structure is favourable. |
|
Sources |
|
Registry of Commerce''s Official Gazette. Own and external data bases Company References Investigación |
FOREIGN EXCHANGE RATES
|
Currency |
Unit
|
Indian Rupees |
|
US Dollar |
1 |
Rs.61.94 |
|
UK Pound |
1 |
Rs.103.31 |
|
Euro |
1 |
Rs.85.11 |
INFORMATION DETAILS
|
Report Prepared
by : |
MNL |
RATING EXPLANATIONS
|
RATING |
STATUS |
PROPOSED CREDIT LINE |
|
|
|
>86 |
Aaa |
Possesses an extremely sound financial base with the strongest capability
for timely payment of interest and principal sums |
Unlimited |
|
|
71-85 |
Aa |
Possesses adequate working capital. No caution needed for credit
transaction. It has above average (strong) capability for payment of interest
and principal sums |
Large |
|
|
56-70 |
A |
Financial & operational base are regarded healthy. General
unfavourable factors will not cause fatal effect. Satisfactory capability for
payment of interest and principal sums |
Fairly Large |
|
|
41-55 |
Ba |
Overall operation
is considered normal. Capable to meet normal commitments. |
Satisfactory |
|
|
26-40 |
B |
Capability to overcome financial difficulties seems comparatively
below average. |
Small |
|
|
11-25 |
Ca |
Adverse factors are apparent. Repayment of interest and principal sums
in default or expected to be in default upon maturity |
Limited with
full security |
|
|
<10 |
C |
Absolute credit risk exists. Caution needed to be exercised |
Credit not
recommended |
|
|
-- |
NB |
New Business |
-- |
|
This score serves as a reference to assess SC’s credit risk
and to set the amount of credit to be extended. It is calculated from a
composite of weighted scores obtained from each of the major sections of this
report. The assessed factors and their relative weights (as indicated through
%) are as follows:
Financial
condition (40%) Ownership
background (20%) Payment
record (10%)
Credit history
(10%) Market trend
(10%) Operational
size (10%)
This report is issued at your request without any risk
and responsibility on the part of MIRA INFORM PRIVATE LIMITED (MIPL) or its
officials.