MIRA
INFORM REPORT
|
Report Date : |
06.01.2014 |
IDENTIFICATION DETAILS
|
Name : |
GRAND CHEMICAL LIMITED PARTNERSHIP |
|
|
|
|
Registered Office : |
321/18
Nanglinchee Road, Chongnonsee, Yannawa, Bangkok
10120 |
|
|
|
|
Country : |
Thailand |
|
|
|
|
Financials (as on) : |
31.12.2012 |
|
|
|
|
Date of Incorporation : |
22.02.1982 |
|
|
|
|
Reg. No.: |
0103525005589 |
|
|
|
|
Legal Form : |
Limited Partnership |
|
|
|
|
Line of Business : |
Importer & Distributor of Industrial Chemicals |
|
|
|
|
No. of Employees : |
100 |
RATING & COMMENTS
|
MIRA’s Rating : |
Ba |
|
RATING |
STATUS |
PROPOSED CREDIT LINE |
|
|
41-55 |
Ba |
Overall operation is considered normal. Capable to meet normal
commitments. |
Satisfactory |
|
Status : |
Satisfactory |
|
|
|
|
Payment Behaviour : |
Slow but Correct |
|
|
|
|
Litigation : |
Clear |
NOTES :
Any query related to this report can be made
on e-mail : infodept@mirainform.com
while quoting report number, name and date.
ECGC Country Risk Classification List – September 30, 2013
|
Country Name |
Previous Rating (30.06.2013) |
Current Rating (30.09.2013) |
|
Thailand |
B1 |
B1 |
|
Risk Category |
ECGC
Classification |
|
Insignificant |
A1 |
|
Low |
A2 |
|
Moderate |
B1 |
|
High |
B2 |
|
Very High |
C1 |
|
Restricted |
C2 |
|
Off-credit |
D |
THAILAND - ECONOMIC OVERVIEW
With a well-developed infrastructure, a free-enterprise
economy, generally pro-investment policies, and strong export industries,
Thailand achieved steady growth due largely to industrial and agriculture
exports - mostly electronics, agricultural commodities, automobiles and parts,
and processed foods. Thailand is trying to maintain growth by encouraging
domestic consumption and public investment to offset weak exports in 2012.
Unemployment, at less than 1% of the labor force, stands as one of the lowest
levels in the world, which puts upward pressure on wages in some industries.
Thailand also attracts nearly 2.5 million migrant workers from neighboring
countries. The Thai government is implementing a nation-wide 300 baht ($10) per
day minimum wage policy and deploying new tax reforms designed to lower rates
on middle-income earners. The Thai economy has weathered internal and external
economic shocks in recent years. The global economic crisis severely cut
Thailand's exports, with most sectors experiencing double-digit drops. In 2009,
the economy contracted 2.3%. However, in 2010, Thailand's economy expanded
7.8%, its fastest pace since 1995, as exports rebounded. In late 2011 growth
was interrupted by historic flooding in the industrial areas in Bangkok and its
five surrounding provinces, crippling the manufacturing sector. Industry
recovered from the second quarter of 2012 onward with GDP growth at 5.5% in
2012. The government has approved flood mitigation projects worth $11.7
billion, which were started in 2012, to prevent similar economic damage, and an
additional $75 billion for infrastructure over the next seven years with a plan
to start in 2013.
|
Source
: CIA |
Company name
GRAND CHEMICAL
LIMITED PARTNERSHIP
SUMMARY
BUSINESS ADDRESS : 321/18
NANGLINCHEE ROAD, CHONGNONSEE,
YANNAWA, BANGKOK
10120, THAILAND
TELEPHONE : [66] 2678-3700-3,
2286-0062, 2286-0059
FAX : [66] 2278-0702,
2678-3704
E-MAIL ADDRESS : grandkem@grandkem.com
REGISTRATION ADDRESS : SAME AS BUSINESS
ADDRESS
ESTABLISHED : 1982
REGISTRATION NO. : 0103525005589
TAX ID NO. : 3102272733
CAPITAL REGISTERED : BHT.
6,000,000
CAPITAL PAID-UP : BHT.
6,000,000
PARTNER’S PROPORTION : THAI : 100%
FISCAL YEAR CLOSING DATE : DECEMBER 31
LEGAL STATUS : LIMITED PARTNERSHIP
EXECUTIVE : MR.
ANUN PICHAYASAJJA, THAI
MANAGING PARTNER
NO. OF STAFF : 100
LINES OF BUSINESS : INDUSTRIAL CHEMICALS
IMPORTER &
DISTRIBUTOR
CORPORATE PROFILE
OPERATING TREND : STABLE
PRESENT SITUATION : OPERATING NORMALLY
REPUTATION : GOOD
WITH NORMAL BUSINESS
ENGAGEMENT
MANAGEMENT STANDARD : MANAGEMENT
WITH FAIR PERFORMANCE
HISTORY
The subject was
established on February 22, 1982
as a limited
partnership under the
name style GRAND
CHEMICAL LIMITED PARTNERSHIP,
by Mr. Anun Pichayasajja and partners, in order to import
and distribute industrial chemicals
to local market.
Subject currently employs approximately 100
staff.
The subject’s registered
address is 321/18
Nanglinchee Rd.,
Chongnonsee, Yannawa, Bangkok
10120, and this
is the subject’s
operation address.
AUTHORIZED PERSON
Mr. Anun Pichayasajja signs on
behalf of the subject
with seal affixed.
He also bears
full financial responsibility by
law.
MANAGEMENT
Mr. Anun Pichayasajja
is the Managing
Partner.
He is Thai
nationality with the
age of 63
years old.
Mr. Somnuek Kanwuthikul
is the Sales
Manager.
He is Thai
nationality.
BUSINESS OPERATIONS
The subject’s activities
are importer and
distributor various kinds
of industrial chemicals,
with over 200
items as the followings:
Agricultural Chemical and
Animal Feed Additives
Sodium Bicarbonate [Feed] Grade, Potassium Chloride, Cobalt Sulphate,
Magnesium Sulphate, Manganese
Sulphate and etc.
Cleaning Chemicals
Specific Food &
Additives
STPP Food Grade Citric Acid, Sodium Citrate, Xanthan Gum, Tartaric Acid, of Tartar, Sodium Bicarbonate, Food Grade, Calcium Chloride Food Grade and etc.
Animal Feed
Minerals, vitamin and
feed ingredient
Foods
Food ingredient & food additive
Others
Electroplating,
Construction, Tannery, Water
treatment, Printing, Pharmaceutical, Consumer
goods and etc.
PURCHASE
80% of the
products is imported
from Republic of China, Japan,
Taiwan, India, Germany, United
Kingdom, France, Belgium, United States
of America and
Netherlands, the remaining
20% is purchased
from local suppliers.
MAJOR SUPPLIERS
|
Name |
Country |
|
|
|
|
B A S F |
: Germany |
|
Chemicals of Mitsubishi
Corp. |
: Japan |
|
Arco Chemical Ltd. |
: Japan |
|
Dow Chemical Inc. |
: U.S.A. |
|
Tembec Avebene S.A. |
: France |
|
Thermphos International BV. |
: Netherlands |
|
Solvay S.A. |
: Belgium |
|
Brotherton Ltd. |
: U.K. |
|
Molymet Inc. |
: U.S.A. |
|
Ineos Group |
: U.K. |
|
K & S Group |
: Germany |
|
Jungbunzlauer AG. |
: Germany |
|
Bayer Thai Co.,
Ltd. |
: Thailand |
|
OMG Group Inc. |
: U.S.A. |
|
Aragonesas Agro S.A. |
: Spain |
SALES [LOCAL]
100% of its
products is sold
locally to manufacturers, wholesalers,
Thai Government and
end-users.
MAJOR CUSTOMERS
Ministry of Public
Health : Thailand
Betagro Group : Thailand
CP group of
companies : Thailand
RELATED/AFFILIATED COMPANIES
Grand Chemical Fareast
Ltd.
Business Type :
Importer and distributor
of industrial chemicals
Ecograng Co., Ltd.
Business Type :
Importer and distributor
of industrial chemicals
LITIGATION
Bankruptcy and Receivership
There are no
litigation on bankruptcy
and receivership cases
filed against the
subject found at
Legal Execution Department
for the past
five years.
Others
There are no
legal suits filed
against the subject
for the past
two years.
CREDIT
Sales are by
cash or on
the credits term
of 30-60 days.
Local bills are
paid by cash
or on the
credits term of
30-60 days.
Imports are by
L/C at sight
or on the
credit term of
120 days &
T/T.
BANKING
Bangkok Bank Public
Co., Ltd.
[Bangkapi Branch : Sukhumvit
Rd., Klongtonnua, Wattana,
Bangkok]
EMPLOYMENT
The subject employs
approximately 100 staff.
LOCATION DETAILS
The premise is
owned for administrative office
and warehouse in
a 3 storey
building of 2 row shop houses
at the heading
address. Premise is
located in commercial/residential area.
Warehouse is located
at 9/2-4 Moo
13, Lamlukka Rd.,
Klong 9, T. Bungthonglang,
A. Lamlukka, Pathumthani
12150. Tel : [66]
2150-7601-8, Fax :
[66] 2150-0760
COMMENT
Demand of industrial chemicals has continued increasing since last year.
Domestic consumption remains strong
from industrial improvement.
Its business is
strong and remains
profitable. The subject’s business
is growing subsequently
on a yearly basis in
line with the
effective market expansion of
industrial sector.
Despite consumption from
industrial sector has
been slowing down,
subject’s business remains
promising.
FINANCIAL INFORMATION
The capital was
initially registered at
Bht. 3,000,000, which was
carried by 3
persons as followed:
Mr. Pithaya Pichayasajja Bht. 900,000
Ms. Chamaiporn Pichayasajja Bht. 450,000
Mr. Anun Pichayasajja Bht 1,650,000
[Unlimited Partner]
On December 27,
2001, the capital
was increased to Bht.
6,000,000 which was
carried by 3
persons as followed:
Name Age Amount
Mr. Pithaya Pichayasajja 66 Bht. 1,400,000
Ms. Chamaiporn Pichayasajja 73 Bht. 1,800,000
Mr. Anun Pichayasajja 63 Bht. 2,800,000
[Unlimited Partner]
NAME OF AUDITOR & CERTIFIED PUBLIC
ACCOUNTANT NO.
Mr. Boonchai Chintakaviwat No.
4670
BALANCE SHEET [BAHT]
The latest
financial figures published
for December 31,
2012, 2011 & 2010
were:
ASSETS
|
Current Assets |
2012 |
2011 |
2010 |
|
|
|
|
|
|
Cash and Cash Equivalents |
70,918.25 |
849,139.47 |
127,378.90 |
|
Short-term Investment-Fixed
Deposit |
1,071,267.15 |
1,052,533.59 |
1,037,353.64 |
|
Trade Accounts & Other
Receivable |
30,610,540.82 |
33,869,237.23 |
27,308,555.84 |
|
Inventories-Finished Goods |
34,352,374.55 |
31,724,855.79 |
13,065,432.21 |
|
|
|
|
|
|
Total Current Assets
|
66,105,100.77 |
67,495,766.08 |
41,538,720.59 |
|
Fixed Assets |
45,713,630.16 |
49,874,866.88 |
25,956,554.35 |
|
Other Non-current Assets |
86,400.00 |
364,607.29 |
476,845.61 |
|
Total Assets |
111,905,130.93 |
117,735,240.25 |
67,972,120.55 |
LIABILITIES &
SHAREHOLDERS' EQUITY [BAHT]
|
Current
Liabilities |
2012 |
2011 |
2010 |
|
|
|
|
|
|
Bank Overdraft &
Short-term Loan from Financial Institution |
20,617,058.55 |
31,802,175.14 |
17,337,668.12 |
|
Trade Accounts &
Other Payable |
8,491,994.72 |
7,233,342.47 |
2,222,375.02 |
|
Short-term Loan |
38,340,000.00 |
35,720,642.53 |
12,538,792.66 |
|
Accrued Income Tax |
- |
1,302,038.21 |
2,892,320.88 |
|
Other Current Liabilities |
1,031,241.43 |
1,031,241.43 |
1,006,108.68 |
|
|
|
|
|
|
Total Current Liabilities |
68,480,294.70 |
77,089,439.78 |
35,997,265.36 |
|
Other Non-current Liabilities |
467,738.54 |
1,403,213.78 |
- |
|
Total Liabilities |
68,948,033.24 |
78,609,989.78 |
35,997,265.36 |
|
|
|
|
|
|
Shareholders' Equity |
|
|
|
|
|
|
|
|
|
Capital Paid |
6,000,000.00 |
6,000,000.00 |
6,000,000.00 |
|
Retained Earning -
Unappropriated |
36,957,097.69 |
33,242,586.69 |
25,974,855.19 |
|
Total Shareholders' Equity |
42,957,097.69 |
39,242,586.69 |
31,974,855.19 |
|
Total Liabilities &
Shareholders' Equity |
111,905,130.93 |
117,735,240.25 |
67,972,120.55 |
PROFIT & LOSS ACCOUNT
|
Revenue |
2012 |
2011 |
2010 |
|
|
|
|
|
|
Sales Income |
203,394,106.22 |
178,932,749.47 |
146,776,273.95 |
|
Gain on Exchange
Rate |
1,715,665.70 |
- |
2,684,145.06 |
|
Other Income |
21,622.24 |
111,966.21 |
158,115.72 |
|
Total Revenues |
205,131,394.16 |
179,044,715.68 |
149,618,534.73 |
|
Expenses |
|
|
|
|
|
|
|
|
|
Cost of Goods
Sold & Service |
166,619,187.21 |
140,433,309.93 |
117,838,495.92 |
|
Selling Expenses |
6,989,392.98 |
6,954,177.63 |
4,506,830.94 |
|
Administrative Expenses |
25,149,288.49 |
19,239,731.63 |
15,431,734.27 |
|
Other Expenses |
- |
764,918.26 |
- |
|
Total Expenses |
198,757,868.68 |
167,392,137.45 |
137,777,061.13 |
|
|
|
|
|
|
Profit / [Loss] before Financial
Cost & Income
Tax |
6,373,525.48 |
11,652,578.23 |
11,841,473.60 |
|
Financial Cost |
[1,438,060.79] |
[1,454,986.28] |
[1,006,222.41] |
|
Income Tax |
[1,220,953.69] |
[2,929,860.45] |
[3,252,610.57] |
|
|
|
|
|
|
Net Profit / [Loss] |
3,714,511.00 |
7,267,731.50 |
7,582,640.62 |
|
Retained Earning, beginning of year |
33,242,586.69 |
25,974,855.19 |
18,392,214.57 |
|
Retained Earning, end of
year |
36,957,097.69 |
33,242,586.69 |
25,974,855.19 |
FINANCIAL ANALYSIS
|
ITEM |
UNIT |
2012 |
2011 |
2010 |
|
|
|
|
|
|
|
LIQUIDITY RATIO |
|
|
|
|
|
CURRENT RATIO |
TIMES |
0.97 |
0.88 |
1.15 |
|
QUICK RATIO |
TIMES |
0.46 |
0.46 |
0.79 |
|
|
|
|
|
|
|
ACTIVITY RATIO |
|
|
|
|
|
FIXED ASSETS TURNOVER |
TIMES |
4.45 |
3.59 |
5.65 |
|
TOTAL ASSETS TURNOVER |
TIMES |
1.82 |
1.52 |
2.16 |
|
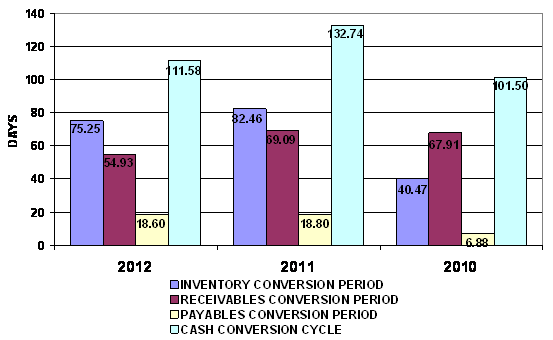
INVENTORY CONVERSION PERIOD |
DAYS |
75.25 |
82.46 |
40.47 |
|
INVENTORY TURNOVER |
TIMES |
4.85 |
4.43 |
9.02 |
|
RECEIVABLES CONVERSION PERIOD |
DAYS |
54.93 |
69.09 |
67.91 |
|
RECEIVABLES TURNOVER |
TIMES |
6.64 |
5.28 |
5.37 |
|
PAYABLES CONVERSION PERIOD |
DAYS |
18.60 |
18.80 |
6.88 |
|
CASH CONVERSION CYCLE |
DAYS |
111.58 |
132.74 |
101.50 |
|
|
|
|
|
|
|
PROFITABILITY RATIO |
|
|
|
|
|
COST OF GOODS SOLD |
% |
81.92 |
78.48 |
80.28 |
|
SELLING & ADMINISTRATION |
% |
15.80 |
14.64 |
13.58 |
|
INTEREST |
% |
0.71 |
0.81 |
0.69 |
|
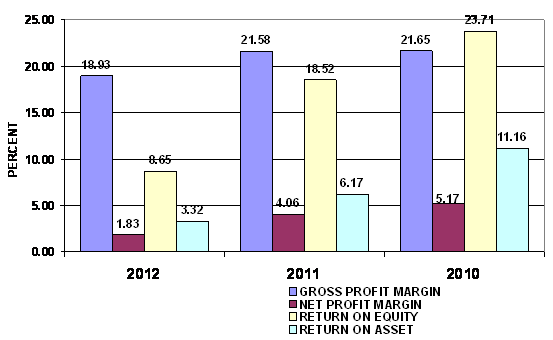
GROSS PROFIT MARGIN |
% |
18.93 |
21.58 |
21.65 |
|
NET PROFIT MARGIN BEFORE EX. ITEM |
% |
3.13 |
6.51 |
8.07 |
|
NET PROFIT MARGIN |
% |
1.83 |
4.06 |
5.17 |
|
RETURN ON EQUITY |
% |
8.65 |
18.52 |
23.71 |
|
RETURN ON ASSET |
% |
3.32 |
6.17 |
11.16 |
|
EARNING PER SHARE |
BAHT |
61.91 |
121.13 |
126.38 |
|
|
|
|
|
|
|
LEVERAGE RATIO |
|
|
|
|
|
DEBT RATIO |
TIMES |
0.62 |
0.67 |
0.53 |
|
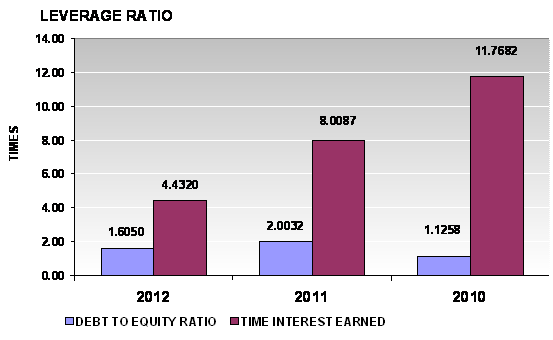
DEBT TO EQUITY RATIO |
TIMES |
1.61 |
2.00 |
1.13 |
|
TIME INTEREST EARNED |
TIMES |
4.43 |
8.01 |
11.77 |
|
|
|
|
|
|
|
ANNUAL GROWTH |
|
|
|
|
|
SALES GROWTH |
% |
13.67 |
21.91 |
|
|
OPERATING PROFIT |
% |
(45.30) |
(1.60) |
|
|
NET PROFIT |
% |
(48.89) |
(4.15) |
|
|
FIXED ASSETS |
% |
(8.34) |
92.15 |
|
|
TOTAL ASSETS |
% |
(4.95) |
73.21 |
|
ANNUAL GROWTH : RISKY
An annual sales growth is 13.67%. Turnover has increased from THB
PROFITABILITY : SATISFACTORY
PROFITABILITY RATIO
|
Gross Profit Margin |
18.93 |
Acceptable |
Industrial Average |
34.03 |
|
Net Profit Margin |
1.83 |
Satisfactory |
Industrial Average |
2.12 |
|
Return on Assets |
3.32 |
Satisfactory |
Industrial Average |
4.25 |
|
Return on Equity |
8.65 |
Satisfactory |
Industrial Average |
9.43 |
Gross Profit Margin used to assess a firm's financial health by
revealing the proportion of money left over from revenues after accounting for
the cost of goods sold. Gross profit margin serves as the source for paying
additional expenses and future savings. The company's figure is 18.93%. When
compared with the industry average, the ratio of the company was lower. This
indicated that company may have problems with control over its costs.
Net Profit Margin is the indicator of the company's efficiency in that
net profit takes into consideration all expenses of the company. A low profit
margin indicates a low margin of safety, higher risk that a decline in sales
will erase profits and result in a net loss. The company's figure is 1.83%.
When compared with the industry average, the ratio of the company was lower.
Return on Assets measures how efficiently profits are being generated
from the assets employed in the business when compared with the ratios of firms
in a similar business. A low ratio in comparison with industry averages
indicates an inefficient use of business assets. When compared with the
industry average, it was lower, the
company's figure is 3.32%.
Return on Equity indicates how profitable a company is by comparing its
net income to its average shareholders' equity, ROE measures how much the
shareholders earned for their investment in the company. When compared with the
industry average, it was lower, the company's figure is 8.65%.
Trend of the average competitors in the same industry for last 5 years
Return on Assets Uptrend
Return on Equity Downtrend
LIQUIDITY : RISKY
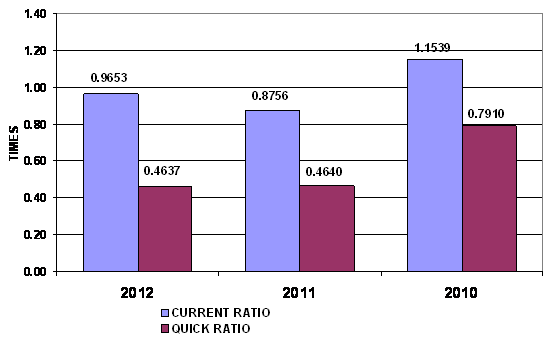
LIQUIDITY RATIO
|
Current Ratio |
0.97 |
Risky |
Industrial Average |
1.40 |
|
Quick Ratio |
0.46 |
|
|
|
|
Cash Conversion Cycle |
111.58 |
|
|
|
The Current Ratio is to ascertain whether a company's short-term assets
are readily available to pay off its short-term liabilities. The company's
figure is 0.97 times in 2012, increased from 0.88 times, then the company may
have problems meeting its short-term obligations. When compared with the industry
average, the ratio of the company was lower.
The Quick Ratio is a liquidity indicator that further refines the
current ratio by measuring the amount of the most liquid current assets there
are to cover current liabilities. The company's figure is 0.46 times in 2012,
same figure as
0.46 times in 2012, then the
company has not enough current assets that presumably can be quickly converted
to cash for pay financial obligations.
The Cash Conversion Cycle measures the number of days a company's cash
is tied up in the production and sales process of its operations and the
benefit from payment terms from its creditors. It meant the company could
survive when no cash inflow was received from sale for 112 days.
Trend of the average competitors in the same industry for last 5 years
Current Ratio Uptrend
LEVERAGE : ACCEPTABLE
LEVERAGE RATIO
|
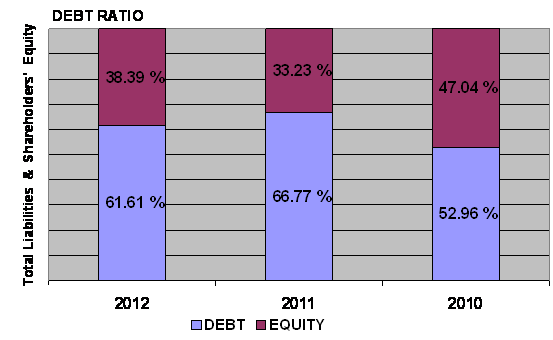
Debt Ratio |
0.62 |
Acceptable |
Industrial Average |
0.61 |
|
Debt to Equity Ratio |
1.61 |
Risky |
Industrial Average |
1.56 |
|
Times Interest Earned |
4.43 |
Impressive |
Industrial Average |
- |
Debt to Equity Ratio a measurement of how much suppliers, lenders,
creditors and obligors have committed to the company versus what the
shareholders have committed. A lower the percentage means that the company is
using less leverage and has a stronger equity position.
Times Interest Earned measuring a company's ability to meet its debt
obligations. Ratio is 4.44 higher than 1, so the company can pay interest
expenses on outstanding debt.
Debt Ratio shows the proportion of a company's assets which are financed
through debt. The company's figure is 0.62 greater than 0.5, most of the
company's assets are financed through debt.
Trend of the average competitors in the same industry for last 5 years
Debt Ratio Uptrend
Times Interest Earned Downtrend
ACTIVITY : IMPRESSIVE
ACTIVITY RATIO
|
Fixed Assets Turnover |
4.45 |
Impressive |
Industrial Average |
- |
|
Total Assets Turnover |
1.82 |
Satisfactory |
Industrial Average |
2.01 |
|
Inventory Conversion Period |
75.25 |
|
|
|
|
Inventory Turnover |
4.85 |
Acceptable |
Industrial Average |
8.42 |
|
Receivables Conversion Period |
54.93 |
|
|
|
|
Receivables Turnover |
6.64 |
Impressive |
Industrial Average |
3.65 |
|
Payables Conversion Period |
18.60 |
|
|
|
The company's Account Receivable Ratio is calculated as 6.64 and
Inventory Turnover in Days Ratio indicates the liquidity of inventory.
It estimates the number of days that it will take to sell the current
inventory. Inventory is particularly sensitive to change in business
activities. The inventory turnover in days has decreased from 82 days at the
end of 2011 to 75 days at the end of 2012. This represents a positive trend.
And Inventory turnover has increased from 4.43 times in year 2011 to 4.85 times
in year 2012.
The company's Total Asset Turnover is calculated as 1.82 times and 1.52
times in 2012 and 2011 respectively. This ratio is determined by dividing total
assets into total sales turnover. The ratio measures the activity of the assets
and the ability of the firm to generate sales through the use of the assets.
Trend of the average competitors in the same industry for last 5 years
Fixed Assets Turnover Downtrend
Total Assets Turnover Downtrend
Inventory Turnover Uptrend
Receivables Turnover Downtrend
FOREIGN EXCHANGE RATES
|
Currency |
Unit
|
Indian Rupees |
|
US Dollar |
1 |
Rs.62.41 |
|
|
1 |
Rs.102.54 |
|
Euro |
1 |
Rs.85.20 |
INFORMATION DETAILS
|
Report Prepared
by : |
SDA |
RATING EXPLANATIONS
|
RATING |
STATUS |
PROPOSED CREDIT LINE |
|
|
>86 |
Aaa |
Possesses an extremely sound financial base with the strongest
capability for timely payment of interest and principal sums |
Unlimited |
|
71-85 |
Aa |
Possesses adequate working capital. No caution needed for credit
transaction. It has above average (strong) capability for payment of interest
and principal sums |
Large |
|
56-70 |
A |
Financial & operational base are regarded healthy. General
unfavourable factors will not cause fatal effect. Satisfactory capability for
payment of interest and principal sums |
Fairly Large |
|
41-55 |
Ba |
Overall
operation is considered normal. Capable to meet normal commitments. |
Satisfactory |
|
26-40 |
B |
Capability to overcome financial difficulties seems comparatively
below average. |
Small |
|
11-25 |
Ca |
Adverse factors are apparent. Repayment of interest and principal sums
in default or expected to be in default upon maturity |
Limited with
full security |
|
<10 |
C |
Absolute credit risk exists. Caution needed to be exercised |
Credit not
recommended |
|
-- |
NB |
New Business |
-- |
This score serves as a reference to assess SC’s credit risk
and to set the amount of credit to be extended. It is calculated from a
composite of weighted scores obtained from each of the major sections of this
report. The assessed factors and their relative weights (as indicated through
%) are as follows:
Financial
condition (40%) Ownership
background (20%) Payment
record (10%)
Credit history
(10%) Market trend
(10%) Operational
size (10%)
This report is issued at your request without any
risk and responsibility on the part of MIRA INFORM PRIVATE LIMITED (MIPL)
or its officials.