MIRA
INFORM REPORT
|
Report Date : |
08.01.2014 |
IDENTIFICATION DETAILS
|
Name : |
KONTAKT-VN OOD |
|
|
|
|
Registered Office : |
Ul. Bregalnitsa, bl.109,
Et.5, Ap.21, 1303 |
|
|
|
|
Country : |
|
|
|
|
|
Financials (as on) : |
31.12.2012 |
|
|
|
|
Year of Establishments: |
2002 |
|
|
|
|
Legal Form : |
Limited Liability Company (OOD) |
|
|
|
|
Line of Business : |
Engaged in trading with spices and
food additives |
|
|
|
|
No. of Employees : |
16 |
RATING & COMMENTS
|
MIRA’s Rating : |
Ba |
|
RATING |
STATUS |
PROPOSED CREDIT LINE |
|
|
41-55 |
Ba |
Overall operation is considered normal. Capable to meet normal
commitments. |
Satisfactory |
|
Status : |
Satisfactory |
|
|
|
|
Payment Behaviour : |
No Complaints |
|
|
|
|
Litigation : |
Clear |
NOTES :
Any query related to this report can be made
on e-mail : infodept@mirainform.com
while quoting report number, name and date.
ECGC Country Risk Classification List – September 30, 2013
|
Country Name |
Previous Rating (30.06.2013) |
Current Rating (30.09.2013) |
|
Bulgaria |
B1 |
B1 |
|
Risk Category |
ECGC
Classification |
|
Insignificant |
A1 |
|
Low |
A2 |
|
Moderate |
B1 |
|
High |
B2 |
|
Very High |
C1 |
|
Restricted |
C2 |
|
Off-credit |
D |
bulGaria ECONOMIC OVERVIEW
Bulgaria, a
former Communist country that entered the EU on 1 January 2007, averaged more than
6% annual growth from 2004 to 2008, driven by significant amounts of bank
lending, consumption, and foreign direct investment. Successive governments
have demonstrated a commitment to economic reforms and responsible fiscal
planning, but the global downturn sharply reduced domestic demand, exports,
capital inflows, and industrial production. GDP contracted by 5.5% in 2009,
stagnated in 2010, despite a significant recovery in exports, grew 1.7% in
2011, and 1% in 2012. Despite having a favorable investment regime, including
low, flat corporate income taxes, significant challenges remain. Corruption in
public administration, a weak judiciary, and the presence of organized crime
continue to hamper the country's investment climate and economic prospects.
|
Source : CIA |
Company
details
Local name: KONTAKT-VN OOD
International name: KONTAKT-VN OOD
Registered address:
Ul. Bregalnitsa, bl.109, et.5, ap.21
1303 Sofia
Bulgaria
Head office:
Nedelcho Bonchev Str No. 10
1592 Sofia
Bulgaria
Telephone: +359-2-4918343
Fax: +359-2-4918343
ESTABLISHMENT & REGISTRATION:
Established: 2002
Registered at Sofia Town Court
Court number 9253/2002
Bulstat/VAT number: 130987545
LEGAL FORM:
Limited Liability Company (OOD)
REGISTERED CAPITAL:
BGN 50
000.00
SHAREHOLDERS/MANAGEMENT
SHAREHOLDERS:
VLADIMIR
STEFANOV CHAMUROV - 60%
ID
7211172188
PETAR
STEFANOV CHAMUROV - 40%
ID
6605221440
MANAGEMENT:
VLADIMIR
STEFANOV CHAMUROV - Manager
RELATED COMPANIES:
|
Company ID |
Company Name |
|
201776941 |
GURME SPAYS |
|
131360339 |
BORSA ZA PODPRAVKI |
BUSINESS
ACTIVITY
BUSINESS OPERATION:
NACE
1.1: 51.90 Other wholesale
Activity:
Trade
with spices and food additives
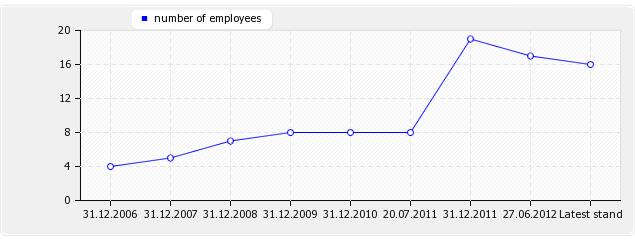
NUMBER OF EMPLOYEES:
|
As at date |
Value |
|
31.12.2006 |
4 |
|
31.12.2007 |
5 |
|
31.12.2008 |
7 |
|
31.12.2009 |
8 |
|
31.12.2010 |
8 |
|
20.07.2011 |
8 |
|
31.12.2011 |
19 |
|
27.06.2012 |
17 |
|
Latest stand |
16 |
EXPORT:
None
IMPORT:
EU, Asia
REAL ESTATE:
None
FINANCIAL
DATA
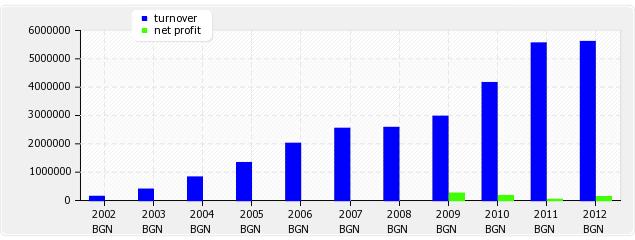
TURNOVER:
|
Year |
Currency |
Value |
|
2002 |
BGN |
143 000.00 |
|
2003 |
BGN |
397 000.00 |
|
2004 |
BGN |
825 000.00 |
|
2005 |
BGN |
1 335 000.00 |
|
2006 |
BGN |
2 017 000.00 |
|
2007 |
BGN |
2 546 000.00 |
|
2008 |
BGN |
2 577 000.00 |
|
2009 |
BGN |
2 971 000.00 |
|
2010 |
BGN |
4 159 000.00 |
|
2011 |
BGN |
5 556 000.00 |
|
2012 |
BGN |
5 609 000.00 |
MODES OF PAYMENT:
Payments
are made within agreed terms.
DEBT COLLECTION:
No debt
collection cases are registered against the company.
BANK DISTRAINTS:
No shares
of the company are under bank distraint.
UNPAID TAXES/ CONTRIBUTIONS TO GOVERNMENT:
There is
no publication about overdue unpaid taxes.
INVOLVEMENT IN LEGAL DISPUTES:
There is
no publication about legal claims or disputes against the company.
OTHER PAYMENT INFORMATION:
No
adverse payment information is available.
BRANCH INDICATOR:
The
company's payment behaviour is average for the branch.
Exchange
rate since 1998 is 1 BGN (denominated lev) = 0.51 EUR
|
Ratio |
2009 |
2010 |
2011 |
2012 |
|
Debt ratio |
0.60 |
0.58 |
0.47 |
0.26 |
|
Quick ratio |
1.50 |
1.24 |
1.65 |
3.32 |
|
Current ratio |
1.62 |
1.65 |
1.98 |
3.67 |
|
Days purchase in payables |
100.33 |
84.83 |
43.61 |
19.87 |
|
Operating margin in % |
0.00 |
4.57 |
0.77 |
2.61 |
|
Cash ratio (acid ratio) |
0.75 |
0.41 |
0.35 |
1.12 |
|
Return on sales ROS in % |
8.58 |
4.11 |
0.70 |
2.34 |
|
Return on assets ROA in % |
18.51 |
10.05 |
2.72 |
10.92 |
|
Return on equity ROE in % |
46.36 |
23.72 |
5.13 |
14.70 |
|
Days supply in inventory |
12.12 |
34.71 |
14.51 |
6.88 |
|
Days sales in receivables |
75.01 |
70.46 |
56.76 |
43.79 |
|
BALANCE SHEET in BGN'000 |
2009 |
2010 |
2011 |
2012 |
|
Accounting period: |
1.1.2009 - |
1.1.2010 - |
1.1.2011 - |
1.1.2012 - |
|
A.UNPAID CAPITAL |
|
|
|
|
|
B. FIXED ASSETS |
|
|
|
|
|
I Fixed Intangible Assets: |
|
|
|
|
|
R&D Products |
|
|
|
|
|
Concessions, patents, trade-marks
etc |
|
|
|
|
|
Goodwill |
|
|
|
|
|
Intangible fixed assets under
construction |
|
|
|
|
|
thereof advances |
|
|
|
|
|
Total I: |
|
|
|
|
|
II Fixed Tangible Assets |
|
|
|
|
|
Land and Buildings |
|
|
|
|
|
thereof Land |
|
|
|
|
|
thereof Buildings |
|
|
|
|
|
Machines, Vehicles |
38 |
87 |
56 |
31 |
|
Equipment |
|
|
43 |
36 |
|
Tangible fixed assets under
construction |
|
|
|
|
|
thereof advances |
|
|
|
|
|
Total II |
38 |
87 |
99 |
67 |
|
III. Fixed Financial Assets |
|
|
|
|
|
Shares in group companies |
|
|
|
|
|
Loans granted to group companies |
|
|
|
|
|
Shares in joint ventures |
|
|
|
|
|
Long term investments |
|
|
|
|
|
Other loans |
|
|
|
|
|
Bought back own shares |
|
|
|
|
|
Total III |
|
|
|
|
|
IV. Deferred Taxes |
|
|
|
|
|
B. FIXED ASSETS TOTAL |
38 |
87 |
99 |
67 |
|
C. CURRENT ASSETS |
|
|
|
|
|
I. Inventories |
|
|
|
|
|
Raw Materials |
|
|
|
|
|
Work in progress |
|
|
|
|
|
thereof young animals |
|
|
|
|
|
Trading goods |
100 |
401 |
224 |
107 |
|
thereof production |
|
|
|
|
|
thereof goods for sale |
100 |
401 |
224 |
107 |
|
Advances |
|
|
|
|
|
Total I |
100 |
401 |
224 |
107 |
|
II. Receivables |
|
|
|
|
|
Receivables from customers |
552 |
709 |
704 |
549 |
|
thereof more than 1 year |
|
|
|
|
|
Receivables from group companies |
|
|
|
|
|
thereof more than 1 year |
|
|
|
|
|
Receivables from joint ventures |
|
|
|
|
|
thereof more than 1 year |
|
|
|
|
|
Other receivables |
67 |
105 |
172 |
132 |
|
thereof more than 1 year |
|
|
|
|
|
Total II |
619 |
814 |
876 |
681 |
|
III. Current Financial Assets |
|
|
|
|
|
Current investments in related
companies |
|
|
|
|
|
Bought back own shares |
|
|
|
|
|
Other current financial assets |
|
|
|
|
|
Total III |
|
|
|
|
|
IV. Cash equivalents |
|
|
|
|
|
Cash and accounts in the country |
621 |
399 |
234 |
345 |
|
thereof cash |
20 |
59 |
2 |
1 |
|
Thereof cash in foreign currency
(equivalent) |
19 |
19 |
19 |
19 |
|
thereof current accounts |
582 |
321 |
213 |
325 |
|
thereof blocked accounts |
|
|
|
|
|
thereof cash equivalents |
|
|
|
|
|
Cash and accounts abroad |
|
|
|
|
|
thereof cash |
|
|
|
|
|
Thereof cash in foreign currency
(equivalent) |
|
|
|
|
|
thereof current accounts |
|
|
|
|
|
thereof blocked accounts |
|
|
|
|
|
Total IV |
621 |
399 |
234 |
345 |
|
C. CURRENT ASSETS TOTAL |
1340 |
1614 |
1334 |
1133 |
|
D. Deferred expenses |
|
|
|
|
|
TOTAL ASSETS |
1378 |
1701 |
1433 |
1200 |
|
A. OWNERS EQUITY |
|
|
|
|
|
I. Share capital |
50 |
50 |
50 |
50 |
|
II. Issue premium |
|
|
|
|
|
III. Revaluation reserves |
|
|
|
|
|
thereof revaluation reserves of
financial instruments |
|
|
|
|
|
IV. Reserves |
|
|
|
|
|
legal reserves |
|
|
|
|
|
reserve related to bought back own
shares |
|
|
|
|
|
reserve from company foundation |
|
|
|
|
|
other reserves |
|
|
|
|
|
Total IV |
|
|
|
|
|
V. Result from previous period |
|
|
|
|
|
Undistributed profit |
245 |
500 |
671 |
710 |
|
Uncovered loss |
|
|
|
|
|
Total V |
245 |
500 |
671 |
710 |
|
VI. Current result profit (loss) |
255 |
171 |
39 |
131 |
|
A. OWNERS EQUITY TOTAL |
550 |
721 |
760 |
891 |
|
B. PROVISIONS |
|
|
|
|
|
Provisions for pensions |
|
|
|
|
|
Provisions for taxes |
|
|
|
|
|
thereof deferred taxes |
|
|
|
|
|
Other provisions |
|
|
|
|
|
B. PROVISIONS TOTAL |
|
|
|
|
|
C. LIABILITIES |
|
|
|
|
|
Bond-backed loans |
|
|
|
|
|
less than 1 year |
|
|
|
|
|
more than 1 year |
|
|
|
|
|
Bank loans |
6 |
613 |
419 |
29 |
|
less than 1 year |
6 |
613 |
419 |
29 |
|
more than 1 year |
|
|
|
|
|
Advances received |
|
|
61 |
61 |
|
less than 1 year |
|
|
61 |
61 |
|
more than 1 year |
|
|
|
|
|
Payables to suppliers |
346 |
333 |
47 |
117 |
|
less than 1 year |
346 |
333 |
47 |
117 |
|
more than 1 year |
|
|
|
|
|
Liabilities on policies |
|
|
|
|
|
less than 1 year |
|
|
|
|
|
more than 1 year |
|
|
|
|
|
Liabilities to group companies |
|
|
|
|
|
less than 1 year |
|
|
|
|
|
more than 1 year |
|
|
|
|
|
Liabilities to joint-venture
companies |
|
|
|
|
|
less than 1 year |
|
|
|
|
|
more than 1 year |
|
|
|
|
|
Other liabilities |
476 |
34 |
146 |
102 |
|
less than 1 year |
476 |
34 |
146 |
102 |
|
more than 1 year |
|
|
|
|
|
thereof to personnel |
6 |
7 |
11 |
30 |
|
less than 1 year |
6 |
7 |
11 |
30 |
|
more than 1 year |
|
|
|
|
|
thereof to social insurance |
1 |
1 |
4 |
2 |
|
less than 1 year |
1 |
1 |
4 |
2 |
|
more than 1 year |
|
|
|
|
|
thereof for taxes |
32 |
24 |
8 |
21 |
|
less than 1 year |
32 |
24 |
8 |
21 |
|
more than 1 year |
|
|
|
|
|
C. LIABILITIES TOTAL |
828 |
980 |
673 |
309 |
|
less than 1 year |
828 |
980 |
673 |
309 |
|
more than 1 year |
|
|
|
|
|
D. FINANCING AND DEFERRED INCOME |
|
|
|
|
|
thereof |
|
|
|
|
|
Financing |
|
|
|
|
|
Deferred income |
|
|
|
|
|
TOTAL EQUITY AND LIABILITIES |
1378 |
1701 |
1433 |
1200 |
|
P&L ACCOUNT in BGN'000 |
2009 |
2010 |
2011 |
2012 |
|
Accounting period: |
1.1.2009 - |
1.1.2010 - |
1.1.2011 - |
1.1.2012 - |
|
A. EXPENSES |
|
|
|
|
|
I. OPERATION EXPENSES |
|
|
|
|
|
Decrease of inventories |
|
|
|
|
|
thereof for materials |
54 |
57 |
93 |
73 |
|
thereof for services |
211 |
417 |
285 |
146 |
|
Personnel expenses |
60 |
80 |
147 |
148 |
|
thereof wages |
51 |
68 |
124 |
124 |
|
thereof social insurance |
9 |
12 |
23 |
24 |
|
thereof pensions |
|
|
|
|
|
Depreciation |
29 |
30 |
55 |
48 |
|
thereof Depreciation of fixed
assets |
29 |
30 |
55 |
48 |
|
Other expenses |
2324 |
3363 |
4885 |
5024 |
|
thereof Book value of sold assets
(without production) |
2319 |
3355 |
4860 |
4668 |
|
I. OPERATION EXPENSES TOTAL |
2678 |
3947 |
5465 |
5439 |
|
II. Financial expenditures |
|
|
|
|
|
Depreciation of financial assets |
|
34 |
45 |
28 |
|
thereof exchange rate losses |
|
34 |
45 |
28 |
|
Paid interest |
27 |
21 |
44 |
23 |
|
thereof interest to group
companies |
|
|
|
|
|
Thereof expenditures for
securities operations |
|
|
|
|
|
II. Financial expenditures Total |
27 |
55 |
89 |
51 |
|
B. Profit on ordinary activity |
|
190 |
43 |
146 |
|
III. Extraordinary expenses |
|
|
|
|
|
thereof expenses on disasters and
emergency expenses |
|
|
|
|
|
C. Total expenses (I+II+III) |
2705 |
4002 |
5554 |
5490 |
|
D. Accounting profit |
283 |
190 |
43 |
146 |
|
IV. Taxation on profit |
28 |
19 |
4 |
15 |
|
V. Other taxes |
|
|
|
|
|
E. Net profit |
255 |
171 |
39 |
131 |
|
Total expenses |
2988 |
4192 |
5597 |
5636 |
|
A. REVENUES |
|
|
|
|
|
I . OPERATING REVENUES |
|
|
|
|
|
Net sales |
2971 |
4159 |
5556 |
5599 |
|
Production |
|
|
|
|
|
Goods |
2971 |
4157 |
5556 |
5586 |
|
Services |
|
2 |
|
13 |
|
Increase of production and work in
progress |
|
|
|
|
|
Expenses on acquisition of assets |
|
|
|
|
|
Other revenues |
|
|
|
10 |
|
thereof financing |
|
|
|
|
|
I. TOTAL OPERATING REVENUES |
2971 |
4159 |
5556 |
5609 |
|
II FINANCIAL REVENUES |
|
|
|
|
|
Income from shares |
|
|
|
|
|
thereof income from shares in
group companies |
|
|
|
|
|
Income from investments and loans |
|
|
|
|
|
thereof from investments in group
companies |
|
|
|
|
|
Income from interest |
|
|
|
|
|
thereof from interest from group
companies |
|
|
|
|
|
II FINANCIAL REVENUES TOTAL |
17 |
33 |
41 |
27 |
|
TOTAL REVENUES FROM ORDINARY
ACTIVITIES |
2988 |
4192 |
5597 |
5636 |
|
LOSS |
|
|
|
|
|
Extraordinary revenues |
|
|
|
|
|
AFTER TAX LOSS |
|
|
|
|
|
TOTAL REVENUES |
2988 |
4192 |
5597 |
5636 |
FOREIGN EXCHANGE RATES
|
Currency |
Unit
|
Indian Rupees |
|
US Dollar |
1 |
Rs.62.38 |
|
UK Pound |
1 |
Rs.102.25 |
|
Euro |
1 |
Rs.84.97 |
INFORMATION DETAILS
|
Report Prepared
by : |
MNL |
RATING EXPLANATIONS
|
RATING |
STATUS |
PROPOSED CREDIT LINE |
|
|
>86 |
Aaa |
Possesses an extremely sound financial base with the strongest
capability for timely payment of interest and principal sums |
Unlimited |
|
71-85 |
Aa |
Possesses adequate working capital. No caution needed for credit
transaction. It has above average (strong) capability for payment of interest
and principal sums |
Large |
|
56-70 |
A |
Financial & operational base are regarded healthy. General unfavourable
factors will not cause fatal effect. Satisfactory capability for payment of
interest and principal sums |
Fairly Large |
|
41-55 |
Ba |
Overall
operation is considered normal. Capable to meet normal commitments. |
Satisfactory |
|
26-40 |
B |
Capability to overcome financial difficulties seems comparatively
below average. |
Small |
|
11-25 |
Ca |
Adverse factors are apparent. Repayment of interest and principal sums
in default or expected to be in default upon maturity |
Limited with full
security |
|
<10 |
C |
Absolute credit risk exists. Caution needed to be exercised |
Credit not
recommended |
|
-- |
NB |
New Business |
-- |
This score serves as a reference to assess SC’s credit risk and
to set the amount of credit to be extended. It is calculated from a composite
of weighted scores obtained from each of the major sections of this report. The
assessed factors and their relative weights (as indicated through %) are as
follows:
Financial
condition (40%) Ownership
background (20%) Payment
record (10%)
Credit history
(10%) Market trend
(10%) Operational
size (10%)
This report is issued at your request without any
risk and responsibility on the part of MIRA INFORM PRIVATE LIMITED (MIPL)
or its officials.