MIRA
INFORM REPORT
|
Report Date : |
17.01.2014 |
IDENTIFICATION DETAILS
|
Name : |
BAKALLAND S.A. |
|
|
|
|
Registered Office : |
Fabryczna 5 Street, Warszawa, 00-446 |
|
|
|
|
Country : |
Poland |
|
|
|
|
Financials (as on) : |
30.06.2013 |
|
|
|
|
Date of Incorporation : |
27.03.2006 |
|
|
|
|
Legal Form : |
Public Parent Company |
|
|
|
|
Line of Business : |
· Subject is engaged in the manufacturing, packaging, import, and distribution of dried fruits, nuts, seeds and olives. Subject
offering includes raisins, apricots, Californian prunes, figs, dates, pears,
peaches, apples and desiccated coconut; cereals; nuts, such as hazelnuts,
walnuts and pistachios, seeds, both sunflower and pumpkin, flakes. |
|
|
|
|
No. of Employees : |
376 |
RATING & COMMENTS
|
MIRA’s Rating : |
B |
|
RATING |
STATUS |
PROPOSED CREDIT LINE |
|
|
26-40 |
B |
Capability to overcome financial difficulties seems comparatively
below average. |
Small |
|
Status : |
Moderate |
|
|
|
|
Payment Behaviour : |
Slow but Correct |
|
|
|
|
Litigation : |
Clear |
NOTES :
Any query related to this report can be made
on e-mail : infodept@mirainform.com
while quoting report number, name and date.
ECGC Country Risk Classification List – September 30, 2013
|
Country Name |
Previous Rating (30.06.2013) |
Current Rating (30.09.2013) |
|
Poland |
B1 |
B1 |
|
Risk Category |
ECGC
Classification |
|
Insignificant |
A1 |
|
Low |
A2 |
|
Moderate |
B1 |
|
High |
B2 |
|
Very High |
C1 |
|
Restricted |
C2 |
|
Off-credit |
D |
Poland ECONOMIC OVERVIEW
Poland has
pursued a policy of economic liberalization since 1990 and Poland's economy was
the only one in the European Union to avoid a recession through the 2008-09
economic downturn. Although EU membership and access to EU structural funds
have provided a major boost to the economy since 2004, GDP per capita remains
significantly below the EU average while unemployment continues to exceed the
EU average. The government of Prime Minister Donald TUSK steered the Polish
economy through the economic downturn by skillfully managing public finances
without stifling economic growth and adopted controversial pension and tax
reforms to further shore up public finances. While the Polish economy has
performed well over the past five years, growth slowed in 2012, in part due to
the ongoing economic difficulties in the euro zone. The key policy challenge is
to provide support to the economy through monetary easing, while maintaining
the pace of structural fiscal consolidation. Poland's economic performance
could improve over the longer term if the country addresses some of the
remaining deficiencies in its road and rail infrastructure and its business
environment. An inefficient commercial court system, a rigid labor code, red
tape, and a burdensome tax system keep the private sector from realizing its
full potential.
|
Source : CIA |
Company name & address
BAKALLAND S.A.
Fabryczna 5 Street
Warszawa, 00-446
Poland
Tel: 48-22-3552200
Fax: 48-22-3552220
Web: www.bakalland.pl
synthesis
|
Employees: |
376 |
||
|
Company Type: |
Public Parent |
||
|
Corporate Family: |
2 Companies |
||
|
Traded: |
|
||
|
Incorporation Date: |
27-Mar-2006 |
||
|
Auditor: |
HLB Sarnowski
& Wisniewski Sp. z o.o. |
|
Financials in: |
USD (Millions) |
|
|
|
|
Fiscal Year End: |
30-Jun-2013 |
|
Reporting Currency: |
Polish New Zloty |
|
Annual Sales: |
|
|
Net Income: |
|
|
Total Assets: |
|
|
Market Value: |
15.3 |
|
|
(27-Dec-2013) |
|
|
|
|
Business Description
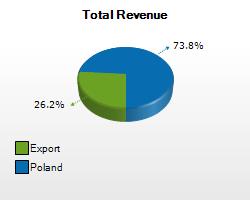
Bakalland SA is a Poland-based company active in the food processing industry. It is engaged in the manufacturing, packaging, import, and distribution of dried fruits, nuts, seeds and olives. The Company's offering includes raisins, apricots, Californian prunes, figs, dates, pears, peaches, apples and desiccated coconut; cereals; nuts, such as hazelnuts, walnuts and pistachios, seeds, both sunflower and pumpkin, flakes, and others. Additionally, Bakalland SA’s offer includes seeds for cakes and canned fruits, as well as olives and olive oil, cake fillings and jams, among others. As of June 30, 2012, the Company operated six subsidiaries. For the three months ended 30 September 2013, Bakalland S.A. revenues decreased 36% to PLN38.5M. Net loss totaled PLN1.5M vs. income of PLN1.4M. Revenues reflect Wholesale segment decrease of 48% to PLN20.4M, Chain segment decrease of 13% to PLN18.1M, Export segment decrease of 75% to PLN5.1M, Poland segment decrease of 15% to PLN33.4M. Net loss reflects Other Operating Income decrease of 72% to PLN680K (income).
Industry
|
Industry |
|
|
ANZSIC 2006: |
|
|
ISIC Rev 4: |
|
|
NACE Rev 2: |
1039 -
Other processing and preserving of fruit and vegetables |
|
NAICS 2012: |
|
|
UK SIC 2007: |
1039 -
Other processing and preserving of fruit and vegetables |
|
US SIC 1987: |
2033 -
Canned Fruits, Vegetables, Preserves, Jams, and Jellies |
Key Executives
|
Name |
Title |
|
Pawel Glowniak |
Vice Chairman of the Management Board, Director of Sales |
|
Jadwiga Raszko vel Rzepa |
Chief Accounting Officer |
|
Marek Moczulski |
Chairman of the Supervisory Board |
|
Dariusz Jacek Masny |
Vice Chairman of the Management Board |
|
Evangelos Evangelou |
Member of the Supervisory Board |
Significant Developments
|
* number of significant developments within the last 12 months
Financial Summary
|
As of 30-Sep-2013 |
||||||||||||||||||||||||
|
Stock Snapshot
|
|
1 - Profit &
Loss Item Exchange Rate: USD 1 = PLN 3.210601
2 - Balance Sheet Item Exchange Rate:
USD 1 = PLN 3.320142
Corporate Overview
|
||||||||||||||||||||||||||||||||||||||||||||||||||||||||||||||||||||||||||||||||||||||||||||||||||||||||||||||||||||||||||||||||||||||||||||||||||||||||||||||||||||||||||||||||||||||||||||||||||||||||||||||||||||||||||||||||||||||||||||||||||||||||||||||||||||||||||||||||||||||||||||||||||||||||||||||||||||||||||||||||||||||||||||||||||||||||||||||||||||||||||||||||
|
Corporate Family
|
Corporate
Structure News: |
|
|
Bakalland S.A |
|
Bakalland S.A. |
|
|
|
|
|
Company Name |
Company Type |
Location |
Country |
Industry |
Sales |
Employees |
|
|
Bakalland S.A. |
Parent |
Warszawa |
Poland |
Food Manufacturing |
83.1 |
376 |
|
|
Subsidiary |
Warszawa |
Poland |
Food Manufacturing |
13.5 |
70 |
|
Executive report
|
Board of
Directors |
|
|
|
|
||||||||||
|
Chairman of the Supervisory Board |
Chairman |
|
||||||||||
|
|||||||||||||
|
Chairman of the Management Board |
Chairman |
|
|
|||||||||
|
|||||||||||||
|
Vice Chairman of the Management Board,
Director of Sales |
Vice-Chairman |
|
|
|||||||||
|
|||||||||||||
|
Vice Chairman of the Management Board |
Vice-Chairman |
|
|
|||||||||
|
|||||||||||||
|
Vice Chairman of the Management Board |
Vice-Chairman |
|
|
|||||||||
|
|||||||||||||
|
Vice Chairman of the Supervisory Board |
Vice-Chairman |
|
|
|||||||||
|
|||||||||||||
|
Member |
Director/Board Member |
|
|
|||||||||
|
Member of the Supervisory Board |
Director/Board Member |
|
|
|||||||||
|
|||||||||||||
|
Member of the Supervisory Board |
Director/Board Member |
|
|
|||||||||
|
|||||||||||||
|
Member |
Director/Board Member |
|
|
|||||||||
|
Member of the Supervisory Board |
Director/Board Member |
|
|
|||||||||
|
|||||||||||||
|
Member |
Director/Board Member |
|
|
|||||||||
|
Member of the Supervisory Board |
Director/Board Member |
|
|
|||||||||
|
|||||||||||||
|
Executives |
|
|
|
|
|||||||||
|
Chief Accounting Officer |
Accounting Executive |
|
|||||||||
|
Vice Chairman of the Management Board, Director of Sales |
Sales Executive |
|
|||||||||
|
||||||||||||
Significant Developments
Bakalland SA signs appendix to credit agreement with BGZ SA Dec 20, 2013
Bakalland SA:Signs on Dec. 19 an appendix to credit agreement with Bank
Gospodarki Zywnosciowej SA to decrease the company's credit by 6,000,000 Polish
zlotys, down to 7,000,000 Polish zlotys.
Bakalland SA to merge with subsidiary Dec 16, 2013
Bakalland SA:Says it has decided on Dec. 16 to merge with its subsidiary PIFO
EKO-STREFA Sp. z o. o. in order to decrease its operating costs, consolidate
its businesses and simplify the company's structure.Says the merger will be
realized through the transfer of all the assets of PIFO EKO-STREFA Sp. z o. o.
to the company.Says PIFO EKO-STREFA's share capital equals 2,030,000 Polish
zlotys and consists of 1,847 shares of the nominal value of 1,000 Polish
zlotys.Says PIFO EKO-STREFA specializes in manufacturing breakfast cereals and
cereal bars.
Bakalland SA Signs Credit Agreement with BGZ SA Oct 31, 2013
Bakalland SA announced that it has signed a revolving credit agreement with BGZ
SA for up to PLN 13 million. The credit has been provided for the financing of
the Company's current activity by April 22, 2014. The credit's interest has
been set at WIBOR 1M rate plus the bank's margin.
Mispol SA Announces Dismissal of Proceedings with Bakalland SA Oct 29, 2013
Mispol SA announced that due to withdrawal of lawsuits filed by Bakalland SA
for invalidating decisions of Mispol SA's Extraordinary General Shareholders'
Meeting (EGM) on October 24, 2013 the Regional Court in Bialystok dismissed the
proceedings in these cases. Along with the withdrawal of lawsuits Bakalland SA
waived its claims under the above lawsuits. This is the result of agreement of
October 22, 2013, which settled the litigation concerning the resolutions
adopted by the General Shareholders' Meeting of Mispol SA.
Bakalland SA Updates on Dispute with UAB NDX energija Oct 16, 2013
Bakalland SA announced that on October 16, 2013 representatives of Bakalland SA
together with representatives of UAB NDX energija entered into negotiations
aimed at amicable settlement of all the legal proceedings regarding General
Meeting of Bakalland SA and Mispol SA as well as resolutions adopted by both
companies.
Court Secures NDX Energija UAB's Claim against Bakalland SA Oct 11, 2013
Bakalland SA announced that the Regional Court in Warsaw has secured the claim
of NDX Energija UAB demanding that the resolutions of its Extraordinary General
Shareholders' Meeting of June 6, 2013, be made invalid and prohibited the
Company's Supervisory Board to appoint, suspend and dismiss Members of the
Management Board, sign managerial contracts and contracts of employment with
Members of the Management Bard, and to set the amount of remuneration/bonuses
of Members of the Management Bard.
Mispol SA Updates on Claim from Bakalland SA Sep 16, 2013
Mispol SA announced that in a claim filed by Bakalland SA demanding annulment
of the Company's resolution dated March 1, 2013 on abolition of dematerialization
of Mispol SA's shares and their delisting from trading on the regulated market
of the Warsaw Stock Exchange, the District Court in Bialystok on September 16,
2013 dismissed Bakalland's claim. The judgement is not valid.
Mispol SA Receives Claim from Bakalland SA Aug 20, 2013
Mispol SA announced that on August 19, 2013 it received a claim of August 2,
2013 from Bakalland SA. Bakalland SA demands that the resolution of Mispol SA's
Extraordinary General Shareholders' Meeting of July 4, 2013 be declared
invalid. The resolution concerns electing Vice Chairman of the Extraordinary
General Shareholders' Meeting.
Court Secures Shareholder's Claim Against Bakalland SA Jun 26, 2013
Bakalland SA announced that the Regional Court in Warsaw has secured the claim
of the Company's shareholder demanding that the resolutions number 5, 6 and 7
of its Extraordinary General Shareholders' Meeting, be made invalid. The above
resolutions concern dismissing Mr. Pawel Sobkow and appointing Mr. Marek
Moczulski and Mr. Stefan Golonka to the Supervisory Board of the Company.
Mispol SA Receives Claim from Bakalland SA Mar 19, 2013
Mispol SA announced that on March 19, 2013 it received a claim of March 4, 2013
from Bakalland SA. Bakalland SA demands that the resolution of Mispol SA's
Extraordinary General Shareholders' Meeting of March 1, 2013 be declared
invalid. The resolution concerns abolition of dematerialization of Mispol SA's
shares and their delisting from trading on the regulated market of the Warsaw
Stock Exchange.
Bakalland SA Increases Stake in Mispol SA Feb 15, 2013
Mispol SA announced that on February 12, 2013 Bakalland SA acquired 1,026,119
Mispol SA's shares. Prior to that, it held 470,076 of Mispol SA's shares,
representing a 2.62% stake in its share capital. Following the transaction,
Bakalland SA holds 1,496,195 of Mispol SA's shares, representing a 8.36% stake
in its share capital.
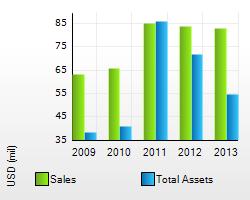
Annual Income
Statement
Financials in: USD (mil)
Except for share items (millions) and per share items (actual units)
|
|
30-Jun-2013 |
30-Jun-2012 |
30-Jun-2011 |
30-Jun-2010 |
30-Jun-2009 |
|
Period Length |
12 Months |
12 Months |
12 Months |
12 Months |
12 Months |
|
UpdateType/Date |
Updated Normal |
Updated Normal |
Updated Normal |
Updated Normal |
Updated Normal |
|
Filed Currency |
PLN |
PLN |
PLN |
PLN |
PLN |
|
Exchange Rate
(Period Average) |
3.210601 |
3.189476 |
2.917488 |
2.952367 |
2.937006 |
|
Auditor |
HLB Sarnowski
& Wisniewski Sp. z o.o. |
HLB Sarnowski
& Wisniewski Sp. z o.o. |
HLB Sarnowski
& Wisniewski Sp. z o.o. |
HLB Sarnowski
& Wisniewski Sp. z o.o. |
Sarnowski &
Wisniewski Spolka Audytorska SP. Z.O.O. |
|
Auditor Opinion |
Unqualified |
Unqualified with
Explanation |
Unqualified with
Explanation |
Unqualified |
Unqualified |
|
|
|
|
|
|
|
|
Net Sales |
83.1 |
84.1 |
85.3 |
65.9 |
63.4 |
|
Revenue |
83.1 |
84.1 |
85.3 |
65.9 |
63.4 |
|
Total Revenue |
83.1 |
84.1 |
85.3 |
65.9 |
63.4 |
|
|
|
|
|
|
|
|
Cost of Revenue |
59.9 |
60.1 |
61.0 |
44.7 |
42.9 |
|
Cost of Revenue, Total |
59.9 |
60.1 |
61.0 |
44.7 |
42.9 |
|
Gross Profit |
23.2 |
24.1 |
24.4 |
21.2 |
20.4 |
|
|
|
|
|
|
|
|
Selling/General/Administrative Expense |
20.2 |
21.3 |
22.1 |
16.4 |
16.1 |
|
Total Selling/General/Administrative Expenses |
20.2 |
21.3 |
22.1 |
16.4 |
16.1 |
|
Litigation |
0.1 |
- |
- |
- |
- |
|
Loss (Gain) on Sale of Assets - Operating |
0.0 |
-0.1 |
-0.1 |
0.0 |
0.0 |
|
Unusual Expense (Income) |
0.1 |
-0.1 |
-0.1 |
0.0 |
0.0 |
|
Other Operating Expense |
2.7 |
1.4 |
1.0 |
1.1 |
2.3 |
|
Other, Net |
-2.5 |
-2.4 |
-1.9 |
-0.8 |
-0.7 |
|
Other Operating Expenses, Total |
0.2 |
-0.9 |
-0.8 |
0.3 |
1.6 |
|
Total Operating Expense |
80.3 |
80.4 |
82.2 |
61.4 |
60.6 |
|
|
|
|
|
|
|
|
Operating Income |
2.8 |
3.7 |
3.2 |
4.4 |
2.8 |
|
|
|
|
|
|
|
|
Interest Expense -
Non-Operating |
-2.7 |
-2.6 |
-1.8 |
-0.7 |
-0.9 |
|
Interest Expense, Net Non-Operating |
-2.7 |
-2.6 |
-1.8 |
-0.7 |
-0.9 |
|
Interest Income -
Non-Operating |
0.2 |
0.4 |
0.3 |
0.2 |
0.2 |
|
Investment Income -
Non-Operating |
-1.1 |
0.1 |
0.0 |
0.0 |
0.0 |
|
Interest/Investment Income - Non-Operating |
-0.8 |
0.5 |
0.3 |
0.2 |
0.2 |
|
Interest Income (Expense) - Net Non-Operating Total |
-3.5 |
-2.1 |
-1.5 |
-0.6 |
-0.7 |
|
Other Non-Operating Income (Expense) |
0.0 |
-0.9 |
0.0 |
-0.4 |
-2.1 |
|
Other, Net |
0.0 |
-0.9 |
0.0 |
-0.4 |
-2.1 |
|
Income Before Tax |
-0.7 |
0.7 |
1.7 |
3.4 |
0.0 |
|
|
|
|
|
|
|
|
Total Income Tax |
-0.1 |
0.4 |
0.1 |
0.3 |
0.1 |
|
Income After Tax |
-0.6 |
0.4 |
1.7 |
3.1 |
-0.1 |
|
|
|
|
|
|
|
|
Minority Interest |
-0.2 |
-0.1 |
-0.3 |
0.1 |
0.0 |
|
Net Income Before Extraord Items |
-0.8 |
0.2 |
1.4 |
3.2 |
-0.1 |
|
Net Income |
-0.8 |
0.2 |
1.4 |
3.2 |
-0.1 |
|
|
|
|
|
|
|
|
Income Available to Common Excl Extraord Items |
-0.8 |
0.2 |
1.4 |
3.2 |
-0.1 |
|
|
|
|
|
|
|
|
Income Available to Common Incl Extraord Items |
-0.8 |
0.2 |
1.4 |
3.2 |
-0.1 |
|
|
|
|
|
|
|
|
Basic/Primary Weighted Average Shares |
19.6 |
19.8 |
20.1 |
20.6 |
21.0 |
|
Basic EPS Excl Extraord Items |
-0.04 |
0.01 |
0.07 |
0.15 |
-0.01 |
|
Basic/Primary EPS Incl Extraord Items |
-0.04 |
0.01 |
0.07 |
0.15 |
-0.01 |
|
Dilution Adjustment |
- |
- |
- |
- |
0.0 |
|
Diluted Net Income |
-0.8 |
0.2 |
1.4 |
3.2 |
-0.1 |
|
Diluted Weighted Average Shares |
19.6 |
19.8 |
20.1 |
20.6 |
21.0 |
|
Diluted EPS Excl Extraord Items |
-0.04 |
0.01 |
0.07 |
0.15 |
-0.01 |
|
Diluted EPS Incl Extraord Items |
-0.04 |
0.01 |
0.07 |
0.15 |
-0.01 |
|
Dividends per Share - Common Stock Primary Issue |
- |
0.00 |
0.00 |
0.06 |
0.05 |
|
Gross Dividends - Common Stock |
0.0 |
0.0 |
0.0 |
- |
- |
|
Interest Expense, Supplemental |
2.7 |
2.6 |
1.8 |
0.7 |
0.9 |
|
Depreciation, Supplemental |
2.4 |
2.1 |
1.9 |
1.1 |
1.0 |
|
Total Special Items |
0.1 |
-0.1 |
-0.1 |
0.0 |
0.0 |
|
Normalized Income Before Tax |
-0.6 |
0.6 |
1.6 |
3.4 |
0.0 |
|
|
|
|
|
|
|
|
Effect of Special Items on Income Taxes |
0.0 |
0.0 |
0.0 |
0.0 |
0.0 |
|
Inc Tax Ex Impact of Sp Items |
-0.1 |
0.3 |
0.1 |
0.3 |
0.1 |
|
Normalized Income After Tax |
-0.5 |
0.3 |
1.5 |
3.1 |
-0.2 |
|
|
|
|
|
|
|
|
Normalized Inc. Avail to Com. |
-0.7 |
0.2 |
1.3 |
3.2 |
-0.2 |
|
|
|
|
|
|
|
|
Basic Normalized EPS |
-0.04 |
0.01 |
0.06 |
0.15 |
-0.01 |
|
Diluted Normalized EPS |
-0.04 |
0.01 |
0.06 |
0.15 |
-0.01 |
|
Amort of Intangibles, Supplemental |
0.0 |
0.0 |
0.2 |
0.2 |
0.1 |
|
Advertising Expense, Supplemental |
- |
2.6 |
3.7 |
2.8 |
- |
|
Normalized EBIT |
2.9 |
3.7 |
3.0 |
4.4 |
2.7 |
|
Normalized EBITDA |
5.3 |
5.7 |
5.2 |
5.7 |
3.8 |
|
Current Tax - Total |
0.1 |
0.2 |
0.1 |
0.5 |
0.4 |
|
Current Tax - Total |
0.1 |
0.2 |
0.1 |
0.5 |
0.4 |
|
Deferred Tax - Total |
-0.2 |
0.1 |
0.0 |
-0.2 |
-0.2 |
|
Deferred Tax - Total |
-0.2 |
0.1 |
0.0 |
-0.2 |
-0.2 |
|
Income Tax - Total |
-0.1 |
0.4 |
0.1 |
0.3 |
0.1 |
Annual Balance Sheet
Financials in: USD (mil)
|
|
30-Jun-2013 |
30-Jun-2012 |
30-Jun-2011 |
30-Jun-2010 |
30-Jun-2009 |
|
UpdateType/Date |
Reclassified
Normal |
Updated Normal |
Reclassified
Normal |
Updated Normal |
Updated Normal |
|
Filed Currency |
PLN |
PLN |
PLN |
PLN |
PLN |
|
Exchange Rate |
3.320142 |
3.455808 |
2.7453 |
3.37715 |
3.18305 |
|
Auditor |
HLB Sarnowski
& Wisniewski Sp. z o.o. |
HLB Sarnowski
& Wisniewski Sp. z o.o. |
HLB Sarnowski
& Wisniewski Sp. z o.o. |
HLB Sarnowski
& Wisniewski Sp. z o.o. |
Sarnowski &
Wisniewski Spolka Audytorska SP. Z.O.O. |
|
Auditor Opinion |
Unqualified |
Unqualified with
Explanation |
Unqualified with
Explanation |
Unqualified |
Unqualified |
|
|
|
|
|
|
|
|
Cash |
- |
0.6 |
1.6 |
0.9 |
0.6 |
|
Cash & Equivalents |
0.1 |
0.0 |
0.3 |
- |
- |
|
Short Term Investments |
1.0 |
1.8 |
2.3 |
2.0 |
1.3 |
|
Cash and Short Term Investments |
1.1 |
2.4 |
4.1 |
2.8 |
1.9 |
|
Accounts Receivable -
Trade, Gross |
- |
10.4 |
15.9 |
10.1 |
9.6 |
|
Provision for Doubtful
Accounts |
- |
-0.4 |
-0.8 |
-0.2 |
-0.1 |
|
Trade Accounts Receivable - Net |
7.9 |
10.1 |
15.1 |
9.8 |
9.5 |
|
Other Receivables |
1.6 |
2.9 |
3.0 |
1.6 |
2.1 |
|
Total Receivables, Net |
9.4 |
13.0 |
18.1 |
11.4 |
11.7 |
|
Inventories - Finished Goods |
- |
13.1 |
14.7 |
7.4 |
7.1 |
|
Inventories - Work In Progress |
- |
0.0 |
0.2 |
0.0 |
0.0 |
|
Inventories - Raw Materials |
- |
2.3 |
3.0 |
1.3 |
1.1 |
|
Inventories - Other |
- |
0.0 |
0.0 |
0.5 |
0.2 |
|
Total Inventory |
9.1 |
15.4 |
17.8 |
9.3 |
8.4 |
|
Total Current Assets |
19.6 |
30.9 |
40.0 |
23.5 |
21.9 |
|
|
|
|
|
|
|
|
Buildings |
- |
11.7 |
13.7 |
9.3 |
5.1 |
|
Land/Improvements |
- |
1.5 |
1.9 |
0.6 |
0.6 |
|
Machinery/Equipment |
- |
17.8 |
21.9 |
6.4 |
6.3 |
|
Construction in Progress |
- |
7.4 |
0.7 |
1.3 |
5.4 |
|
Other
Property/Plant/Equipment |
- |
0.9 |
1.2 |
0.7 |
0.7 |
|
Property/Plant/Equipment - Gross |
- |
39.3 |
39.3 |
18.4 |
18.1 |
|
Accumulated Depreciation |
- |
-8.6 |
-8.4 |
-5.2 |
-4.6 |
|
Property/Plant/Equipment - Net |
23.7 |
30.7 |
30.9 |
13.2 |
13.6 |
|
Goodwill, Net |
7.9 |
7.6 |
9.6 |
0.7 |
0.7 |
|
Intangibles - Gross |
- |
1.2 |
1.5 |
1.1 |
1.1 |
|
Accumulated Intangible Amortization |
- |
-1.1 |
-1.4 |
-0.9 |
-0.9 |
|
Intangibles, Net |
0.1 |
0.2 |
0.2 |
0.2 |
0.2 |
|
LT Investment - Affiliate Companies |
0.6 |
0.3 |
0.3 |
0.1 |
0.1 |
|
LT Investments - Other |
2.0 |
1.4 |
4.6 |
3.0 |
1.4 |
|
Long Term Investments |
2.6 |
1.7 |
4.9 |
3.2 |
1.6 |
|
Deferred Income Tax - Long Term Asset |
0.8 |
0.8 |
0.7 |
0.4 |
0.6 |
|
Other Long Term Assets, Total |
0.8 |
0.8 |
0.7 |
0.4 |
0.6 |
|
Total Assets |
54.7 |
71.8 |
86.2 |
41.1 |
38.6 |
|
|
|
|
|
|
|
|
Accounts Payable |
5.1 |
12.0 |
7.8 |
5.7 |
5.6 |
|
Accrued Expenses |
0.8 |
1.4 |
1.5 |
0.8 |
0.7 |
|
Notes Payable/Short Term Debt |
0.0 |
0.0 |
0.0 |
0.0 |
0.0 |
|
Current Portion - Long Term Debt/Capital Leases |
16.0 |
23.4 |
28.8 |
13.7 |
11.0 |
|
Customer Advances |
- |
0.2 |
0.9 |
2.3 |
- |
|
Other Payables |
0.7 |
- |
- |
- |
- |
|
Other Current Liabilities |
0.6 |
0.2 |
0.6 |
0.2 |
1.1 |
|
Other Current liabilities, Total |
1.3 |
0.3 |
1.5 |
2.5 |
1.1 |
|
Total Current Liabilities |
23.2 |
37.1 |
39.7 |
22.7 |
18.3 |
|
|
|
|
|
|
|
|
Long Term Debt |
- |
14.1 |
21.0 |
2.3 |
5.6 |
|
Capital Lease Obligations |
- |
0.0 |
0.0 |
- |
- |
|
Total Long Term Debt |
0.0 |
14.1 |
21.1 |
2.3 |
5.6 |
|
Total Debt |
16.0 |
37.5 |
49.9 |
16.0 |
16.5 |
|
|
|
|
|
|
|
|
Deferred Income Tax - LT Liability |
0.6 |
0.7 |
0.8 |
0.2 |
0.4 |
|
Deferred Income Tax |
0.6 |
0.7 |
0.8 |
0.2 |
0.4 |
|
Minority Interest |
0.0 |
1.1 |
0.6 |
0.3 |
0.1 |
|
Reserves |
0.2 |
0.0 |
0.0 |
- |
- |
|
Pension Benefits - Underfunded |
- |
0.0 |
0.0 |
- |
- |
|
Other Long Term Liabilities |
16.1 |
4.3 |
4.6 |
- |
- |
|
Other Liabilities, Total |
16.3 |
4.3 |
4.6 |
- |
- |
|
Total Liabilities |
40.1 |
57.3 |
66.7 |
25.4 |
24.3 |
|
|
|
|
|
|
|
|
Common Stock |
0.6 |
0.6 |
0.8 |
0.6 |
0.7 |
|
Common Stock |
0.6 |
0.6 |
0.8 |
0.6 |
0.7 |
|
Additional Paid-In Capital |
13.0 |
13.3 |
19.4 |
14.6 |
15.2 |
|
Retained Earnings (Accumulated Deficit) |
2.6 |
2.3 |
1.6 |
1.9 |
-0.3 |
|
Treasury Stock - Common |
-0.4 |
-0.4 |
-1.8 |
-1.0 |
-0.2 |
|
Unrealized Gain (Loss) |
-1.2 |
-1.4 |
-0.4 |
-0.5 |
-1.1 |
|
Total Equity |
14.6 |
14.5 |
19.5 |
15.7 |
14.3 |
|
|
|
|
|
|
|
|
Total Liabilities & Shareholders’ Equity |
54.7 |
71.8 |
86.2 |
41.1 |
38.6 |
|
|
|
|
|
|
|
|
Shares Outstanding - Common Stock Primary
Issue |
19.6 |
19.6 |
19.1 |
20.2 |
21.0 |
|
Total Common Shares Outstanding |
19.6 |
19.6 |
19.1 |
20.2 |
21.0 |
|
Treasury Shares - Common Stock Primary Issue |
0.0 |
0.3 |
1.0 |
0.8 |
- |
|
Employees |
376 |
338 |
258 |
232 |
228 |
|
Accumulated Intangible Amort, Suppl. |
- |
1.1 |
1.4 |
0.9 |
0.9 |
|
Deferred Revenue - Current |
- |
3.6 |
5.4 |
2.3 |
0.8 |
|
Deferred Revenue - Long Term |
- |
0.2 |
0.9 |
- |
- |
|
Total Long Term Debt, Supplemental |
13.8 |
14.1 |
21.1 |
2.3 |
5.6 |
|
Long Term Debt Maturing within 1 Year |
1.9 |
2.5 |
4.2 |
0.8 |
0.7 |
|
Long Term Debt Maturing in Year 2 |
1.9 |
2.5 |
4.2 |
0.8 |
0.7 |
|
Long Term Debt Maturing in Year 3 |
1.9 |
2.5 |
4.2 |
0.8 |
0.7 |
|
Long Term Debt Maturing in Year 4 |
2.8 |
2.5 |
2.2 |
- |
- |
|
Long Term Debt Maturing in Year 5 |
2.8 |
2.5 |
2.2 |
- |
- |
|
Long Term Debt Maturing in 2-3 Years |
3.8 |
5.1 |
8.5 |
1.5 |
1.5 |
|
Long Term Debt Maturing in 4-5 Years |
5.6 |
5.0 |
4.3 |
- |
- |
|
Long Term Debt Matur. in Year 6 & Beyond |
2.6 |
1.5 |
4.0 |
0.0 |
3.4 |
Annual Cash Flows
Financials in: USD (mil)
|
|
30-Jun-2013 |
30-Jun-2012 |
30-Jun-2011 |
30-Jun-2010 |
30-Jun-2009 |
|
Period Length |
12 Months |
12 Months |
12 Months |
12 Months |
12 Months |
|
UpdateType/Date |
Updated Normal |
Updated Normal |
Updated Normal |
Updated Normal |
Updated Normal |
|
Filed Currency |
PLN |
PLN |
PLN |
PLN |
PLN |
|
Exchange Rate
(Period Average) |
3.210601 |
3.189476 |
2.917488 |
2.952367 |
2.937006 |
|
Auditor |
HLB Sarnowski
& Wisniewski Sp. z o.o. |
HLB Sarnowski
& Wisniewski Sp. z o.o. |
HLB Sarnowski
& Wisniewski Sp. z o.o. |
HLB Sarnowski
& Wisniewski Sp. z o.o. |
Sarnowski &
Wisniewski Spolka Audytorska SP. Z.O.O. |
|
Auditor Opinion |
Unqualified |
Unqualified with
Explanation |
Unqualified with
Explanation |
Unqualified |
Unqualified |
|
|
|
|
|
|
|
|
Net Income/Starting Line |
-0.7 |
0.7 |
1.7 |
3.4 |
0.0 |
|
Depreciation |
2.4 |
2.3 |
1.9 |
1.2 |
1.1 |
|
Depreciation/Depletion |
2.4 |
2.3 |
1.9 |
1.2 |
1.1 |
|
Other Non-Cash Items |
1.8 |
-0.3 |
1.7 |
0.1 |
0.1 |
|
Non-Cash Items |
1.8 |
-0.3 |
1.7 |
0.1 |
0.1 |
|
Accounts Receivable |
4.1 |
1.3 |
-3.0 |
1.2 |
0.1 |
|
Inventories |
7.2 |
-1.4 |
-6.0 |
-1.6 |
2.1 |
|
Payable/Accrued |
-2.8 |
4.2 |
0.8 |
-1.7 |
1.3 |
|
Taxes Payable |
0.3 |
-0.3 |
0.4 |
-0.5 |
-0.1 |
|
Other Assets & Liabilities, Net |
-3.5 |
-0.3 |
2.0 |
1.9 |
0.1 |
|
Other Operating Cash Flow |
2.5 |
2.7 |
1.8 |
0.6 |
0.9 |
|
Changes in Working Capital |
8.0 |
6.3 |
-4.0 |
-0.1 |
4.4 |
|
Cash from Operating Activities |
11.4 |
9.0 |
1.2 |
4.6 |
5.6 |
|
|
|
|
|
|
|
|
Purchase of Fixed Assets |
-5.8 |
-6.8 |
-5.9 |
-1.6 |
-6.6 |
|
Capital Expenditures |
-5.8 |
-6.8 |
-5.9 |
-1.6 |
-6.6 |
|
Sale of Fixed Assets |
0.1 |
0.1 |
0.2 |
0.0 |
0.1 |
|
Sale/Maturity of Investment |
2.4 |
1.9 |
0.3 |
0.1 |
0.8 |
|
Purchase of Investments |
-2.9 |
-1.1 |
-4.8 |
-1.9 |
-3.1 |
|
Other Investing Cash Flow |
0.5 |
0.5 |
-0.2 |
0.0 |
0.2 |
|
Other Investing Cash Flow Items, Total |
0.0 |
1.4 |
-4.5 |
-1.8 |
-2.0 |
|
Cash from Investing Activities |
-5.7 |
-5.4 |
-10.4 |
-3.4 |
-8.6 |
|
|
|
|
|
|
|
|
Other Financing Cash Flow |
-0.8 |
-2.3 |
-1.1 |
-0.7 |
-0.9 |
|
Financing Cash Flow Items |
-0.8 |
-2.3 |
-1.1 |
-0.7 |
-0.9 |
|
Cash Dividends Paid - Common |
- |
0.0 |
-1.3 |
0.0 |
-1.1 |
|
Total Cash Dividends Paid |
- |
0.0 |
-1.3 |
0.0 |
-1.1 |
|
Repurchase/Retirement
of Common |
- |
-0.4 |
-0.6 |
-1.0 |
-0.2 |
|
Common Stock, Net |
- |
-0.4 |
-0.6 |
-1.0 |
-0.2 |
|
Sale/Issuance of Common/Preferred |
0.1 |
1.1 |
0.0 |
0.3 |
0.6 |
|
Issuance (Retirement) of Stock, Net |
0.1 |
0.7 |
-0.6 |
-0.6 |
0.4 |
|
Long Term Debt Issued |
1.6 |
- |
- |
- |
- |
|
Long Term Debt
Reduction |
-0.1 |
-0.1 |
-0.1 |
- |
0.0 |
|
Long Term Debt, Net |
1.5 |
-0.1 |
-0.1 |
- |
0.0 |
|
Total Debt Issued |
11.1 |
8.5 |
15.3 |
5.1 |
6.4 |
|
Total Debt Reduction |
-18.0 |
-11.4 |
-2.2 |
-4.8 |
-1.5 |
|
Issuance (Retirement) of Debt, Net |
-5.4 |
-2.9 |
13.0 |
0.3 |
4.9 |
|
Cash from Financing Activities |
-6.2 |
-4.5 |
9.9 |
-1.0 |
3.4 |
|
|
|
|
|
|
|
|
Foreign Exchange Effects |
- |
0.0 |
0.0 |
0.0 |
0.0 |
|
Net Change in Cash |
-0.5 |
-1.0 |
0.8 |
0.3 |
0.4 |
|
|
|
|
|
|
|
|
Net Cash - Beginning Balance |
0.6 |
1.6 |
1.0 |
0.7 |
0.2 |
|
Net Cash - Ending Balance |
0.1 |
0.6 |
1.8 |
1.0 |
0.7 |
|
Cash Interest Paid |
2.4 |
2.7 |
1.9 |
0.7 |
0.9 |
|
Cash Taxes Paid |
- |
0.3 |
-0.4 |
0.5 |
0.1 |
Annual Income
Statement
Financials in: USD (mil)
Except for share items (millions) and per share items (actual units)
|
|
30-Jun-2013 |
30-Jun-2012 |
30-Jun-2011 |
30-Jun-2010 |
30-Jun-2009 |
|
Period Length |
12 Months |
12 Months |
12 Months |
12 Months |
12 Months |
|
UpdateType/Date |
Updated Normal |
Updated Normal |
Updated Normal |
Updated Normal |
Updated Normal |
|
Filed Currency |
PLN |
PLN |
PLN |
PLN |
PLN |
|
Exchange Rate
(Period Average) |
3.210601 |
3.189476 |
2.917488 |
2.952367 |
2.937006 |
|
Auditor |
HLB Sarnowski
& Wisniewski Sp. z o.o. |
HLB Sarnowski
& Wisniewski Sp. z o.o. |
HLB Sarnowski
& Wisniewski Sp. z o.o. |
HLB Sarnowski
& Wisniewski Sp. z o.o. |
Sarnowski &
Wisniewski Spolka Audytorska SP. Z.O.O. |
|
Auditor Opinion |
Unqualified |
Unqualified with
Explanation |
Unqualified |
Unqualified |
Unqualified |
|
|
|
|
|
|
|
|
Sale of Products |
64.7 |
65.1 |
52.2 |
39.3 |
42.5 |
|
Sale of Goods and Materials |
18.4 |
19.0 |
33.2 |
26.5 |
20.8 |
|
Total Revenue |
83.1 |
84.1 |
85.3 |
65.9 |
63.4 |
|
|
|
|
|
|
|
|
Legal Provisions/Litigation Expenses |
0.1 |
- |
- |
- |
- |
|
Cost of Products |
45.8 |
46.2 |
34.8 |
24.3 |
27.4 |
|
Cost of Goods and Materials |
14.0 |
13.9 |
26.2 |
20.3 |
15.5 |
|
Selling Expenses |
14.8 |
15.6 |
15.5 |
12.1 |
12.6 |
|
General and Administrative Costs |
5.4 |
5.7 |
6.6 |
4.3 |
3.6 |
|
Gain/Loss on Sale of Fixed Assets |
0.0 |
- |
- |
- |
- |
|
Gain on Sale of Non-Financial Assets |
- |
-0.1 |
-0.1 |
0.0 |
0.0 |
|
Subsidies |
-0.3 |
-0.3 |
-0.2 |
-0.1 |
-0.1 |
|
Other Operating income |
-2.2 |
-2.1 |
-1.6 |
-0.7 |
-0.6 |
|
Loss on Sale of Non-Financial Assets |
0.0 |
0.0 |
0.0 |
0.0 |
0.0 |
|
Oth.operating expenses |
2.0 |
- |
- |
- |
- |
|
Revaluation of Financial Assets |
0.3 |
0.2 |
0.2 |
0.3 |
- |
|
Revaluation of Non-Financial Assets |
0.5 |
0.1 |
0.0 |
0.1 |
0.5 |
|
Other Operating Expense |
- |
1.2 |
0.8 |
0.7 |
1.7 |
|
Total Operating Expense |
80.3 |
80.4 |
82.2 |
61.4 |
60.6 |
|
|
|
|
|
|
|
|
Interest Income |
0.2 |
0.4 |
0.3 |
0.2 |
0.2 |
|
Sale of Investment |
0.0 |
- |
- |
- |
- |
|
Loss on Sale of Investment |
-0.1 |
- |
- |
- |
- |
|
Revaluation of Investment |
-0.9 |
- |
- |
- |
- |
|
Equity Earnings - Before Taxes |
0.0 |
- |
- |
- |
- |
|
Effective G/L on Derivatives - Hedging |
0.1 |
- |
- |
- |
- |
|
Foreign Exchange Gain/Loss |
0.1 |
- |
- |
- |
- |
|
Foreign Exchange Gain/Loss |
-0.2 |
- |
- |
- |
- |
|
Investment Income |
- |
0.1 |
0.0 |
0.0 |
0.0 |
|
Actualisation of Investment Value |
0.0 |
- |
- |
- |
- |
|
Revaluation Income |
- |
0.0 |
0.0 |
0.1 |
0.0 |
|
Other Financial Income |
- |
0.1 |
0.0 |
0.1 |
0.0 |
|
IE on Capital Financing, Gross |
0.0 |
- |
- |
- |
- |
|
Interest Expense |
-2.7 |
-2.6 |
-1.8 |
-0.7 |
-0.9 |
|
Revaluation Expense |
- |
0.0 |
0.0 |
0.0 |
-0.1 |
|
Other Financial Expense |
- |
-1.0 |
0.0 |
-0.7 |
-1.9 |
|
Net Income Before Taxes |
-0.7 |
0.7 |
1.7 |
3.4 |
0.0 |
|
|
|
|
|
|
|
|
Provision for Income Taxes |
-0.1 |
0.4 |
0.1 |
0.3 |
0.1 |
|
Net Income After Taxes |
-0.6 |
0.4 |
1.7 |
3.1 |
-0.1 |
|
|
|
|
|
|
|
|
Minority Interest |
-0.2 |
-0.1 |
-0.3 |
0.1 |
0.0 |
|
Net Income Before Extra. Items |
-0.8 |
0.2 |
1.4 |
3.2 |
-0.1 |
|
Net Income |
-0.8 |
0.2 |
1.4 |
3.2 |
-0.1 |
|
|
|
|
|
|
|
|
Income Available to Com Excl ExtraOrd |
-0.8 |
0.2 |
1.4 |
3.2 |
-0.1 |
|
|
|
|
|
|
|
|
Income Available to Com Incl ExtraOrd |
-0.8 |
0.2 |
1.4 |
3.2 |
-0.1 |
|
|
|
|
|
|
|
|
Basic Weighted Average Shares |
19.6 |
19.8 |
20.1 |
20.6 |
21.0 |
|
Basic EPS Excluding ExtraOrdinary Items |
-0.04 |
0.01 |
0.07 |
0.15 |
-0.01 |
|
Basic EPS Including ExtraOrdinary Items |
-0.04 |
0.01 |
0.07 |
0.15 |
-0.01 |
|
Dilution Adjustment |
- |
- |
- |
- |
0.0 |
|
Diluted Net Income |
-0.8 |
0.2 |
1.4 |
3.2 |
-0.1 |
|
Diluted Weighted Average Shares |
19.6 |
19.8 |
20.1 |
20.6 |
21.0 |
|
Diluted EPS Excluding ExtraOrd Items |
-0.04 |
0.01 |
0.07 |
0.15 |
-0.01 |
|
Diluted EPS Including ExtraOrd Items |
-0.04 |
0.01 |
0.07 |
0.15 |
-0.01 |
|
DPS-Ordinary Shares |
- |
0.00 |
0.00 |
0.06 |
0.05 |
|
Gross Dividends - Common Stock |
0.0 |
0.0 |
0.0 |
- |
- |
|
Normalized Income Before Taxes |
-0.6 |
0.6 |
1.6 |
3.4 |
0.0 |
|
|
|
|
|
|
|
|
Inc Tax Ex Impact of Sp Items |
-0.1 |
0.3 |
0.1 |
0.3 |
0.1 |
|
Normalized Income After Taxes |
-0.5 |
0.3 |
1.5 |
3.1 |
-0.2 |
|
|
|
|
|
|
|
|
Normalized Inc. Avail to Com. |
-0.7 |
0.2 |
1.3 |
3.2 |
-0.2 |
|
|
|
|
|
|
|
|
Basic Normalized EPS |
-0.04 |
0.01 |
0.06 |
0.15 |
-0.01 |
|
Diluted Normalized EPS |
-0.04 |
0.01 |
0.06 |
0.15 |
-0.01 |
|
Interest Expense, Supplemental |
2.7 |
- |
- |
- |
- |
|
Interest Expense |
- |
2.6 |
1.8 |
0.7 |
0.9 |
|
Depreciation |
2.4 |
2.1 |
1.9 |
1.1 |
1.0 |
|
Amortization of Intangibles |
0.0 |
0.0 |
0.2 |
0.2 |
0.1 |
|
Advertising Expense, Supplemental |
- |
2.6 |
3.7 |
2.8 |
- |
|
Current Tax |
0.1 |
0.2 |
0.1 |
0.5 |
0.4 |
|
Current Tax - Total |
0.1 |
0.2 |
0.1 |
0.5 |
0.4 |
|
Deferred Tax |
-0.2 |
0.1 |
0.0 |
-0.2 |
-0.2 |
|
Deferred Tax - Total |
-0.2 |
0.1 |
0.0 |
-0.2 |
-0.2 |
|
Income Tax - Total |
-0.1 |
0.4 |
0.1 |
0.3 |
0.1 |
Annual Balance Sheet
Financials in: USD (mil)
|
|
30-Jun-2013 |
30-Jun-2012 |
30-Jun-2011 |
30-Jun-2010 |
30-Jun-2009 |
|
UpdateType/Date |
Reclassified
Normal |
Updated Normal |
Reclassified
Normal |
Updated Normal |
Updated Normal |
|
Filed Currency |
PLN |
PLN |
PLN |
PLN |
PLN |
|
Exchange Rate |
3.320142 |
3.455808 |
2.7453 |
3.37715 |
3.18305 |
|
Auditor |
HLB Sarnowski
& Wisniewski Sp. z o.o. |
HLB Sarnowski
& Wisniewski Sp. z o.o. |
HLB Sarnowski
& Wisniewski Sp. z o.o. |
HLB Sarnowski
& Wisniewski Sp. z o.o. |
Sarnowski &
Wisniewski Spolka Audytorska SP. Z.O.O. |
|
Auditor Opinion |
Unqualified |
Unqualified with
Explanation |
Unqualified |
Unqualified |
Unqualified |
|
|
|
|
|
|
|
|
Inventories |
9.1 |
- |
- |
- |
- |
|
Materials |
- |
2.3 |
3.0 |
1.3 |
1.1 |
|
Work in Progress |
- |
0.0 |
0.2 |
0.0 |
0.0 |
|
Finished Goods |
- |
6.9 |
6.1 |
2.1 |
2.5 |
|
Merchandise |
- |
6.2 |
8.6 |
5.3 |
4.6 |
|
Prepaid Supplies |
- |
0.0 |
0.0 |
0.5 |
0.2 |
|
Other ST Receivables /Affiliates |
- |
0.2 |
0.0 |
0.0 |
0.0 |
|
Other Receivables |
6.9 |
- |
- |
- |
- |
|
Other Receivables, Net |
1.2 |
- |
- |
- |
- |
|
Tax/Social Security/Other Rcvbls |
- |
2.6 |
2.3 |
1.2 |
1.5 |
|
ST Receivables/Litigation |
- |
0.0 |
0.2 |
0.1 |
0.2 |
|
Other ST Receivables /Others |
0.2 |
0.1 |
0.2 |
0.1 |
0.0 |
|
Trade Receivables |
- |
10.4 |
15.9 |
10.1 |
9.6 |
|
Provision for Doubtful Accounts |
- |
-0.4 |
-0.8 |
-0.2 |
-0.1 |
|
Cash in Bank / Hand |
- |
0.6 |
1.6 |
0.9 |
0.6 |
|
Cash Equivalents |
0.1 |
0.0 |
0.3 |
- |
- |
|
Investments /Affiliates |
1.0 |
1.2 |
1.5 |
1.2 |
1.2 |
|
Investments/ Others |
0.0 |
0.6 |
0.8 |
0.8 |
0.1 |
|
ST Receivables/Affiliates |
1.0 |
- |
- |
- |
- |
|
ST Accruals /Deferrals |
0.1 |
0.2 |
0.2 |
0.2 |
0.4 |
|
Total Current Assets |
19.6 |
30.9 |
40.0 |
23.5 |
21.9 |
|
|
|
|
|
|
|
|
Intangibles, Gross |
- |
1.2 |
1.5 |
1.1 |
1.1 |
|
Amortization of Intangibles |
- |
-1.1 |
-1.4 |
-0.9 |
-0.9 |
|
Intangibles |
0.1 |
- |
- |
- |
- |
|
Goodwill of Susidiary |
7.9 |
7.6 |
9.6 |
0.7 |
0.7 |
|
Tangibles, Net |
23.7 |
- |
- |
- |
- |
|
Land |
- |
1.5 |
1.9 |
0.6 |
0.6 |
|
Buildings |
- |
11.7 |
13.7 |
9.3 |
5.1 |
|
Equipment and Machines |
- |
15.0 |
18.2 |
4.8 |
4.6 |
|
Transport |
- |
2.7 |
3.6 |
1.7 |
1.7 |
|
Other Fixed Assets |
- |
0.9 |
1.2 |
0.7 |
0.7 |
|
Work in Progress |
- |
5.5 |
0.5 |
1.1 |
5.4 |
|
Work in Progress / Prepayments |
- |
1.9 |
0.2 |
0.2 |
- |
|
Depreciation |
- |
-8.6 |
-8.4 |
-5.2 |
-4.6 |
|
LT Financial Assets /Affiliates |
0.6 |
0.3 |
0.3 |
0.1 |
0.1 |
|
LT Financial Assets /Others |
2.0 |
1.4 |
4.6 |
3.0 |
1.4 |
|
Deferred Tax Debit - Asset |
0.8 |
- |
- |
- |
- |
|
Defererd Tax |
- |
0.8 |
0.7 |
0.4 |
0.6 |
|
Total Assets |
54.7 |
71.8 |
86.2 |
41.1 |
38.6 |
|
|
|
|
|
|
|
|
Loans and Credits |
15.8 |
23.4 |
28.7 |
13.7 |
11.0 |
|
ST Liablilities /Affiliates |
- |
0.1 |
0.0 |
0.0 |
0.0 |
|
ST Liabilities /Trade |
5.1 |
11.9 |
7.8 |
5.7 |
5.6 |
|
Pension Reserves |
- |
0.2 |
0.2 |
0.2 |
0.1 |
|
Other Reserves |
0.3 |
0.1 |
0.4 |
0.2 |
0.2 |
|
Other ST Financial Liabilities |
0.1 |
- |
- |
- |
- |
|
Financial Lease |
- |
0.0 |
0.1 |
- |
- |
|
ST Accruals/ Deferrals |
0.8 |
0.4 |
0.4 |
0.3 |
0.4 |
|
Wages |
- |
0.3 |
0.4 |
0.2 |
0.2 |
|
Other Liabilities |
0.3 |
0.0 |
0.2 |
0.0 |
0.0 |
|
Deferred Income |
- |
0.2 |
0.9 |
2.3 |
- |
|
Accrued Expenses |
- |
0.4 |
0.5 |
0.2 |
- |
|
Accruals /Deferrals |
- |
- |
- |
- |
0.9 |
|
Other Payables |
0.7 |
- |
- |
- |
- |
|
Total Current Liabilities |
23.2 |
37.1 |
39.7 |
22.7 |
18.3 |
|
|
|
|
|
|
|
|
Loans and Credits |
- |
14.1 |
21.0 |
2.3 |
5.6 |
|
Financial Lease |
- |
0.0 |
0.0 |
- |
- |
|
Total Long Term Debt |
- |
14.1 |
21.1 |
2.3 |
5.6 |
|
|
|
|
|
|
|
|
Pension Reserves |
- |
0.0 |
0.0 |
- |
- |
|
Other Provisions |
0.2 |
- |
- |
- |
- |
|
Other Reserves |
- |
0.0 |
0.0 |
- |
- |
|
Deferred Tax |
0.6 |
0.7 |
0.8 |
0.2 |
0.4 |
|
Other Liabilities - Non-current |
13.8 |
- |
- |
- |
- |
|
Accruals /Deferrals |
2.3 |
- |
- |
- |
- |
|
Deferred Income |
- |
4.3 |
4.6 |
- |
- |
|
LT Accruals |
- |
0.0 |
0.0 |
- |
- |
|
Minority Interest |
0.0 |
1.1 |
0.6 |
0.3 |
0.1 |
|
Total Liabilities |
40.1 |
57.3 |
66.7 |
25.4 |
24.3 |
|
|
|
|
|
|
|
|
Share Capital |
0.6 |
0.6 |
0.8 |
0.6 |
0.7 |
|
Treasury Stock |
-0.4 |
-0.4 |
-1.8 |
-1.0 |
-0.2 |
|
Reserve Capital |
12.6 |
12.9 |
19.2 |
14.6 |
15.2 |
|
Other Reserve Capital |
0.4 |
0.4 |
0.2 |
0.0 |
- |
|
Revaluation Capital |
-1.2 |
-1.4 |
-0.4 |
-0.5 |
-1.1 |
|
Retained Earnings |
3.3 |
2.2 |
-0.2 |
-0.8 |
- |
|
Net Profit /Loss |
-0.8 |
0.2 |
1.5 |
2.8 |
-0.2 |
|
Write-Down of Profit /Loss |
- |
0.0 |
0.4 |
- |
-0.1 |
|
Total Equity |
14.6 |
14.5 |
19.5 |
15.7 |
14.3 |
|
|
|
|
|
|
|
|
Total Liabilities & Shareholders' Equity |
54.7 |
71.8 |
86.2 |
41.1 |
38.6 |
|
|
|
|
|
|
|
|
S/O-Ordinary Shares |
19.6 |
19.6 |
19.1 |
20.2 |
21.0 |
|
Total Common Shares Outstanding |
19.6 |
19.6 |
19.1 |
20.2 |
21.0 |
|
T/S-Ordinary Shares |
0.0 |
0.3 |
1.0 |
0.8 |
- |
|
Amortization |
- |
1.1 |
1.4 |
0.9 |
0.9 |
|
Deferred Revenue - Long Term |
- |
0.2 |
0.9 |
- |
- |
|
Deferred Revenue - Current |
- |
3.6 |
5.4 |
2.3 |
0.8 |
|
Average Number of Employees |
376 |
- |
- |
- |
- |
|
Full-Time Employees |
- |
338 |
258 |
232 |
228 |
|
LT Debt 1-3 Years |
5.7 |
7.6 |
12.7 |
2.3 |
2.2 |
|
LT Debt 3-5 Years |
5.6 |
5.0 |
4.3 |
- |
- |
|
Remaining LT Debt |
2.6 |
1.5 |
4.0 |
0.0 |
3.4 |
|
Total Long Term Debt, Supplemental |
13.8 |
14.1 |
21.1 |
2.3 |
5.6 |
Annual Cash Flows
Financials in: USD (mil)
|
|
30-Jun-2013 |
30-Jun-2012 |
30-Jun-2011 |
30-Jun-2010 |
30-Jun-2009 |
|
Period Length |
12 Months |
12 Months |
12 Months |
12 Months |
12 Months |
|
UpdateType/Date |
Updated Normal |
Updated Normal |
Updated Normal |
Updated Normal |
Updated Normal |
|
Filed Currency |
PLN |
PLN |
PLN |
PLN |
PLN |
|
Exchange Rate
(Period Average) |
3.210601 |
3.189476 |
2.917488 |
2.952367 |
2.937006 |
|
Auditor |
HLB Sarnowski
& Wisniewski Sp. z o.o. |
HLB Sarnowski
& Wisniewski Sp. z o.o. |
HLB Sarnowski
& Wisniewski Sp. z o.o. |
HLB Sarnowski
& Wisniewski Sp. z o.o. |
Sarnowski &
Wisniewski Spolka Audytorska SP. Z.O.O. |
|
Auditor Opinion |
Unqualified |
Unqualified with
Explanation |
Unqualified |
Unqualified |
Unqualified |
|
|
|
|
|
|
|
|
Net Income |
-0.7 |
0.7 |
1.7 |
3.4 |
0.0 |
|
Depreciation |
2.4 |
2.3 |
1.9 |
1.2 |
1.1 |
|
Foreig Exchange Effects |
0.0 |
-0.2 |
0.2 |
0.2 |
0.0 |
|
Interests and Dividends |
2.5 |
2.7 |
1.8 |
0.6 |
0.9 |
|
Investing Activity |
0.5 |
-0.2 |
0.0 |
-0.1 |
0.1 |
|
Reserves |
-0.3 |
-0.2 |
-0.2 |
0.0 |
0.0 |
|
Inventory |
7.2 |
-1.4 |
-6.0 |
-1.6 |
2.1 |
|
Receivables |
4.1 |
1.3 |
-3.0 |
1.2 |
0.1 |
|
ST Liabilities |
-2.8 |
4.2 |
0.8 |
-1.7 |
1.3 |
|
Accruals /Deferrals |
-3.5 |
-0.3 |
2.0 |
1.9 |
0.1 |
|
Difference from Consolid. with POLGRUNT |
- |
0.0 |
0.4 |
- |
- |
|
Other Adjustments |
1.5 |
0.2 |
1.2 |
0.0 |
0.0 |
|
Income Tax |
0.3 |
-0.3 |
0.4 |
-0.5 |
-0.1 |
|
Cash from Operating Activities |
11.4 |
9.0 |
1.2 |
4.6 |
5.6 |
|
|
|
|
|
|
|
|
Sale of Fixed Assets |
0.1 |
0.1 |
0.2 |
0.0 |
0.1 |
|
Inflows from financial assets |
2.4 |
- |
- |
- |
- |
|
Sale of Investments /Real Estate |
- |
- |
- |
- |
0.0 |
|
Sale of Financial Assets/Others |
- |
1.5 |
0.1 |
- |
- |
|
Other investing income |
0.5 |
- |
- |
- |
- |
|
Loans Repaid/Affiliates |
- |
0.5 |
0.0 |
- |
- |
|
Sale of Financial Assets |
- |
- |
- |
0.0 |
0.1 |
|
Loans Repaid/Other |
- |
0.4 |
0.0 |
0.1 |
0.7 |
|
Interest Received |
- |
0.1 |
0.2 |
0.0 |
0.0 |
|
Purchase of Fixed Assets |
-5.8 |
-6.8 |
-5.9 |
-1.6 |
-6.6 |
|
Purchase of Financial Assets /Affiliates |
-2.9 |
- |
- |
- |
- |
|
Financial Assets /Affiliates |
- |
-0.4 |
-4.0 |
-0.1 |
-1.7 |
|
Financial Assets /Other |
- |
-0.7 |
-0.8 |
-1.7 |
-1.5 |
|
Other Investing Inflows |
- |
0.0 |
0.0 |
0.0 |
0.2 |
|
Loans Granted |
- |
- |
- |
-0.2 |
0.0 |
|
Loans Granted/Other |
- |
0.0 |
0.0 |
0.1 |
0.0 |
|
Other Investing Outflow |
- |
0.0 |
-0.2 |
- |
0.0 |
|
Cash from Investing Activities |
-5.7 |
-5.4 |
-10.4 |
-3.4 |
-8.6 |
|
|
|
|
|
|
|
|
Long Term Debt Issued |
1.6 |
- |
- |
- |
- |
|
Shares Issued |
0.1 |
1.1 |
0.0 |
0.3 |
0.6 |
|
Loans and Credits Issued |
11.1 |
8.5 |
15.3 |
5.1 |
6.4 |
|
Other Financing Cash Flow |
1.6 |
- |
- |
- |
- |
|
Other Financial Inflow |
- |
0.5 |
0.8 |
0.0 |
0.0 |
|
Repurchase of Shares |
- |
-0.4 |
-0.6 |
-1.0 |
-0.2 |
|
Dividends Paid |
- |
0.0 |
-1.3 |
0.0 |
-1.1 |
|
Share of Profit |
- |
- |
- |
- |
0.0 |
|
Repayment of Loans and Credits |
-18.0 |
-11.4 |
-2.2 |
-4.8 |
-1.5 |
|
Financial Liabilities |
- |
- |
- |
- |
0.0 |
|
Financial Leases / Liabilities |
-0.1 |
-0.1 |
-0.1 |
- |
0.0 |
|
Interest Paid |
-2.4 |
-2.7 |
-1.9 |
-0.7 |
-0.9 |
|
Cash from Financing Activities |
-6.2 |
-4.5 |
9.9 |
-1.0 |
3.4 |
|
|
|
|
|
|
|
|
Foreign Exchange Effects |
- |
0.0 |
0.0 |
0.0 |
0.0 |
|
Net Change in Cash |
-0.5 |
-1.0 |
0.8 |
0.3 |
0.4 |
|
|
|
|
|
|
|
|
Net Cash - Beginning Balance |
0.6 |
1.6 |
1.0 |
0.7 |
0.2 |
|
Net Cash - Ending Balance |
0.1 |
0.6 |
1.8 |
1.0 |
0.7 |
|
Cash Interest Paid |
2.4 |
2.7 |
1.9 |
0.7 |
0.9 |
|
Cash Taxes Paid |
- |
0.3 |
-0.4 |
0.5 |
0.1 |
Financial Health
Financials in: USD (mil)
Except for share items (millions) and per share items (actual units)
|
||||||||||||||||||||||||||||||||||||||||||||||||||||||||||||||||||||||||||||||||||||||||||||||||||||||||||||||||||||||||
|
||||||||||||||||||||||||||||||||||||||||||||||||||||||||||||||||||||||||||||||||||||||||||||||||||||||||||||||||||||||||
|
||||||||||||||||||||||||||||||||||||||||||||||||||||||||||||||||||||||||||||||||||||||||||||||||||||||||||||||||||||||||
Annual Ratios
Financials in: USD (mil)
Except for share items (millions) and per share items (actual units)
|
|
|||||||||||||||||||||||||||||||||||||||||||||||||||||||||||||||||||||||||||||||||||||||||||||||||||||||||||||||||||||||||||||||||||||||||||||||||||||||||||||||||||||||||||||||||||||||||||||||||||||||||||||||||||||||||||||||||||||||||||||||||||||||||||||
|
|||||||||||||||||||||||||||||||||||||||||||||||||||||||||||||||||||||||||||||||||||||||||||||||||||||||||||||||||||||||||||||||||||||||||||||||||||||||||||||||||||||||||||||||||||||||||||||||||||||||||||||||||||||||||||||||||||||||||||||||||||||||||||||
|
|||||||||||||||||||||||||||||||||||||||||||||||||||||||||||||||||||||||||||||||||||||||||||||||||||||||||||||||||||||||||||||||||||||||||||||||||||||||||||||||||||||||||||||||||||||||||||||||||||||||||||||||||||||||||||||||||||||||||||||||||||||||||||||
FOREIGN EXCHANGE RATES
|
Currency |
Unit
|
Indian Rupees |
|
US Dollar |
1 |
Rs.61.53 |
|
UK Pound |
1 |
Rs.100.73 |
|
Euro |
1 |
Rs.83.84 |
INFORMATION DETAILS
|
Report Prepared
by : |
MNL |
RATING EXPLANATIONS
|
RATING |
STATUS |
PROPOSED CREDIT LINE |
|
|
>86 |
Aaa |
Possesses an extremely sound financial base with the strongest
capability for timely payment of interest and principal sums |
Unlimited |
|
71-85 |
Aa |
Possesses adequate working capital. No caution needed for credit transaction.
It has above average (strong) capability for payment of interest and
principal sums |
Large |
|
56-70 |
A |
Financial & operational base are regarded healthy. General unfavourable
factors will not cause fatal effect. Satisfactory capability for payment of
interest and principal sums |
Fairly Large |
|
41-55 |
Ba |
Overall operation is considered normal. Capable to meet normal
commitments. |
Satisfactory |
|
26-40 |
B |
Capability to
overcome financial difficulties seems comparatively below average. |
Small |
|
11-25 |
Ca |
Adverse factors are apparent. Repayment of interest and principal sums
in default or expected to be in default upon maturity |
Limited with full
security |
|
<10 |
C |
Absolute credit risk exists. Caution needed to be exercised |
Credit not
recommended |
|
-- |
NB |
New Business |
-- |
This score serves as a reference to assess SC’s credit risk and
to set the amount of credit to be extended. It is calculated from a composite
of weighted scores obtained from each of the major sections of this report. The
assessed factors and their relative weights (as indicated through %) are as
follows:
Financial
condition (40%) Ownership
background (20%) Payment
record (10%)
Credit history
(10%) Market trend
(10%) Operational
size (10%)
This report is issued at your request without any
risk and responsibility on the part of MIRA INFORM PRIVATE LIMITED (MIPL)
or its officials.