MIRA
INFORM REPORT
|
Report Date : |
18.01.2014 |
|
el. No.: |
+ 34 962 725 256 |
|
Fax No.: |
+ 34 96 272 52 55 |
IDENTIFICATION DETAILS
|
Name : |
DRAGOSANZ SOCIEDAD LIMITADA |
|
|
|
|
Registered Office : |
Ctra. L & Apos;Eliana - La Pobla De Vallbona, S/N - Pobla De
Vallbona (La) - 46185 – Valencia |
|
|
|
|
Country : |
Spain |
|
|
|
|
Financials (as on) : |
2012 |
|
|
|
|
Date of Incorporation : |
18.02.1999 |
|
|
|
|
Legal Form : |
Private Company |
|
|
|
|
Line of Business : |
engaged in manufacturing of strongboxes, pneumatic
transport and strongrooms (values and documentation). |
|
|
|
|
No. of Employees : |
15 |
RATING & COMMENTS
|
MIRA’s Rating : |
Ca |
|
RATING |
STATUS |
PROPOSED CREDIT LINE |
|
|
11-25 |
Ca |
Adverse factors are apparent. Repayment of interest and principal sums
in default or expected to be in default upon maturity |
Limited with
full security |
|
Status : |
Moderate |
|
|
|
|
Payment Behaviour : |
Slow & delayed |
|
|
|
|
Litigation : |
Clear |
NOTES :
Any query related to this report can be made
on e-mail : infodept@mirainform.com
while quoting report number, name and date.
ECGC Country Risk Classification List – September 30, 2013
|
Country Name |
Previous Rating (30.06.2013) |
Current Rating (30.09.2013) |
|
Spain |
A2 |
A2 |
|
Risk Category |
ECGC
Classification |
|
Insignificant |
A1 |
|
Low |
A2 |
|
Moderate |
B1 |
|
High |
B2 |
|
Very High |
C1 |
|
Restricted |
C2 |
|
Off-credit |
D |
Spain ECONOMIC OVERVIEW
After almost 15
years of above average GDP growth, the Spanish economy began to slow in late
2007 and entered into a recession in the second quarter of 2008. GDP contracted
by 3.7% in 2009, ending a 16-year growth trend, and by another 0.3% in 2010;
GDP expanded 0.4% in 2011, before contracting 1.4% in 2012. The economy has
once again fallen into recession as deleveraging in the private sector, fiscal
consolidation, and continued high unemployment weigh on domestic demand and
investment, even as exports have shown signs of resiliency. The unemployment
rate rose from a low of about 8% in 2007 to 26.0% in 2012. The economic
downturn has also hurt Spain's public finances. The government budget deficit
peaked at 11.2% of GDP in 2010 and the process to reduce this imbalance has
been slow despite the central government's efforts to raise new tax revenue and
cut spending. Spain reduced its budget deficit to 9.4% of GDP in 2011, and
roughly 7.4% of GDP in 2012, above the 6.3% target negotiated between Spain and
the EU. Although Spain''s large budget deficit and poor economic growth
prospects remain a source of concern for foreign investors, the government''s
ongoing efforts to cut spending and introduce flexibility into the labor
markets are intended to assuage these concerns. The government is also taking
steps to shore up the banking system, namely by using up to $130 billion in EU
funds to recapitalize struggling banks exposed to the collapsed domestic
construction and real estate sectors.
|
Source : CIA |
EXECUTIVE SUMMARY
|
Name: |
DRAGOSANZ
SOCIEDAD LIMITADA |
||||
|
NIF
/ Fiscal code: |
B96846944 |
||||
|
Status: |
ACTIVE |
||||
|
Incorporation
Date: |
18/02/1999 |
||||
|
Register
Data |
Register
Section 8 Sheet 64508 |
||||
|
Last
Publication in BORME: |
24/12/2012
[Appointments] |
||||
|
Last
Published Account Deposit: |
2012 |
||||
|
Share
Capital: |
9.018 |
||||
|
|
|||||
|
Localization: |
CTRA.
L'ELIANA - LA POBLA DE VALLBONA, S/N - POBLA DE VALLBONA (LA) -
46185 - VALENCIA |
||||
|
Telephone
- Fax - Email - Website: |
Ph.:.
902111172 Email. info@dragosanz.com
Website.
www.dragosanz.com |
||||
|
|
|
||||
|
Operating Address 1 |
Pista de Ademuz, salida 17A, Pol. Industrial IBM. Parcela,2, Spain |
||||
|
Operating Address 2 |
Apdo De Correos, 177, 46185 Pobla De Vallbona, Valencia, Spain |
||||
|
|
|||||
|
Activity: |
|
||||
|
NACE: |
2599
- Manufacture of other fabricated metal products n.e.c. |
||||
|
Registered
Trademarks: |
|
||||
|
Audited
/ Opinion: |
No |
||||
|
Tenders
and Awards: |
0
for a total cost of 0 |
||||
|
Subsidies: |
0
for a total cost of 0 |
||||
|
Quality
Certificate: |
No |
||||
|
|
|||||
|
|
|||||
|
Defaults,
Legal Claims and Insolvency Proceedings : |
|||||
|
|
|||||
|
|
|
Number |
Amount
(€) |
Most
Recent Entry |
|
|
Insolvency
Proceedings, Bankruptcy and Suspension of Payments |
|
Unpublished |
--- |
--- |
|
|
Defaults
on debt with Financial Institutions and Large Companies |
|
3 |
7.178,9 |
--- |
|
|
Judicial
Claims (Notices, Executive Proceedings, Attachments, Auctions, Bad Debt) |
|
None |
0 |
--- |
|
|
Proceedings
heard by the Civil Court |
|
Unpublished |
0 |
--- |
|
|
Proceedings
heard by the Labour Court |
|
Unpublished |
0 |
--- |
|
|
Partners: |
||
|
|
||
|
Shares: |
0 |
|
|
Other
Links: |
0 |
|
|
No.
of Active Corporate Bodies: |
SINGLE
ADMINISTRATOR 1 |
|
|
Ratios |
2012 |
2011 |
Change |
|
|
|
Guarantees: |
|
||||
|
Properties
Registered: |
Company
NO, Administrator NO |
||||
|
Financing
/ Guarantee Sources : |
Sources
NO, Guarantees NO |
||||
|
|
|||||
|
|
|||||
|
INVESTIGATION
SUMMARY |
|||||
|
Business
started in 1876 by José Sanz Feliu with the name of TALLERES SANZ SA. The
subject was founded in 1999 and it is the fifth generation in Sanz family who
is running the company. The subject is engaged in manufacturing of
strongboxes, pneumatic transport and strongrooms (values and documentation).
The subject has 15 employees. According to the above, we consider that the
subject can stay involved in normal credit operations. |
|||||
Identification
|
Social
Denomination: |
DRAGOSANZ SOCIEDAD
LIMITADA |
|
NIF
/ Fiscal code: |
B96846944 |
|
Corporate
Status: |
ACTIVE |
|
Start
of activity: |
1999 |
|
Registered
Office: |
CTRA. L'ELIANA -
LA POBLA DE VALLBONA, S/N |
|
Locality: |
POBLA DE VALLBONA (LA) |
|
Province: |
VALENCIA |
|
Postal
Code: |
46185 |
|
Telephone: |
902111172 |
|
Fax: |
962725255 |
|
Website: |
|
|
Email: |
|
|
Interviewed
Person: |
Gestiones diversas. No
facilitan datos. |
|
Activity |
|
|
NACE: |
2599 |
|
Additional
Information: |
The subject is engaged in
manufacturing of strong rooms, strong boxs and pneumatic transport (values
and documentation). |
|
Additional
Address: |
Registered office, office
and other premises are located in CTRA. L'ELIANA - LA POBLA DE
VALLBONA, S/N 46185 POBLA DE VALLBONA (LA) |
|
Franchise: |
No |
|
Import
/ export: |
IMPORTS / EXPORTS |
|
Future
Perspective: |
Consolidation |
|
Industry
situation: |
Maturity |
|
Number of Employees |
|||||
|
|
Year |
No. of employees |
Established |
Incidentals |
|
|
|
2014 |
15 |
|
|
|
|
Chronological Summary
|
|||
|
|
|
|
|
|
|
Year |
Act |
|
|
|
1999 |
Appointments/ Re-elections
(1) Company Formation (1) |
|
|
|
2000 |
Accounts deposit (ejer.
1999) |
|
|
|
2002 |
Accounts deposit (ejer.
2000, 2001) Appointments/ Re-elections (1) Cessations/ Resignations/
Reversals (1) |
|
|
|
2004 |
Accounts deposit (ejer. 2002,
2003) Appointments/ Re-elections (1) Change of Social address (1) |
|
|
|
2006 |
Accounts deposit (ejer.
2004, 2005) |
|
|
|
2007 |
Accounts deposit (ejer.
2006) Appointments/ Re-elections (1) Cessations/ Resignations/ Reversals (1) |
|
|
|
2008 |
Accounts deposit (ejer.
2007) |
|
|
|
2009 |
Accounts deposit (ejer.
2008) |
|
|
|
2010 |
Accounts deposit (ejer.
2009) Increase of Capital (1) |
|
|
|
2011 |
Accounts deposit (ejer.
2010) |
|
|
|
2012 |
Accounts deposit (ejer.
2011) Appointments/ Re-elections (1) Cessations/ Resignations/ Reversals (1) |
|
|
|
2013 |
Accounts deposit (ejer.
2012) |
|
Breakdown
of Owners' Equity
|
|
|
Registered
Capital: |
9.018 |
|
Paid
up capital: |
9.018 |
|
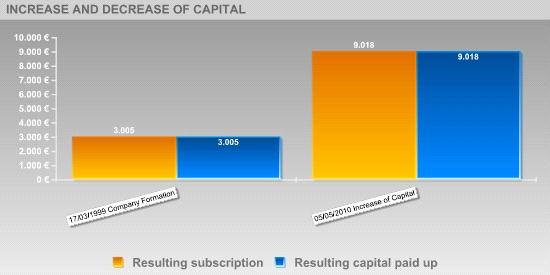
Updated
Evolution of the Subscribed and Paid-in Capital |
|||||
|
|
|
|
|
|
|
|
|
|||||
|
|
|
|
|
|
|
|
Publishing Date |
Registration Type |
Capital Subscribed |
Paid up capital |
Underwritten result |
Disbursed Result |
|
17/03/1999 |
Company Formation |
3.005 |
3.005 |
3.005 |
3.005 |
|
05/05/2010 |
Increase of Capital |
6.012 |
6.012 |
9.018 |
9.018 |
|
Active Social Bodies |
|
|
|
|
|
Post published |
Social Body's Name |
Appointment Date |
Other Positions in this
Company |
|
SINGLE ADMINISTRATOR |
SANZ FERNANDEZ ALFONSO |
17/12/2012 |
2 |
|
JOINT ATTORNEY |
SANZ ALARTE ALFONSO MIGUEL |
29/11/2004 |
2 |
|
|
FERNANDEZ LOPEZ ADORACION |
29/11/2004 |
2 |
|
Historical Social Bodies |
|
|
|
|
|
Social Body's Name |
Post published |
End Date |
Other Positions in this
Company |
|
FERNANDEZ LOPEZ ADORACION |
PROXY |
29/11/2004 |
2 |
|
SANZ ALARTE ALFONSO MIGUEL |
SINGLE ADMINISTRATOR |
10/06/2002 |
2 |
|
SANZ FERNANDEZ ALFONSO |
SINGLE ADMINISTRATOR |
30/07/2007 |
2 |
|
SANZ FERNANDEZ SUSANA |
SINGLE ADMINISTRATOR |
17/12/2012 |
1 |
|
Executive board |
||
|
Post |
NIF |
Name |
|
ADMINISTRATOR |
|
ALFONSO SANZ FERNANDEZ |
|
MANAGING DIRECTOR |
|
ALFONSO SANZ FERNANDEZ |
|
Defaults, Legal Claims and Insolvency Proceedings |
|
|
|
|
Section enabling assessment of the degree of compliance of the company queried with its payment obligations. It provides information on the existence and nature of all stages of Insolvency and Legal Proceedings published with reference to the Company in the country's various Official Bulletins and national newspapers, as well Defaults Registered in the main national credit bureaus (ASNEF Industrial and RAI ).
>
Summary
Chronological
summary
|
|
|
Number
of Publications |
Amount
(_) |
Start
date |
End
date |
|
Insolvency
Proceedings, Bankruptcy and Suspension of Payments |
|
Unpublished |
--- |
--- |
--- |
|
Request/Declaration |
|
0 |
--- |
date |
|
|
Proceedings |
|
--- |
--- |
|
--- |
|
Resolution |
|
--- |
--- |
|
--- |
|
Defaults
on debt with Financial Institutions and Large Companies |
Bank and Commercial Delinquency |
3 |
0 |
30/08/2013 |
15/01/2014 |
|
Status:
Friendly |
|
1 |
276.16 |
30/08/2013 |
30/08/2013 |
|
Status:
Pre-Litigation |
|
1 |
1502.32 |
01/11/2013 |
01/01/2014 |
|
Status:
Litigation |
|
--- |
|
|
|
|
Status:
Non-performing |
|
--- |
|
|
|
|
Status:
insolvency proceedings, bankruptcy and suspension of payments |
|
--- |
|
|
|
|
Other
status |
|
1 |
|
|
|
|
Legal
and Administrative Proceedings |
|
Unpublished |
--- |
|
|
|
Notices
of defaults and enforcement |
|
--- |
--- |
|
--- |
|
Seizures |
|
--- |
--- |
|
--- |
|
Auctions |
|
--- |
--- |
|
--- |
|
Declarations
of insolvency and bad debt |
|
--- |
--- |
|
--- |
|
Proceedings
heard by the Civil Court |
|
Unpublished |
--- |
|
|
|
Proceedings
heard by the Labour Court |
|
Unpublished |
--- |
|
|
>
Details
IMPAGOS
EN ENTIDADES FINANCIERAS Y GRANDES EMPRESAS
Section comprising a list of the instances of default recorded in the
ASNEF Industrial file under the name of .
|
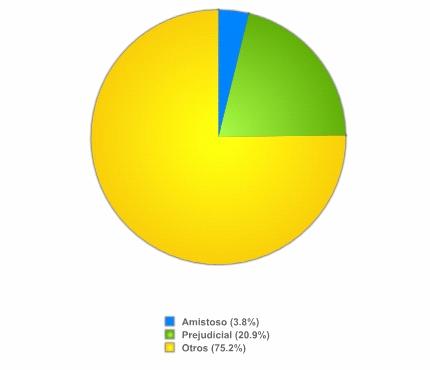
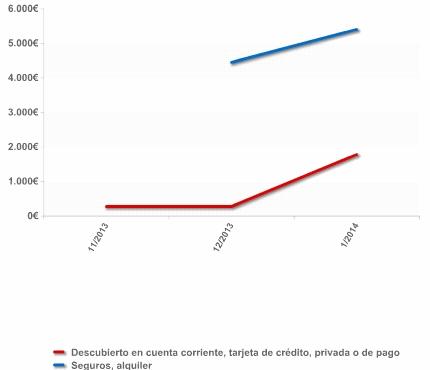
33.33% of contract defaults, which represent 20.93% of the amount, are
in pre-judicial debt collection status; the debt has been forwarded to the
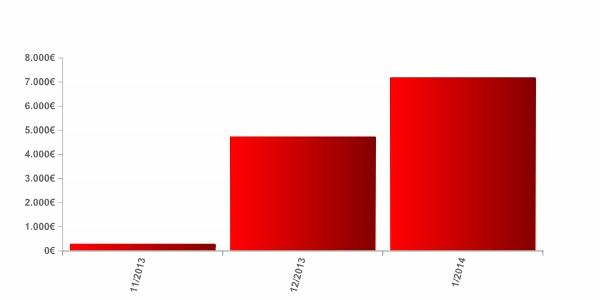
creditor entities' legal departments. The total unpaid amount registered with ASNEF Empresas is the maximum
one among all of this debtor's reported defaults available. It must be noted that the total unpaid amount registered with ASNEF
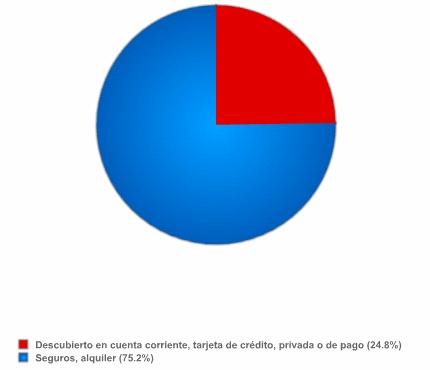
Empresas has increased significantly in the past six months. It has defaulted in its contractual obligations with financial
entities and miscellaneous companies. Furthermore, 75.23% of the unpaid
amount involve contracts with Sociedad de Seguros Crediticios. |
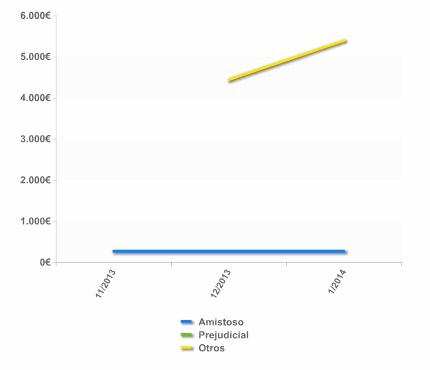
List
of current instances of default for each of the transactions in progress
|
Type
of creditor |
Product |
Value
of transactions (_) |
Status |
No.
of defaults |
Default
balance (_) |
Date
of first default |
Date
of last default |
|
SOCIEDADES
DE SEGUROS CREDITICIOS |
Seguros,
alquiler |
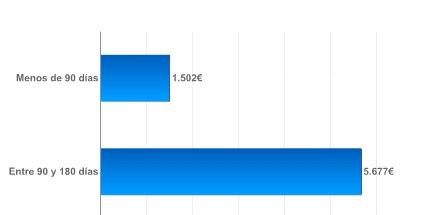
100000.00 |
Otros |
3 |
5400.42 |
11/09/13 |
21/09/13 |
|
ESTABLECIMIENTOS
FINANCIEROS DE CREDITO |
Descubierto
en cuenta corriente, tarjeta de crédito, privada o de pago |
--- |
Prejudicial |
--- |
1502.32 |
01/11/13 |
01/01/14 |
|
Bancos |
Descubierto
en cuenta corriente, tarjeta de crédito, privada o de pago |
--- |
Amistoso |
--- |
276.16 |
30/08/13 |
30/08/13 |
|
|
|
7.178,9 |
|
|
|
||
|
Default
by status
|
Default
by product
|
|
Age
of current debt
|
|
Change
in values of defaults and settled debts
|
Changes in defaults by status
|
Changes in defaults by product
|
|
Change
in values of defaults and settled debts
|
Legal
Notice:
This
data has been obtained from consultation of the ASNEF Industrial register. It
may only be used for the purposes of awarding credit, monitoring credit and
managing loans. This data may not be reused or included in any database, and
may not be ceded .
Basis for rating
|
Positive Factors |
Adverse Factors |
|
|
It has been found to have
irregular payment performance and has not paid all of its debts timely. ROE lowering effect. Total
Economic Rate of Return in 2012 is lower than the Borrowing Cost; therefore,
the leverage is lower than the unit and has a ROE lowering effect. This
indicates that the Company should not incur any further debts, as this would
reduce its shareholders' profitability. Financial Cost Increase.
The company's average financial expense in 2012 with respect to its operating
gross result is 71.96%. As this value is higher than that of the previous
fiscal year, the financial situation may be hindered. The staff number decreased
in the last fiscal year. Possible difficulty
accessing financing. Uncertainties about economic recovery will hinder access
to credit for new projects or for obtaining the liquidity necessary for
short-term needs. |
|
Probability of default |
|
|
|
|
> Probabilidad Estimada
de Impago para los próximos 12 meses: 33.1 %
> Latest Rating Changes :
|
Sector
in which comparison is carried out : 259 Manufacture
of other fabricated metal products |
|
|
Relative
Position:
|
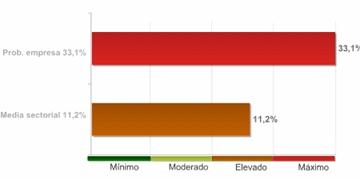
The
company's comparative analysis with the rest of the companies that comprise the
sector, shows the company holds a worse position with regard to the probability
of non-compliance.
The
99% of the companies of the sector DRAGOSANZ SOCIEDAD LIMITADA belongs to shows
a lower probability of non-compliance.
The probability of the company's non-compliance with its payment obligations within deadlines estimated by our qualifications models is 33.15%.
In the event they fail to comply with the payment, the seriousness of the loss will depend on factors such as the promptness of the commencement of the charging management, the existence of executive documents which match the credit or the existence of guarantees and free debt assets under the name of the debtor. Therefore, the probability of non-compliance should not be solely interpreted as the total loss of the owed amount.
|
LEGAL CLAIMS |
|
Summary
of Judicial Claims |
|
|
|
|
|
|
|
|
||
|
|
|
No se han publicado |
|
|
|
|
No se han publicado |
|
|
|
|
||
|
|
|
No se han publicado |
|
|
|
|
No se han publicado |
|
|
|
|
No se han publicado |
|
|
|
|
No se han publicado |
|
|
|
|
||
|
|
|
No se han publicado |
|
|
|
|
No se han publicado |
|
|
|
|
||
|
|
|
No se han publicado |
|
|
Turnover |
|
|
Total
Sales 2012 |
1.630.617,44 |
|
Financial Accounts and Balance Sheets |
Financial Years Presented
|
Ejercicio |
Tipo
de Cuentas Anuales |
Fecha
Presentacion |
|
2012 |
Normales |
July
2013 |
|
2011 |
Normales |
July
2012 |
|
2010 |
Normales |
September
2011 |
|
2009 |
Normales |
July
2010 |
|
2008 |
Normales |
September
2009 |
|
2007 |
Normales |
August
2008 |
|
2006 |
Normales |
September
2007 |
|
2005 |
Normales |
November
2006 |
|
2004 |
Normales |
December
2005 |
|
2003 |
Normales |
August
2004 |
|
2002 |
Normales |
May
2004 |
|
2001 |
Normales |
October
2002 |
|
2000 |
Normales |
December
2001 |
|
1999 |
Normales |
August
2000 |
The data in the report regarding the last Company Accounts submitted by the company is taken from the TRADE REGISTER serving the region in which the company's address is located 31/12/2012
> Balance en formato Pyme de acuerdo al Nuevo Plan General Contable 2007
Information corresponding to the fiscal year 2012 2011 2010 2009 2008 is taken from information submitted to the TRADE REGISTER. Data corresponding to fiscal years before 2012 2011 2010 2009 2008 has been compiled based on the equivalence criteria stipulated in Act JUS/206/2009. Where the provisions of the Act did not establish relevant equivalence criteria
|
|
ORIGINAL |
ORIGINAL |
ORIGINAL |
ORIGINAL |
ORIGINAL |
|
|
Assets |
2012 |
2011 |
2010 |
2009 |
2008 |
|
|
A)
NON-CURRENT ASSETS: 11000 |
863.240,00 |
811.632,00 |
752.579,00 |
602.068,00 |
559.010,00 |
|
|
I. Intangible fixed assets : 11100 |
3.535,00 |
3.535,00 |
2.605,00 |
2.605,00 |
1.207,00 |
|
|
II. Tangible fixed assets : 11200 |
551.474,00 |
499.208,00 |
441.161,00 |
290.651,00 |
247.796,00 |
|
|
III. Real estate investment: 11300 |
0,00 |
0,00 |
0,00 |
0,00 |
0,00 |
|
|
IV. Long-term investments in Group companies and associates :
11400 |
0,00 |
0,00 |
0,00 |
0,00 |
0,00 |
|
|
V. Long-term financial investments: 11500 |
308.232,00 |
308.889,00 |
308.813,00 |
308.811,00 |
310.007,00 |
|
|
VI. Assets for deferred tax : 11600 |
0,00 |
0,00 |
0,00 |
0,00 |
0,00 |
|
|
VII. Non-current trade debtors : 11700 |
0,00 |
0,00 |
0,00 |
0,00 |
0,00 |
|
|
B)
CURRENT ASSETS: 12000 |
1.535.018,00 |
1.630.651,00 |
1.548.078,00 |
1.778.684,00 |
1.846.480,00 |
|
|
I. Stocks : 12200 |
582.668,00 |
552.512,00 |
435.766,00 |
441.866,00 |
355.130,00 |
|
|
II. Trade debtors and others receivable accounts : 12300 |
730.739,00 |
809.868,00 |
805.825,00 |
803.193,00 |
957.444,00 |
|
|
1. Trade debtors / accounts receivable:
12380 |
709.595,00 |
786.491,00 |
772.248,00 |
798.979,00 |
901.405,00 |
|
|
a) Long-term receivables
from sales and services supplied : 12381 |
0,00 |
0,00 |
0,00 |
0,00 |
0,00 |
|
|
b) Customers for
sales and provisions of services : 12382 |
709.595,00 |
786.491,00 |
772.248,00 |
798.979,00 |
901.405,00 |
|
|
2. Called up share capital: 12370 |
0,00 |
0,00 |
0,00 |
0,00 |
0,00 |
|
|
3. Other accounts receivable : 12390 |
21.144,00 |
23.377,00 |
33.577,00 |
4.213,00 |
56.039,00 |
|
|
III. Short-term investment in Group companies and associates:
12400 |
0,00 |
0,00 |
0,00 |
0,00 |
0,00 |
|
|
IV. Short-term financial investments : 12500 |
205.169,00 |
246.171,00 |
259.133,00 |
420.376,00 |
440.905,00 |
|
|
V. Short-term accruals : 12600 |
0,00 |
0,00 |
0,00 |
0,00 |
0,00 |
|
|
VI. Cash and other equivalent liquid assets : 12700 |
16.442,00 |
22.100,00 |
47.353,00 |
113.249,00 |
93.002,00 |
|
|
TOTAL
ASSETS (A + B) : 10000 |
2.398.259,00 |
2.442.283,00 |
2.300.658,00 |
2.380.752,00 |
2.405.490,00 |
|
|
|
ORIGINAL |
ORIGINAL |
ORIGINAL |
ORIGINAL |
ORIGINAL |
|
|
Liabilities
and Net Worth |
2012 |
2011 |
2010 |
2009 |
2008 |
|
|
A)
NET WORTH: 20000 |
1.220.446,00 |
1.218.857,00 |
1.212.781,00 |
1.191.125,00 |
1.146.254,00 |
|
|
A-1)
Shareholders' equity: 21000 |
1.220.446,00 |
1.218.857,00 |
1.212.781,00 |
1.191.125,00 |
1.146.254,00 |
|
|
I. Capital: 21100 |
9.018,00 |
9.018,00 |
9.018,00 |
3.005,00 |
3.005,00 |
|
|
1. Registered capital : 21110 |
9.018,00 |
9.018,00 |
9.018,00 |
3.005,00 |
3.005,00 |
|
|
2. (Uncalled capital): 21120 |
0,00 |
0,00 |
0,00 |
0,00 |
0,00 |
|
|
II. Share premium: 21200 |
0,00 |
0,00 |
0,00 |
0,00 |
0,00 |
|
|
III. Reserves: 21300 |
1.209.839,00 |
1.203.763,00 |
1.188.119,00 |
1.143.249,00 |
1.090.502,00 |
|
|
IV. (Common stock equity): 21400 |
0,00 |
0,00 |
0,00 |
0,00 |
0,00 |
|
|
V. Profit or loss brought forward: 21500 |
0,00 |
0,00 |
0,00 |
0,00 |
0,00 |
|
|
VI. Other shareholders' contributions: 21600 |
0,00 |
0,00 |
0,00 |
0,00 |
0,00 |
|
|
VII. Result of the period: 21700 |
1.588,00 |
6.076,00 |
15.643,00 |
44.871,00 |
52.747,00 |
|
|
VIII. (Interim dividend): 21800 |
0,00 |
0,00 |
0,00 |
0,00 |
0,00 |
|
|
A-2)
Changes in net worth : 22000 |
0,00 |
0,00 |
0,00 |
0,00 |
0,00 |
|
|
A-3)
Received subsidies, donations and legacies: 23000 |
0,00 |
0,00 |
0,00 |
0,00 |
0,00 |
|
|
B)
NON-CURRENT LIABILITIES: 31000 |
141.128,00 |
104.294,00 |
226.945,00 |
289.366,00 |
321.368,00 |
|
|
I. Long-term provisions: 31100 |
0,00 |
0,00 |
0,00 |
0,00 |
0,00 |
|
|
II. Long-term creditors : 31200 |
141.128,00 |
104.294,00 |
226.945,00 |
289.366,00 |
321.368,00 |
|
|
1. Amounts owed to credit institutions:
31220 |
141.128,00 |
104.294,00 |
126.945,00 |
278.027,00 |
247.147,00 |
|
|
2. Creditors from financial leasing :
31230 |
0,00 |
0,00 |
0,00 |
0,00 |
0,00 |
|
|
3. Other long-term creditors : 31290 |
0,00 |
0,00 |
100.000,00 |
11.339,00 |
74.221,00 |
|
|
III. Long-term debts with Group companies and associates:
31300 |
0,00 |
0,00 |
0,00 |
0,00 |
0,00 |
|
|
IV. Liabilities for deferred tax: 31400 |
0,00 |
0,00 |
0,00 |
0,00 |
0,00 |
|
|
V. Long-term accruals: 31500 |
0,00 |
0,00 |
0,00 |
0,00 |
0,00 |
|
|
VI. Non-current trade creditors : 31600 |
0,00 |
0,00 |
0,00 |
0,00 |
0,00 |
|
|
VII. Special long-term debts : 31700 |
0,00 |
0,00 |
0,00 |
0,00 |
0,00 |
|
|
C)
CURRENT LIABILITIES : 32000 |
1.036.685,00 |
1.119.132,00 |
860.932,00 |
900.261,00 |
937.869,00 |
|
|
I. Short-term provisions: 32200 |
0,00 |
0,00 |
0,00 |
0,00 |
0,00 |
|
|
II. Short-term creditors : 32300 |
520.677,00 |
687.297,00 |
447.871,00 |
495.464,00 |
545.349,00 |
|
|
1. Amounts owed to credit institutions:
32320 |
520.661,00 |
687.297,00 |
447.871,00 |
495.464,00 |
545.349,00 |
|
|
2. Creditors from financial leasing :
32330 |
0,00 |
0,00 |
0,00 |
0,00 |
0,00 |
|
|
3. Other short-term creditors :
32390 |
16,00 |
0,00 |
0,00 |
0,00 |
0,00 |
|
|
III. Short-term amounts owed to group and associated companies:
32400 |
0,00 |
0,00 |
0,00 |
0,00 |
0,00 |
|
|
IV. Trade creditors and other accounts payable: 32500 |
516.009,00 |
431.835,00 |
413.061,00 |
404.797,00 |
392.519,00 |
|
|
1. Suppliers: 32580 |
158.160,00 |
103.835,00 |
128.807,00 |
142.143,00 |
149.422,00 |
|
|
a) Long-term debts :
32581 |
0,00 |
0,00 |
0,00 |
0,00 |
0,00 |
|
|
b) Short-term debts :
32582 |
158.160,00 |
103.835,00 |
128.807,00 |
142.143,00 |
149.422,00 |
|
|
2. Other creditors: 32590 |
357.849,00 |
328.000,00 |
284.255,00 |
262.655,00 |
243.098,00 |
|
|
V. Short-term accruals : 32600 |
0,00 |
0,00 |
0,00 |
0,00 |
0,00 |
|
|
VI. Special short-term debts : 32700 |
0,00 |
0,00 |
0,00 |
0,00 |
0,00 |
|
|
TOTAL
NET WORTH AND LIABILITIES (A + B + C) : 30000 |
2.398.259,00 |
2.442.283,00 |
2.300.658,00 |
2.380.752,00 |
2.405.490,00 |
|
|
|
ORIGINAL |
ORIGINAL |
ORIGINAL |
ORIGINAL |
ORIGINAL |
|
|
Profit
and Loss |
2012 |
2011 |
2010 |
2009 |
2008 |
|
|
1. Net turnover: 40100 |
1.630.617,00 |
1.370.852,00 |
1.473.146,00 |
1.489.201,00 |
1.887.901,00 |
|
|
2. Changes in stocks of finished goods and work in progress:
40200 |
0,00 |
0,00 |
0,00 |
0,00 |
0,00 |
|
|
3. Works carried out by the company for its assets: 40300 |
49.947,00 |
71.241,00 |
77.686,00 |
58.606,00 |
0,00 |
|
|
4. Supplies : 40400 |
-823.401,00 |
-593.410,00 |
-724.929,00 |
-557.279,00 |
-692.554,00 |
|
|
5. Other operating income: 40500 |
0,00 |
1.680,00 |
40.227,00 |
0,00 |
3.000,00 |
|
|
6. Personnel costs: 40600 |
-498.216,00 |
-486.282,00 |
-481.854,00 |
-502.936,00 |
-644.411,00 |
|
|
7. Other operating costs: 40700 |
-305.699,00 |
-316.804,00 |
-336.180,00 |
-375.224,00 |
-381.974,00 |
|
|
8. Amortisation of fixed assets: 40800 |
-13.665,00 |
-13.665,00 |
-13.665,00 |
-18.794,00 |
-34.958,00 |
|
|
9. Allocation of subsidies of non-financial fixed assets and
other: 40900 |
0,00 |
0,00 |
0,00 |
0,00 |
0,00 |
|
|
10. Excess provisions : 41000 |
0,00 |
0,00 |
0,00 |
0,00 |
0,00 |
|
|
11. Impairment and result of transfers of fixed assets:
41100 |
0,00 |
0,00 |
0,00 |
-12.727,00 |
-5.517,00 |
|
|
12. Other results : 41300 |
949,00 |
837,00 |
6.198,00 |
0,00 |
-382,00 |
|
|
A)
OPERATING INCOME (1 + 2 + 3 + 4 + 5 + 6 + 7 + 8 + 9 + 10 + 11 + 12) :
49100 |
40.532,00 |
34.448,00 |
40.630,00 |
80.846,00 |
131.105,00 |
|
|
13. Financial income : 41400 |
0,00 |
0,00 |
1,00 |
25,00 |
23,00 |
|
|
a) Allocation of financial subsidies,
donations and legacies: 41430 |
0,00 |
0,00 |
0,00 |
0,00 |
0,00 |
|
|
b) Other financial income: 41490 |
0,00 |
0,00 |
1,00 |
25,00 |
23,00 |
|
|
14. Financial expenditure : 41500 |
-38.318,00 |
-26.347,00 |
-19.543,00 |
-20.371,00 |
-56.761,00 |
|
|
15. Changes in fair value of financial instruments :
41600 |
0,00 |
0,00 |
0,00 |
0,00 |
0,00 |
|
|
16. Exchange rate differences: 41700 |
-24,00 |
0,00 |
6,00 |
-2,00 |
-3.985,00 |
|
|
17. Impairment and result for transfers of financial
instruments : 41800 |
0,00 |
0,00 |
0,00 |
0,00 |
0,00 |
|
|
18. Other financial income and expenditure: 42100 |
0,00 |
0,00 |
0,00 |
0,00 |
0,00 |
|
|
a) Incorporation of financial expenditure
to assets: 42110 |
0,00 |
0,00 |
0,00 |
0,00 |
0,00 |
|
|
b) Financial income from arrangement with
creditors: 42120 |
0,00 |
0,00 |
0,00 |
0,00 |
0,00 |
|
|
c) Other income and expenditure:
42130 |
0,00 |
0,00 |
0,00 |
0,00 |
0,00 |
|
|
B)
FINANCIAL REVENUE ( 13 + 14 + 15 + 16 + 17 +18 ) : 49200 |
-38.341,00 |
-26.347,00 |
-19.537,00 |
-20.348,00 |
-60.723,00 |
|
|
C)
NET RESULT BEFORE TAXES ( A + B ) : 49300 |
2.191,00 |
8.102,00 |
21.094,00 |
60.498,00 |
70.382,00 |
|
|
19. Income taxes : 41900 |
-603,00 |
-2.025,00 |
-5.450,00 |
-15.627,00 |
-17.635,00 |
|
|
D)
RESULT OF THE PERIOD ( C + 19 ) : 49500 |
1.588,00 |
6.076,00 |
15.643,00 |
44.871,00 |
52.747,00 |
|
>
Normal Balance Sheet under the rules of the 1990 General Accounting Plan
(repealed since 1st January of 2008)
Information corresponding to the fiscal year 2012 2011 2010 2009 2008 has been compiled based on the equivalence criteria stipulated in Act JUS/206/2009. Where the provisions of the Act did not establish relevant equivalence criteria.
|
|
EQUIVALENCIA |
EQUIVALENCIA |
EQUIVALENCIA |
EQUIVALENCIA |
EQUIVALENCIA |
|
|
ASSETS |
2012 |
2011 |
2010 |
2009 |
2008 |
|
|
A)
SHAREHOLDERS (PARTNERS) BY UNCALLED SUSCRIBED CAPITAL: |
0,00 |
0,00 |
0,00 |
0,00 |
0,00 |
|
|
B)
FIXED ASSETS: |
863.240,00 |
811.632,00 |
752.579,00 |
602.068,00 |
559.010,00 |
|
|
I. Formation expenses: |
0,00 |
0,00 |
0,00 |
0,00 |
0,00 |
|
|
II. Intangible fixed assets: |
3.535,00 |
3.535,00 |
2.605,00 |
2.605,00 |
1.207,00 |
|
|
III. Tangible fixed assets: |
551.474,00 |
499.208,00 |
441.161,00 |
290.651,00 |
247.796,00 |
|
|
IV. Financial investments: |
308.232,00 |
308.889,00 |
308.813,00 |
308.811,00 |
310.007,00 |
|
|
V. Own shares: |
0,00 |
0,00 |
0,00 |
0,00 |
0,00 |
|
|
VI. Long-term trade receivables: |
0,00 |
0,00 |
0,00 |
0,00 |
0,00 |
|
|
C)
Deferred expenses: |
0,00 |
0,00 |
0,00 |
0,00 |
0,00 |
|
|
D)
CURRENT ASSETS: |
1.535.018,00 |
1.630.651,00 |
1.548.078,00 |
1.778.684,00 |
1.846.480,00 |
|
|
I. Called-up share capital (not paid): |
0,00 |
0,00 |
0,00 |
0,00 |
0,00 |
|
|
II. Stocks: |
582.668,00 |
552.512,00 |
435.766,00 |
441.866,00 |
355.130,00 |
|
|
III. Debtors: |
730.739,00 |
809.868,00 |
805.825,00 |
803.193,00 |
957.444,00 |
|
|
IV. Short-term investments: |
205.169,00 |
246.171,00 |
259.133,00 |
420.376,00 |
440.905,00 |
|
|
V. Short-term treasury shares: |
0,00 |
0,00 |
0,00 |
0,00 |
0,00 |
|
|
VI. Cash at bank and in hand: |
16.442,00 |
22.100,00 |
47.353,00 |
113.249,00 |
93.002,00 |
|
|
VII. Prepayments and accrued income: |
0,00 |
0,00 |
0,00 |
0,00 |
0,00 |
|
|
GENERAL
TOTAL (A + B + C + D): |
2.398.259,00 |
2.442.283,00 |
2.300.658,00 |
2.380.752,00 |
2.405.490,00 |
|
MERCANTILE
REGISTRY.
|
|
EQUIVALENCIA |
EQUIVALENCIA |
EQUIVALENCIA |
EQUIVALENCIA |
EQUIVALENCIA |
|
|
LIABILITIES |
2012 |
2011 |
2010 |
2009 |
2008 |
|
|
A)
EQUITY: |
1.220.446,00 |
1.218.857,00 |
1.212.781,00 |
1.191.125,00 |
1.146.254,00 |
|
|
I. Subscribed capital: |
9.018,00 |
9.018,00 |
9.018,00 |
3.005,00 |
3.005,00 |
|
|
II. Share premium: |
0,00 |
0,00 |
0,00 |
0,00 |
0,00 |
|
|
III. Revaluation reserves: |
0,00 |
0,00 |
0,00 |
0,00 |
0,00 |
|
|
IV. Reserves: |
1.209.839,00 |
1.203.763,00 |
1.188.119,00 |
1.143.249,00 |
1.090.502,00 |
|
|
a) Differences for capital adjustment to
euros: |
0,00 |
0,00 |
0,00 |
0,00 |
0,00 |
|
|
b) Remaining Reserves: |
1.209.839,00 |
1.203.763,00 |
1.188.119,00 |
1.143.249,00 |
1.090.502,00 |
|
|
V. Profit or loss brought forward: |
0,00 |
0,00 |
0,00 |
0,00 |
0,00 |
|
|
VI. Profit or loss for the financial year: |
1.588,00 |
6.076,00 |
15.643,00 |
44.871,00 |
52.747,00 |
|
|
VII. Interim dividend paid: |
0,00 |
0,00 |
0,00 |
0,00 |
0,00 |
|
|
VIII. Own shares for capital reduction: |
0,00 |
0,00 |
0,00 |
0,00 |
0,00 |
|
|
B)
Deferred income: |
0,00 |
0,00 |
0,00 |
0,00 |
0,00 |
|
|
C)
PROVISIONS FOR LIABILITIES AND CHARGES: |
0,00 |
0,00 |
0,00 |
0,00 |
0,00 |
|
|
D)
LONG TERM LIABILITIES: |
141.128,00 |
104.294,00 |
226.945,00 |
289.366,00 |
321.368,00 |
|
|
E)
SHORT TERM CREDITORS: |
1.036.685,00 |
1.119.132,00 |
860.932,00 |
900.261,00 |
937.869,00 |
|
|
F)
SHORT-TERM PROVISIONS FOR LIABILITIES AND CHARGES: |
0,00 |
0,00 |
0,00 |
0,00 |
0,00 |
|
|
GENERAL
TOTAL (A + B + C + D + E + F): |
2.398.259,00 |
2.442.283,00 |
2.300.658,00 |
2.380.752,00 |
2.405.490,00 |
|
MERCANTILE
REGISTRY.
|
|
EQUIVALENCIA |
EQUIVALENCIA |
EQUIVALENCIA |
EQUIVALENCIA |
EQUIVALENCIA |
|
|
DEBIT |
2012 |
2011 |
2010 |
2009 |
2008 |
|
|
A)
CHARGES (A.1 to A.15): |
1.679.925,00 |
1.438.534,00 |
1.581.621,00 |
1.502.961,00 |
1.838.177,00 |
|
|
A.1. Operating consumption: |
823.401,00 |
593.410,00 |
724.929,00 |
557.279,00 |
692.554,00 |
|
|
A.2. Staff Costs: |
498.216,00 |
486.282,00 |
481.854,00 |
502.936,00 |
644.411,00 |
|
|
a) Wages, salaries et
al.: |
396.904,00 |
387.397,00 |
383.869,00 |
400.665,00 |
513.370,00 |
|
|
b) Social security
costs: |
101.312,00 |
98.885,00 |
97.985,00 |
102.272,00 |
131.041,00 |
|
|
A.3. Depreciation expense: |
13.665,00 |
13.665,00 |
13.665,00 |
18.794,00 |
34.958,00 |
|
|
A.4. Variation of trade provisions and
losses of unrecovered receivables: |
0,00 |
0,00 |
0,00 |
0,00 |
0,00 |
|
|
A.5. Other operating charges: |
305.699,00 |
316.804,00 |
336.180,00 |
375.224,00 |
381.974,00 |
|
|
A.I. OPERATING BENEFITS (B.1-A.1-A.2-A.3-A.4-A.5): |
39.584,00 |
33.612,00 |
34.432,00 |
93.573,00 |
137.005,00 |
|
|
A.6. Financial and similar charges: |
38.318,00 |
26.347,00 |
19.543,00 |
20.371,00 |
56.761,00 |
|
|
a) Due to liabilities
with companies of the group: |
36.685,00 |
25.225,00 |
18.710,00 |
19.504,00 |
54.343,00 |
|
|
b) Due to liabilities
with associated companies: |
0,00 |
0,00 |
0,00 |
0,00 |
0,00 |
|
|
c) Due to other
debts: |
1.632,00 |
1.122,00 |
833,00 |
868,00 |
2.418,00 |
|
|
d) Losses from
financial investments: |
0,00 |
0,00 |
0,00 |
0,00 |
0,00 |
|
|
A.7. Financial investment provision
change: |
0,00 |
0,00 |
0,00 |
0,00 |
0,00 |
|
|
A.8. Exchange losses: |
24,00 |
0,00 |
0,00 |
2,00 |
3.985,00 |
|
|
A.II. POSITIVE FINANCIAL RESULTS (B.2+B.3-A.6-A.7-A.8): |
0,00 |
0,00 |
0,00 |
0,00 |
0,00 |
|
|
A.III. PROFIT FROM ORDINARY ACTIVITIES (A.I+A.II-B.I-B.II):
|
1.242,00 |
7.265,00 |
14.895,00 |
73.225,00 |
76.281,00 |
|
|
A.9. Changes in provisions for intangible,
tangible and securities portfolio: |
0,00 |
0,00 |
0,00 |
0,00 |
0,00 |
|
|
A.10. Losses from tangible and intangible
fixed assets and portfolio: |
0,00 |
0,00 |
0,00 |
12.727,00 |
5.517,00 |
|
|
A.11. Losses from transactions with own
shares and debentures: |
0,00 |
0,00 |
0,00 |
0,00 |
0,00 |
|
|
A.12. Extraordinary expenses: |
0,00 |
0,00 |
0,00 |
0,00 |
382,00 |
|
|
A.13. Prior year expenses and losses:
|
0,00 |
0,00 |
0,00 |
0,00 |
0,00 |
|
|
A.IV. EXTRAORDINARY PROFIT
(B.4+B.5+B.6+B.7+B.8-A.9-A.10-A.11-A.12-A.13): |
949,00 |
837,00 |
6.198,00 |
0,00 |
0,00 |
|
|
A.V. PROFIT BEFORE TAXES (A.III+A.IV-B.III-B.IV): |
2.191,00 |
8.102,00 |
21.094,00 |
60.498,00 |
70.382,00 |
|
|
A.14. Corporation Tax: |
603,00 |
2.025,00 |
5.450,00 |
15.627,00 |
17.635,00 |
|
|
A.15. Miscellaneous taxes: |
0,00 |
0,00 |
0,00 |
0,00 |
0,00 |
|
|
A.VI. FINANCIAL YEAR RESULT (PROFIT) (A.V-A.14-A.15): |
1.588,00 |
6.076,00 |
15.643,00 |
44.871,00 |
52.747,00 |
|
MERCANTILE
REGISTRY.
|
|
EQUIVALENCIA |
EQUIVALENCIA |
EQUIVALENCIA |
EQUIVALENCIA |
EQUIVALENCIA |
|
|
CREDIT |
2012 |
2011 |
2010 |
2009 |
2008 |
|
|
B)
INCOME ( B.1 to B.8): |
1.681.513,00 |
1.444.610,00 |
1.597.264,00 |
1.547.832,00 |
1.890.924,00 |
|
|
B.1. Operating income: |
1.680.564,00 |
1.443.773,00 |
1.591.059,00 |
1.547.807,00 |
1.890.901,00 |
|
|
a) Net total sales:
|
1.630.617,00 |
1.370.852,00 |
1.473.146,00 |
1.489.201,00 |
1.887.901,00 |
|
|
b) Miscellaneous
operating income: |
49.947,00 |
72.921,00 |
117.913,00 |
58.606,00 |
3.000,00 |
|
|
B.I. PÉRDIDAS DE EXPLOTACIÓN (A.1+A.2+A.3+A.4+A.5-B.1 ): |
0,00 |
0,00 |
0,00 |
0,00 |
0,00 |
|
|
B.2. Financial income: |
0,00 |
0,00 |
1,00 |
25,00 |
23,00 |
|
|
a) Companies of the
group: |
0,00 |
0,00 |
0,00 |
0,00 |
0,00 |
|
|
b) In associated
companies: |
0,00 |
0,00 |
0,00 |
0,00 |
0,00 |
|
|
c) Miscellaneous:
|
0,00 |
0,00 |
1,00 |
25,00 |
23,00 |
|
|
d) Profit on
financial investment: |
0,00 |
0,00 |
0,00 |
0,00 |
0,00 |
|
|
B.3. Exchange gains: |
0,00 |
0,00 |
6,00 |
0,00 |
0,00 |
|
|
B.II. NEGATIVE FINANCIAL RESULTS (A.6+A.7+A.8-B.2-B.3): |
38.341,00 |
26.347,00 |
19.537,00 |
20.348,00 |
60.723,00 |
|
|
B.III. LOSSES ON ORDINARY ACTIVITIES ( B.I + B.II - A.I - A.II
): |
0,00 |
0,00 |
0,00 |
0,00 |
0,00 |
|
|
B.4. Profit on disposal of both tangible
and intangible fixed assets and securities portfolio: |
0,00 |
0,00 |
0,00 |
0,00 |
0,00 |
|
|
B.5. Profit on transactions with own
shares and debentures: |
0,00 |
0,00 |
0,00 |
0,00 |
0,00 |
|
|
B.6. Capital grants transferred to profit
and loss: |
0,00 |
0,00 |
0,00 |
0,00 |
0,00 |
|
|
B.7. Extraordinary income: |
949,00 |
837,00 |
6.198,00 |
0,00 |
0,00 |
|
|
B.8. Income and profit of former financial
years: |
0,00 |
0,00 |
0,00 |
0,00 |
0,00 |
|
|
B.IV. NEGATIVE EXTRAORDINARY RESULTS
(A.9+A.10+A.11+A.12+A.13-B.4-B.5-B.6-B.7-B.8): |
0,00 |
0,00 |
0,00 |
12.727,00 |
5.899,00 |
|
|
B.V. LOSSES BEFORE TAXES (B.III+B.IV-A.III-A.IV): |
0,00 |
0,00 |
0,00 |
0,00 |
0,00 |
|
|
B.VI. FINANCIAL YEAR RESULTS (LOSSES) (B.V+A.14+A.15): |
0,00 |
0,00 |
0,00 |
0,00 |
0,00 |
|
MERCANTILE
REGISTRY.
|
CASHFLOW STATEMENT |
Model: Normal
>
Source of information: Data contained in this section is taken from the
information declared in the Annual Accounts submitted to the Trade Register.
|
|
2012 |
2011 |
2010 |
2009 |
2008 |
|
|
1.
Fiscal year result before taxes.: 61100 |
2.191,00 |
8.102,00 |
21.094,00 |
60.498,00 |
70.382,00 |
|
|
2.
Results adjustments.: 61200 |
51.982,00 |
40.011,00 |
33.207,00 |
39.140,00 |
91.697,00 |
|
|
a) Fixed Assets Amortization (+).: 61201 |
13.665,00 |
13.665,00 |
13.665,00 |
18.794,00 |
34.958,00 |
|
|
g) Financial income (-).: 61207 |
0,00 |
0,00 |
-1,00 |
-25,00 |
-23,00 |
|
|
h) Financial Expenses (+). : 61208 |
38.318,00 |
26.347,00 |
19.543,00 |
20.371,00 |
56.761,00 |
|
|
3.
Changes in current capital equity.: 61300 |
173.545,00 |
-91.077,00 |
167.524,00 |
84.694,00 |
54.129,00 |
|
|
a) Stock (+/-).: 61301 |
-30.156,00 |
-116.745,00 |
6.100,00 |
-86.737,00 |
-190.265,00 |
|
|
d) Debtors and other accounts receivable (+/-). : 61302 |
79.128,00 |
-4.042,00 |
-2.633,00 |
154.251,00 |
781.535,00 |
|
|
c) Other current assets (+/-). : 61303 |
41.002,00 |
12.962,00 |
161.243,00 |
20.529,00 |
-435.844,00 |
|
|
d) Creditors and other accounts payable (+/-). : 61304 |
83.571,00 |
16.748,00 |
2.814,00 |
-3.349,00 |
-101.297,00 |
|
|
4.
Other cash flows for operating activities.: 61400 |
-38.317,00 |
-26.347,00 |
-19.542,00 |
-20.346,00 |
-56.739,00 |
|
|
a) Interest payments (-). : 61401 |
-38.318,00 |
-26.347,00 |
-19.543,00 |
-20.371,00 |
-56.761,00 |
|
|
c) Interest collection (+). : 61403 |
0,00 |
0,00 |
1,00 |
25,00 |
23,00 |
|
|
5.
Operating activity cash flows (1 + 2 + 3 + 4) : 61500 |
189.401,00 |
-69.311,00 |
202.283,00 |
163.986,00 |
159.469,00 |
|
|
6.
Payments for investment (-).: 62100 |
-52.265,00 |
-59.053,00 |
-150.511,00 |
-44.254,00 |
-59.470,00 |
|
|
b) Intangible fixed assets. : 62102 |
0,00 |
-929,00 |
0,00 |
-1.398,00 |
0,00 |
|
|
c) Fixed assets. : 62103 |
-52.265,00 |
-58.048,00 |
-150.510,00 |
-42.855,00 |
-59.032,00 |
|
|
e) Other financial assets. : 62105 |
0,00 |
-76,00 |
-1,00 |
0,00 |
-437,00 |
|
|
7.
Divestment payment collection (+). : 62200 |
658,00 |
0,00 |
0,00 |
1.196,00 |
54.524,00 |
|
|
b) Intangible fixed assets. : 62202 |
0,00 |
0,00 |
0,00 |
0,00 |
54.524,00 |
|
|
e) Other financial assets. : 62205 |
658,00 |
0,00 |
0,00 |
1.196,00 |
0,00 |
|
|
8.
Investment activity cash flows (6 + 7) minus Amortization: 62300 |
-65.273,00 |
-72.718,00 |
-164.176,00 |
-61.852,00 |
-39.903,00 |
|
|
9.
Payment collection and payments for equity instruments. : 63100 |
0,00 |
0,00 |
6.012,00 |
0,00 |
3.124,00 |
|
|
a) Issuance of equity instruments (+). : 63101 |
0,00 |
0,00 |
6.012,00 |
0,00 |
3.124,00 |
|
|
10.
Payment collection and payments for financial liabilities instruments.:
63200 |
-129.787,00 |
116.776,00 |
-110.015,00 |
-81.887,00 |
-209.027,00 |
|
|
a) Issuance : 63201 |
36.850,00 |
239.426,00 |
88.661,00 |
30.880,00 |
0,00 |
|
|
2. Debts incurred with credit institutions (+). : 63203 |
36.834,00 |
239.426,00 |
0,00 |
30.880,00 |
0,00 |
|
|
5. Other debts (+). : 63206 |
16,00 |
0,00 |
88.661,00 |
0,00 |
0,00 |
|
|
b) Repayment and amortization of : 63207 |
-166.637,00 |
-122.650,00 |
-198.675,00 |
-112.767,00 |
-209.027,00 |
|
|
2. Debts incurred with credit institutions (-).: 63209 |
-166.637,00 |
-22.650,00 |
-198.675,00 |
-49.885,00 |
-187.597,00 |
|
|
5. Other debts (-). : 63212 |
0,00 |
-100.000,00 |
0,00 |
-62.882,00 |
-21.430,00 |
|
|
11.
Payments from dividends and remunerations from other assets instruments. :
63300 |
0,00 |
0,00 |
0,00 |
0,00 |
0,00 |
|
|
12.
Cash flows for financing activities (9+10+11).: 63400 |
-129.787,00 |
116.776,00 |
-104.003,00 |
-81.887,00 |
-205.903,00 |
|
|
D)
EFECTO DE LAS VARIACIONES DE LOS TIPOS DE CAMBIO: 64000 |
0,00 |
0,00 |
0,00 |
0,00 |
0,00 |
|
|
E)
NET INCREASE/DECREASE OF CASH OR EQUIVALENT ASSETS (+/-5+/-8+/12+/-D) :
65000 |
-5.658,00 |
-25.253,00 |
-65.896,00 |
20.247,00 |
-86.337,00 |
|
|
Cash or equivalent assets as of beginning of the fiscal year.:
65100 |
22.100,00 |
47.353,00 |
113.249,00 |
93.002,00 |
179.339,00 |
|
|
Cash or equivalent assets as of end of the fiscal year.:
65200 |
16.442,00 |
22.100,00 |
47.353,00 |
113.249,00 |
93.002,00 |
|
|
FINANCIAL DIAGNOSIS |
> Economic-Financial Comparative Analysis
Data used in the following ratios and indicators is taken from the
Annual Accounts submitted by the company to the TRADE REGISTER.
>
Comparison within the Sector
|
Cash
Flow |
2012 |
2011 |
Variación
2012 - 2011 |
|
|||
|
|
Empresa |
Sector |
Empresa |
Sector |
Empresa |
Sector |
|
|
Cash
Flow over Sales: |
0,00
% |
0,00
% |
-0,02
% |
0,01
% |
81,16
% |
-104,06
% |
|
|
EBITDA
over Sales: |
3,27
% |
2,62
% |
3,45
% |
4,34
% |
-5,31
% |
-39,55
% |
|
|
Cash
Flow Yield: |
0,00
% |
0,00
% |
-0,01
% |
0,01
% |
77,19
% |
-103,76
% |
|
|
Profitability |
2012 |
2011 |
Variación
2012 - 2011 |
|
|||
|
|
Empresa |
Sector |
Empresa |
Sector |
Empresa |
Sector |
|
|
Operating
economic profitability: |
2,10
% |
0,95
% |
1,78
% |
1,44
% |
17,91
% |
-34,08
% |
|
|
Total
economic profitability: |
1,69
% |
1,35
% |
1,41
% |
1,81
% |
19,75
% |
-25,45
% |
|
|
Financial
profitability: |
0,13
% |
-0,34
% |
0,50
% |
0,39
% |
-73,89
% |
-187,53
% |
|
|
Margin:
|
2,36
% |
1,06
% |
2,33
% |
1,57
% |
1,17
% |
-32,35
% |
|
|
Mark-up:
|
0,07
% |
-0,22
% |
0,50
% |
0,27
% |
-85,31
% |
-182,85
% |
|
|
Solvency |
2012 |
2011 |
Variación
2012 - 2011 |
|
|||
|
|
Empresa |
Sector |
Empresa |
Sector |
Empresa |
Sector |
|
|
Liquidity:
|
0,02 |
0,23 |
0,02 |
0,22 |
-19,69 |
8,31 |
|
|
Acid
Test: |
0,92 |
1,07 |
0,96 |
1,02 |
-4,64 |
5,42 |
|
|
Working
Capital / Investment: |
0,21 |
0,21 |
0,21 |
0,23 |
-0,79 |
-5,33 |
|
|
Solvency:
|
1,48 |
1,79 |
1,46 |
1,76 |
1,62 |
1,99 |
|
|
Indebtedness |
2012 |
2011 |
Variación
2012 - 2011 |
|
|||
|
|
Empresa |
Sector |
Empresa |
Sector |
Empresa |
Sector |
|
|
Indebtedness
level: |
0,97 |
1,08 |
1,00 |
1,36 |
-3,85 |
-20,70 |
|
|
Borrowing
Composition: |
0,14 |
0,80 |
0,09 |
0,83 |
46,08 |
-3,33 |
|
|
Repayment
Ability: |
-208,16 |
-1.451,83 |
-48,45 |
60,69 |
-329,65 |
-2.492,18 |
|
|
Warranty:
|
2,04 |
1,93 |
2,00 |
1,74 |
2,00 |
11,02 |
|
|
Generated
resources / Total creditors: |
0,01 |
0,04 |
0,02 |
0,05 |
-19,74 |
-5,81 |
|
|
Efficiency |
2012 |
2011 |
Variación
2012 - 2011 |
|
|||
|
|
Empresa |
Sector |
Empresa |
Sector |
Empresa |
Sector |
|
|
Productivity:
|
1,11 |
1,11 |
1,10 |
1,19 |
0,88 |
-7,34 |
|
|
Turnover
of Collection Rights : |
2,30 |
4,25 |
1,78 |
4,13 |
29,01 |
2,81 |
|
|
Turnover
of Payment Entitlements: |
2,19 |
2,76 |
2,11 |
2,75 |
3,81 |
0,36 |
|
|
Stock
rotation: |
2,82 |
3,66 |
2,55 |
3,39 |
10,35 |
8,05 |
|
|
Assets
turnover: |
0,89 |
0,90 |
0,77 |
0,92 |
16,55 |
-2,56 |
|
|
Borrowing
Cost: |
3,25 |
2,43 |
2,15 |
2,40 |
51,07 |
1,14 |
|
>
Trend of indicators under the General Accounting Plan of 2007 (2012, 2011,
2010, 2009, 2008)
|
Cash
Flow |
2012 |
2011 |
2010 |
2009 |
2008 |
|
|
Cash
Flow over Sales: |
0,00
% |
-0,02
% |
-0,04
% |
0,01
% |
-4,57
% |
|
|
EBITDA
over Sales: |
3,27
% |
3,45
% |
3,26
% |
7,55
% |
9,11
% |
|
|
Cash
Flow Yield: |
0,00
% |
-0,01
% |
-0,03
% |
0,01
% |
-3,59
% |
|
|
Profitability |
2012 |
2011 |
2010 |
2009 |
2008 |
|
|
Operating
economic profitability: |
2,10
% |
1,78
% |
1,99
% |
4,90
% |
7,95
% |
|
|
Total
economic profitability: |
1,69
% |
1,41
% |
1,77
% |
3,40
% |
5,29
% |
|
|
Financial
profitability: |
0,13
% |
0,50
% |
1,29
% |
3,77
% |
4,60
% |
|
|
Margin:
|
2,36
% |
2,33
% |
2,16
% |
5,22
% |
6,95
% |
|
|
Mark-up:
|
0,07
% |
0,50
% |
0,94
% |
3,91
% |
3,74
% |
|
|
Solvency |
2012 |
2011 |
2010 |
2009 |
2008 |
|
|
Liquidity:
|
0,02 |
0,02 |
0,06 |
0,13 |
0,10 |
|
|
Acid
Test: |
0,92 |
0,96 |
1,29 |
1,48 |
1,59 |
|
|
Working
Capital / Investment: |
0,21 |
0,21 |
0,30 |
0,37 |
0,38 |
|
|
Solvency:
|
1,48 |
1,46 |
1,80 |
1,98 |
1,97 |
|
|
Indebtedness |
2012 |
2011 |
2010 |
2009 |
2008 |
|
|
Indebtedness
level: |
0,97 |
1,00 |
0,90 |
1,00 |
1,10 |
|
|
Borrowing
Composition: |
0,14 |
0,09 |
0,26 |
0,32 |
0,34 |
|
|
Repayment
Ability: |
-208,16 |
-48,45 |
-16,51 |
58,76 |
7,77 |
|
|
Warranty:
|
2,04 |
2,00 |
2,11 |
2,00 |
1,91 |
|
|
Generated
resources / Total creditors: |
0,01 |
0,02 |
0,03 |
0,05 |
0,07 |
|
|
Efficiency |
2012 |
2011 |
2010 |
2009 |
2008 |
|
|
Productivity:
|
1,11 |
1,10 |
1,10 |
1,22 |
1,27 |
|
|
Turnover
of Collection Rights : |
2,30 |
1,78 |
1,97 |
1,93 |
1,97 |
|
|
Turnover
of Payment Entitlements: |
2,19 |
2,11 |
2,57 |
2,30 |
2,74 |
|
|
Stock
rotation: |
2,82 |
2,55 |
3,57 |
3,29 |
4,94 |
|
|
Assets
turnover: |
0,89 |
0,77 |
0,92 |
0,94 |
1,14 |
|
|
Borrowing
Cost: |
3,25 |
2,15 |
1,80 |
1,71 |
4,51 |
|
COMPARATIVE SECTORIAL BALANCE
Sector-based
Comparison under the rules of the New General Accounting Plan.
|
|
Variación
- |
|
|
|
Empresa |
Sector |
|
|
Variación
- |
|
|
|
Empresa |
Sector |
|
|
Variación
- |
|
|
|
Empresa |
Sector |
Public Tenders and Works Won
No Public Tenders assigned to the name of the company.
|
Research Summary |
|
Business started in 1876 by José Sanz Feliu with the name of TALLERES SANZ SA. The subject was founded in 1999 and it is the fifth generation in Sanz family who is running the company. The subject is engaged in manufacturing of strongboxes, pneumatic transport and strongrooms (values and documentation). The subject has 15 employees. According to the above, we consider that the subject can stay involved in normal credit operations. |
|
Sources |
|
Registry
of Commerce's Official Gazette. Own and external data bases Company
References |
FOREIGN EXCHANGE RATES
|
Currency |
Unit
|
Indian Rupees |
|
US Dollar |
1 |
Rs.61.35 |
|
UK Pound |
1 |
Rs.100.21 |
|
Euro |
1 |
Rs.83.52 |
INFORMATION DETAILS
|
Report Prepared
by : |
MNL |
RATING EXPLANATIONS
|
RATING |
STATUS |
PROPOSED CREDIT LINE |
|
|
>86 |
Aaa |
Possesses an extremely sound financial base with the strongest
capability for timely payment of interest and principal sums |
Unlimited |
|
71-85 |
Aa |
Possesses adequate working capital. No caution needed for credit
transaction. It has above average (strong) capability for payment of interest
and principal sums |
Large |
|
56-70 |
A |
Financial & operational base are regarded healthy. General
unfavourable factors will not cause fatal effect. Satisfactory capability for
payment of interest and principal sums |
Fairly Large |
|
41-55 |
Ba |
Overall operation is considered normal. Capable to meet normal
commitments. |
Satisfactory |
|
26-40 |
B |
Capability to overcome financial difficulties seems comparatively
below average. |
Small |
|
11-25 |
Ca |
Adverse factors
are apparent. Repayment of interest and principal sums in default or expected
to be in default upon maturity |
Limited with full security |
|
<10 |
C |
Absolute credit risk exists. Caution needed to be exercised |
Credit not
recommended |
|
-- |
NB |
New Business |
-- |
This score serves as a reference to assess SC’s credit risk
and to set the amount of credit to be extended. It is calculated from a
composite of weighted scores obtained from each of the major sections of this
report. The assessed factors and their relative weights (as indicated through
%) are as follows:
Financial
condition (40%) Ownership
background (20%) Payment
record (10%)
Credit history
(10%) Market trend
(10%) Operational
size (10%)
This report is issued at your request without any
risk and responsibility on the part of MIRA INFORM PRIVATE LIMITED (MIPL)
or its officials.