. MIRA INFORM REPORT
|
Report Date : |
24.01.2014 |
IDENTIFICATION DETAILS
|
Name : |
ELECTRONICS FOR IMAGING B.V. |
|
|
|
|
Registered Office : |
Boeingavenue 201207, 1119PD Schiphol-Rijk |
|
|
|
|
Country : |
Netherlands |
|
|
|
|
Financials (as on) : |
31.12.2011 |
|
|
|
|
Date of Incorporation : |
01.06.1993 |
|
|
|
|
Com. Reg. No.: |
30144359 |
|
|
|
|
Legal Form : |
Private Company |
|
|
|
|
Line of Business : |
Subject helps businesses and enterprises work more productively and cost-effectively with an integrated product portfolio consisting of industrial inkjet printers and inks, powerful digital front ends, precise color management tools, eCommerce, web-to-print and productivity software for business automation, and mobile and cloud printing products |
|
|
|
|
No. of Employees : |
40 (2012) |
RATING & COMMENTS
|
MIRA’s Rating : |
Ba |
|
RATING |
STATUS |
PROPOSED CREDIT LINE |
|
|
41-55 |
Ba |
Overall operation is considered normal. Capable to meet normal
commitments. |
Satisfactory |
|
Status : |
Satisfactory |
|
|
|
|
Payment Behaviour : |
No Complaints |
|
|
|
|
Litigation : |
Clear |
NOTES :
Any query related to this report can be made
on e-mail : infodept@mirainform.com
while quoting report number, name and date.
ECGC Country Risk Classification List – September 30, 2013
|
Country Name |
Previous Rating (30.06.2013) |
Current Rating (30.09.2013) |
|
Netherlands |
A1 |
A1 |
|
Risk Category |
ECGC
Classification |
|
Insignificant |
A1 |
|
Low |
A2 |
|
Moderate |
B1 |
|
High |
B2 |
|
Very High |
C1 |
|
Restricted |
C2 |
|
Off-credit |
D |
Netherlands ECONOMIC OVERVIEW
The Dutch economy is the
sixth-largest economy in the euro-zone and is noted for its stable industrial
relations, moderate unemployment and inflation, a sizable trade surplus, and an
important role as a European transportation hub. Industrial activity is
predominantly in food processing, chemicals, petroleum refining, and electrical
machinery. A highly mechanized agricultural sector employs only 2% of the labor
force but provides large surpluses for the food-processing industry and for
exports. The Netherlands, along with 11 of its EU partners, began circulating
the euro currency on 1 January 2002. After 26 years of uninterrupted economic
growth, the Dutch economy - highly dependent on an international financial
sector and international trade - contracted by 3.5% in 2009 as a result of the
global financial crisis. The Dutch financial sector suffered, due in part to
the high exposure of some Dutch banks to U.S. mortgage-backed securities. In
2008, the government nationalized two banks and injected billions of dollars of
capital into other financial institutions, to prevent further deterioration of
a crucial sector. The government also sought to boost the domestic economy by
accelerating infrastructure programs, offering corporate tax breaks for
employers to retain workers, and expanding export credit facilities. The
stimulus programs and bank bailouts, however, resulted in a government budget
deficit of 5.3% of GDP in 2010 that contrasted sharply with a surplus of 0.7%
in 2008. The government of Prime Minister Mark RUTTE began implementing fiscal
consolidation measures in early 2011, mainly reductions in expenditures, which
resulted in an improved budget deficit in 2011. In 2012 tax revenues dropped
nearly 9%, GDP contracted, and the budget deficit deteriorated. Although
jobless claims continued to grow, the unemployment rate remained relatively low
at 6.8 percent.
Source : CIA
Company summary
Company name Electronics for Imaging B.V.
Operative address Boeingavenue
201207
1119PD Schiphol-Rijk
Netherlands
Status Active
Specification This
company can meet all its obligations.
Legal form Besloten
Vennootschap (Private Company)
Registration number KvK-nummer:
30144359
VAT-number
802490566
|
Year |
2011 |
Mutation |
2010 |
Mutation |
2009 |
|
Fixed assets |
44.826 |
-47,43 |
85.272 |
-57,05 |
198.528 |
|
Total receivables |
30.394.157 |
-10,66 |
34.019.039 |
23,74 |
27.491.316 |
|
Total equity |
16.310.379 |
16,59 |
13.989.843 |
20,40 |
11.619.461 |
|
Short term liabilities |
44.908.416 |
-8,48 |
49.068.050 |
-5,14 |
51.724.962 |
|
Net result |
1.855.630 |
26,31 |
1.469.072 |
61,92 |
907.261 |
|
Working capital |
21.694.103 |
18,56 |
18.297.575 |
60,21 |
11.420.932 |
|
Quick ratio |
1,07 |
5,94 |
1,01 |
10,99 |
0,91 |
Contact information
Company name Electronics
for Imaging B.V.
Trade names Electronics
for Imaging B.V.
Operative address Boeingavenue
201207
1119PD Schiphol-Rijk
Netherlands
Correspondence address Postbus 75791
1118ZX Luchthaven Schiphol
Netherlands
Telephone number 020
6588000
Fax number 020
6588001
Email address info@efi.com
Website
www.efi.com
Registration
Registration number KvK-nummer:
30144359
Registered in Kamer
van Koophandel Amsterdam
Branch number 000018898246
VAT-number 802490566
Status Active
First registration
company register 1994-12-16
Memorandum 1994-11-03
Establishment date 1993-06-01
Legal form Besloten
Vennootschap (Private Company)
Last
proposed
admendment
2006-11-17
Activities
Subject helps
businesses and enterprises work more productively and cost-effectively with an
integrated product portfolio consisting of industrial inkjet printers and inks,
powerful digital front ends, precise color management tools, eCommerce,
web-to-print and productivity software for business automation, and mobile and
cloud printing products
Exporter No
Importer No
Branche organisations
Ondernemersvereniging Regio Amsterdam
(Undertakings Region Amsterdam)
Goal
Het verlenen van verkoop-ondersteunende diensten met betrekking
tot de handel in computers.
(The provision of sales
support services related to trading computers.)
Relations
Shareholders Name:
Electronics for Imaging (Luxembourg) S.à.r.l.
Office address: 2 Rue Joseph
Hackin, L1746 Luxembourg, Luxembourg
Registered in: Registre de
Commerce et des sociétés Luxembourg, Luxembourg with
registration number B 111773
Only
shareholder since: 09-06-2006
Management
Active management
V.J.C. Pilette (Vincent Jean Claude)
Netherlands
Competence: Fully authorized
Function: Manager
Starting date: 2011-12-06
Date of birth: 1971-12-01, Etterbeek, BE
B.S. Ko (Bryan Seuk)
Netherlands
Competence: Fully authorized
Function: Manager
Starting date: 2011-12-06
Date of birth: 1971-02-26, Rochester, NL
M.J. den Hartog - de Reus (Marjolijn Jannette)
Netherlands
Competence: Limited authorization
Function: Proxy
Starting date: 2000-04-21
Date of birth: 1957-11-27, Dordrecht, NL
J.C. Wessel (Johannes Cornelis)
Netherlands
Competence: Limited authorization
Function: Proxy
Starting date: 2008-02-14
Date of birth: 1965-01-22, Wassenaar, NL
Employees
Year 2012
2011 2010 2009 2008
Total 40 40 40 40
40
PAYMENTS
Description The
payments are slightly delayed
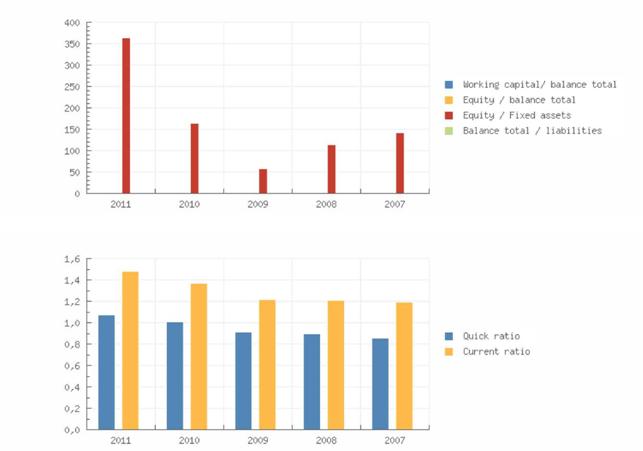
Key figures
|
Year
|
2011 |
2010 |
2009 |
2008 |
2007 |
|
|
Quick ratio |
1,07 |
1,01 |
0,91 |
0,90 |
0,86 |
|
|
Current ratio |
1,48 |
1,37 |
1,22 |
1,21 |
1,19 |
|
|
Working capital/ balance total |
0,33 |
0,27 |
0,18 |
0,17 |
0,16 |
|
|
Equity / balance total |
0,24 |
0,21 |
0,18 |
0,18 |
0,16 |
|
|
Equity / Fixed assets |
363,86 |
164,06 |
58,53 |
114,31 |
142,70 |
|
|
Equity / liabilities |
0,32 |
0,26 |
0,22 |
0,21 |
0,19 |
|
|
Balance total / liabilities |
1,32 |
1,26 |
1,22 |
1,21 |
1,19 |
|
|
Working capital |
21.694.103 |
18.297.575 |
11.420.932 |
10.991.599 |
9.433.467 |
|
|
Equity |
16.310.379 |
13.989.843 |
11.619.461 |
11.088.602 |
9.500.038 |
|
|
Mutation equity |
16,59 |
20,40 |
4,79 |
16,72 |
7,95 |
|
|
Mutation short term liabilities |
-8,48 |
-5,14 |
-0,70 |
2,40 |
66,12 |
|
|
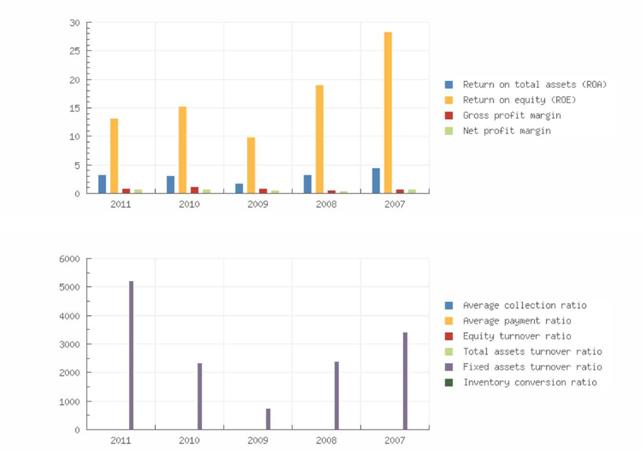
Return on total assets (ROA) |
3,25 |
3,16 |
1,82 |
3,35 |
4,45 |
|
|
Return on equity (ROE) |
13,26 |
15,24 |
9,92 |
19,07 |
28,29 |
|
|
Gross profit margin |
0,97 |
1,15 |
0,83 |
0,56 |
0,82 |
|
|
Net profit margin |
0,79 |
0,73 |
0,60 |
0,45 |
0,72 |
|
|
Average collection ratio |
5,22 |
4,09 |
2,92 |
4,45 |
4,49 |
|
|
Average payment ratio |
7,71 |
5,89 |
5,49 |
7,40 |
7,82 |
|
|
Equity turnover ratio |
14,36 |
14,33 |
12,99 |
20,92 |
24,03 |
|
|
Total assets turnover ratio |
3,51 |
2,97 |
2,38 |
3,67 |
3,78 |
|
|
Fixed assets turnover ratio |
5.225,48 |
2.351,38 |
760,21 |
2.391,30 |
3.428,70 |
|
|
Inventory conversion ratio |
12,61 |
11,13 |
9,25 |
14,43 |
13,76 |
|
|
Turnover |
234.237.574 |
200.506.628 |
150.923.185 |
231.965.337 |
228.255.661 |
|
|
Gross margin |
34.348.867 |
29.569.935 |
26.938.074 |
37.266.671 |
31.239.740 |
|
|
Operating result |
2.273.746 |
2.300.848 |
1.252.256 |
1.289.072 |
1.883.025 |
|
|
Net result after taxes |
1.855.630 |
1.469.072 |
907.261 |
1.039.736 |
1.634.401 |
|
|
Cashflow |
1.905.866 |
1.598.476 |
1.037.762 |
1.112.309 |
1.680.593 |
|
|
Gross profit |
234.237.574 |
200.506.628 |
150.923.185 |
231.965.337 |
228.255.661 |
|
|
EBIT |
2.273.746 |
2.300.848 |
1.252.256 |
1.289.072 |
1.883.025 |
|
|
EBITDA |
2.323.982 |
2.430.252 |
1.382.757 |
1.361.645 |
1.929.218 |
|
Summary
The 2011 financial result structure is a positive working
capital of 21.694.103 euro, which is in
agreement with 33 % of the total assets of the company.
The working capital has increased with 18.56 % compared to
previous year. The ratio, with
respect to the total assets of the company has however,
increased.
The improvement between 2010 and 2011 has mainly been
caused by an increase of the
current assets.
The current ratio of the company in 2011 was 1.48. When
the current ratio is below 1.5, the
company may have problems meeting its short-term
obligations.
The quick ratio in 2011 of the company was 1.07. A company
with a Quick Ratio of more than
1 can currently pay back its current liabilities.
The 2010 financial result structure is a positive working capital
of 18.297.575 euro, which is in
agreement with 27 % of the total assets of the company.
The working capital has increased with 60.21 % compared to
previous year. The ratio, with
respect to the total assets of the company has however,
increased.
The improvement between 2009 and 2010 has mainly been
caused by an increase of the
current assets.
The current ratio of the company in 2010 was 1.37. When
the current ratio is below 1.5, the
company may have problems meeting its short-term
obligations.
The quick ratio in 2010 of the company was 1.01. A company
with a Quick Ratio of more than
1 can currently pay back its
current liabilities.
Financial statement
Type of annual account Corporate
Annual account Electronics
for Imaging B.V.
Boeingavenue 201207
1119PD Schiphol-Rijk
Netherlands
Registration
number: 301443590000
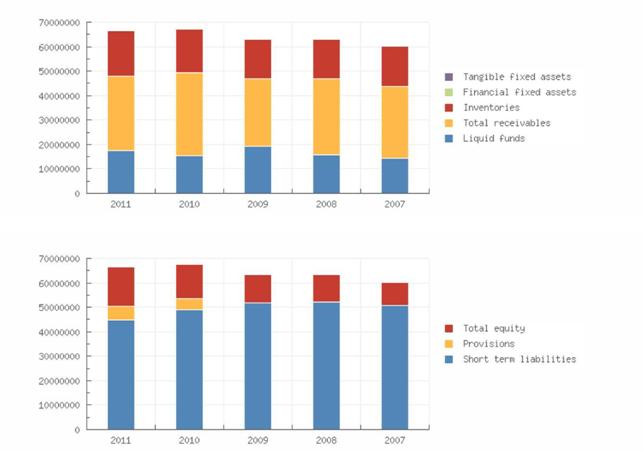
Balance Sheet
|
Year |
2011 |
2010 |
2009 |
2008 |
2007 |
|
End date |
2011-12-31 |
2010-12-31 |
2009-12-31 |
2008-12-31 |
2007-12-31 |
|
Tangible fixed assets |
44.053 |
84.524 |
197.834 |
96.285 |
66.572 |
|
Financial fixed assets |
773 |
748 |
694 |
719 |
|
|
Fixed assets |
44.826 |
85.272 |
198.528 |
97.004 |
66.572 |
|
Inventories |
18.581.807 |
18.017.075 |
16.320.279 |
16.080.341 |
16.585.838 |
|
Total receivables |
30.394.157 |
34.019.039 |
27.491.316 |
31.340.103 |
29.199.796 |
|
Liquid funds |
17.626.555 |
15.329.511 |
19.334.300 |
15.659.273 |
14.517.363 |
|
Current assets |
66.602.519 |
67.365.625 |
63.145.894 |
63.079.718 |
60.302.997 |
|
Total assets |
66.647.345 |
67.450.897 |
63.344.422 |
63.176.722 |
60.369.569 |
|
Total equity |
16.310.379 |
13.989.843 |
11.619.461 |
11.088.602 |
9.500.038 |
|
Provisions |
5.428.549 |
4.393.004 |
|
|
|
|
Short term liabilities |
44.908.416 |
49.068.050 |
51.724.962 |
52.088.119 |
50.869.530 |
|
Total short and long term liabilities |
50.336.965 |
53.461.054 |
51.724.962 |
52.088.119 |
50.869.530 |
|
Total liabilities |
66.647.345 |
67.450.897 |
63.344.422 |
63.176.722 |
60.369.569 |
Summary
The total assets of the company decreased with -1.19 %
between 2010 and 2011.
This downturn is mainly retrievable in the fixed asset
decrease of -47.43 %.
The asset reduction is in contrast with the equity growth
of 16.59 %. Due to this the total debt
decreased with -5.84 %.
In 2011 the assets of the company were 0.07 % composed of
fixed assets and 99.93 % by
current assets. The assets are being financed by an equity
of 24.47 %, and total debt of
75.53 %.
The total assets of the company increased with 6.48 %
between 2009 and 2010.
Despite the assets growth, the non current assets
decreased with -57.05 %.
The asset growth has mainly been financed by a Net Worth
increase of 20.4 %. Debt,
however, grew with 3.36 %.
In 2010 the assets of the company were 0.13 % composed of
fixed assets and 99.87 % by
current assets. The assets are being financed by an equity
of 20.74 %, and total debt of
79.26 %.
Profit & loss
|
Year |
2011 |
2010 |
2009 |
2008 |
2007 |
|||||
|
Revenues |
235.992.733 |
201.489.500 |
151.714.522 |
233.510.211 |
229.627.172 |
|||||
|
Other operating income |
1.755.159 |
982.872 |
791.337 |
1.544.874 |
1.371.511 |
|||||
|
Year |
2011 |
2010 |
2009 |
2008 |
2007 |
|||||
|
Net turnover |
234.237.574 |
200.506.628 |
150.923.185 |
231.965.337 |
228.255.661 |
|||||
|
Gross margin |
34.348.867 |
29.569.935 |
26.938.074 |
37.266.671 |
31.239.740 |
|
||||
|
Wages and salaries |
4.863.591 |
3.615.084 |
3.343.051 |
3.859.311 |
3.398.548 |
|
||||
|
Amorization and depreciation |
50.236 |
129.404 |
130.501 |
72.573 |
46.193 |
|
||||
|
Sales |
199.888.707 |
170.936.694 |
123.985.111 |
194.698.666 |
197.015.921 |
|
||||
|
other operating costs |
28.916.454 |
24.507.471 |
23.003.603 |
33.590.589 |
27.283.485 |
|
||||
|
Operating expenses |
233.718.987 |
199.188.652 |
150.462.266 |
232.221.139 |
227.744.147 |
|
||||
|
Operating result |
2.273.746 |
2.300.848 |
1.252.256 |
1.289.072 |
1.883.025 |
|
||||
|
Financial income |
13.139 |
|
43.732 |
825.609 |
804.294 |
|
||||
|
Financial expenses |
123.657 |
168.300 |
142.996 |
|
|
|
||||
|
Financial result |
-110.519 |
-168.300 |
-99.264 |
825.609 |
804.294 |
|
||||
|
Result on ordinary operations before taxes |
2.163.227 |
2.132.548 |
1.152.991 |
2.114.681 |
2.687.319 |
|
||||
|
Taxation on the result of ordinary activities |
307.597 |
663.476 |
245.731 |
1.074.945 |
1.052.918 |
|
||||
|
Result of ordinary activities after taxes |
1.855.630 |
1.469.072 |
907.261 |
1.039.736 |
1.634.401 |
|
||||
|
Net result |
1.855.630 |
1.469.072 |
907.261 |
1.039.736 |
1.634.401 |
|
||||
Summary
The turnover of the company grew with 16.82 % between 2010
and 2011.
The gross profit of the company grew with 16.16 % between 2010
and 2011.
The operating result of the company declined with -1.18 %
between 2010 and 2011. This
evolution implies an decrease of the company's economic
profitability.
The result of these changes is an increase of the
company's Economic Profitability of 2.85 %
of the analysed period, being equal to 2010 % in the year
2011.
This growth has contributed to the increase in assets
turnover, increasing by 18.18 %
reaching 3.51.
The Net Result of the company decreased by 26.31 % between
2010 and 2011.
The company's Financial Profitability has been negatively
affected by the financial activities in
comparison to the EBITs behaviour. The result of these
variations is a profitability reduction
of -12.99 % of the analysed period, being 13.26 % in the
year 2011.
The company's financial profitability has been positively
affected by its financial structure.
The turnover of the company grew with 32.85 % between 2009
and 2010.
The gross profit of the company grew with 9.77 % between
2009 and 2010.
The operating result of the company grew with 83.74 %
between 2009 and 2010. This
evolution implies an increase of the company's economic
profitability.
The result of these changes is an increase of the
company's Economic Profitability of 73.63
% of the analysed period, being equal to 2009 % in the
year 2010.
This growth has contributed to the increase in assets
turnover, increasing by 24.79 %
reaching 2.97.
The Net Result of the company decreased by 61.92 % between
2009 and 2010.
The company's Financial Profitability has been positively
affected by the financial activities in
comparison to the EBITs behaviour. The result of these
variations is a profitability increase of
53.63 % of the analysed period, being 15.24 % in the year
2010.
The company's financial structure has slowed down its
financial profitability.
analysis
Branch (SBI)
Support activities in the field of information technology (62)
Region Groot
Amsterdam
In the Netherlands 57167 of
the companies are registered with the SBI code 62
In the region Groot Amsterdam
7092 of the companies are registered with the SBI code 62
In the Netherlands 379 of the
bankrupcties are published within this sector
In the region Groot Amsterdam
48 of the bankruptcies are published within this sector
The risk of this specific
sector in the Netherlands is Low
The risk of this specific
sector in the region Groot Amsterdam is Low
Publications
Filings 05-12-2013:
De jaarrekening over 2011 is gepubliceerd.
18-02-2013: De jaarrekening
over 2010 is gepubliceerd.
10-09-2012: De jaarrekening
over 2009 is gepubliceerd.
23-02-2010: De jaarrekening
over 2007 is gepubliceerd.
Functions 23-01-2012:
Per 06-12-2011 is bestuurder Vincent Jean Claude Pilette in functie
getreden.
23-01-2012: Per 06-12-2011 is
bestuurder Bryan Seuk Ko in functie getreden.
23-01-2012: Per 06-12-2011 is
bestuurder John Ritchie uit functie getreden.
23-01-2012: Per 06-12-2011 is
bestuurder Frank Mallozzi uit functie getreden.
23-01-2012:
Per 06-12-2011 is bestuurder Fred Steven Rosenzweig uit functie getreden
FOREIGN EXCHANGE RATES
|
Currency |
Unit
|
Indian Rupees |
|
US Dollar |
1 |
Rs.61.99 |
|
UK Pound |
1 |
Rs.102.67 |
|
Euro |
1 |
Rs.83.98 |
INFORMATION DETAILS
|
Report Prepared
by : |
MNL |
RATING EXPLANATIONS
|
RATING |
STATUS |
PROPOSED CREDIT LINE |
|
|
>86 |
Aaa |
Possesses an extremely sound financial base with the strongest
capability for timely payment of interest and principal sums |
Unlimited |
|
71-85 |
Aa |
Possesses adequate working capital. No caution needed for credit
transaction. It has above average (strong) capability for payment of interest
and principal sums |
Large |
|
56-70 |
A |
Financial & operational base are regarded healthy. General unfavourable
factors will not cause fatal effect. Satisfactory capability for payment of
interest and principal sums |
Fairly Large |
|
41-55 |
Ba |
Overall
operation is considered normal. Capable to meet normal commitments. |
Satisfactory |
|
26-40 |
B |
Capability to overcome financial difficulties seems comparatively
below average. |
Small |
|
11-25 |
Ca |
Adverse factors are apparent. Repayment of interest and principal sums
in default or expected to be in default upon maturity |
Limited with full
security |
|
<10 |
C |
Absolute credit risk exists. Caution needed to be exercised |
Credit not
recommended |
|
-- |
NB |
New Business |
-- |
This score serves as a reference to assess SC’s credit risk and
to set the amount of credit to be extended. It is calculated from a composite
of weighted scores obtained from each of the major sections of this report. The
assessed factors and their relative weights (as indicated through %) are as
follows:
Financial
condition (40%) Ownership
background (20%) Payment
record (10%)
Credit history
(10%) Market trend
(10%) Operational
size (10%)
This report is issued at your request without any
risk and responsibility on the part of MIRA INFORM PRIVATE LIMITED (MIPL)
or its officials.