MIRA
INFORM REPORT
|
Report Date : |
01.07.2014 |
IDENTIFICATION DETAILS
|
Name : |
FINOLEX CABLES LIMITED |
|
|
|
|
Registered
Office : |
26/27, |
|
|
|
|
Country : |
|
|
|
|
|
Financials (as
on) : |
31.03.2013 |
|
|
|
|
Date of
Incorporation : |
05.06.1967 |
|
|
|
|
Com. Reg. No.: |
11-016531 |
|
|
|
|
Capital
Investment / Paid-up Capital : |
Rs.305.900
millions |
|
|
|
|
CIN No.: [Company Identification
No.] |
L31300MH1967PLC016531 |
|
|
|
|
TAN No.: [Tax Deduction &
Collection Account No.] |
PNEF00515E |
|
|
|
|
Legal Form : |
Public Limited Liability Company. The Company’s Shares are Listed on the Stock Exchanges. |
|
|
|
|
Line of Business
: |
Manufacturer of electrical and telecommunication cables. |
|
|
|
|
No. of Employees
: |
1611 (Approximately) |
RATING & COMMENTS
|
MIRA’s Rating : |
A (67) |
|
RATING |
STATUS |
PROPOSED CREDIT LINE |
|
|
56-70 |
A |
Financial & operational base are regarded healthy. General unfavourable factors will not cause fatal effect.
Satisfactory capability for payment of interest and principal sums |
Fairly Large |
|
Status : |
Good |
|
|
|
|
Payment Behaviour : |
Regular |
|
|
|
|
Litigation : |
Exist |
|
|
|
|
Comments : |
Subject is a well-established and reputed company having a fine track
record. Financial position of the company seems to be sound. Trade relations
are reported as fair. Business is active. Payment terms are reported to be
regular. The company can be considered good for business dealings at usual
trade terms and conditions. |
NOTES :
Any query related to this report can be made
on e-mail : infodept@mirainform.com
while quoting report number, name and date.
INDIAN ECONOMIC OVERVIEW
NEWS
The economy grew 4.7 %in 2013/14, marking a
second straight year of sub-5 % growth – the worst slowdown in more than a
quarter of a century. The data was below an official estimate of 4.9 % annual
growth and compared with 4.5 % in the last fiscal year. However, the current
account deficit narrowed sharply to $ 32.4 billion at 1.7 % of gross domestic
product, in 2013/14 from a record high of $ 98.8 billion or 4.7 %, the year
before. A sharp fall in gold imports due to restrictions on overseas purchases
and muted import of capital goods helped shrink the current account deficit.
Online retailer Flipkart
has acquired fashion portal Myntra as it prepares to
battle with the rapidly expanding India arm of the global e-commerce giant
Amazon. The company raised $ 210 million from Russian Investment firm DST
Global which has also invested in companies like Facebook,
Twitter and Alibaba Group.
General Motors will start exporting vehicles
from its Talegaon plant near Pune
in the second half of 2014. GM was one of the few global carmakers that was
using its India plant only for the domestic market.
Google has overtaken Apple as the world’s top
brand in terms of value, according to global market research agency Millward Brown. Google’s brand value shot up 40 % in a year
to $ 158.84 billion. The top 10 of the 100 slots were dominated by US
companies.
Infosys lost another heavy weight when B G Srinivas,
a board member put in his papers. He is the third CEO-hopeful to quit after
Chairman N R Narayana Murthy’s return to the company
– Ashok Vemuri and V Balakrishnan being the other two.While
Vemuri went on to lead IGate,
Balakrishnan joined politics.
Naresh Goyal – promoted Jet Airways posted biggest
quarterly loss – Rs.2153.37 crore – in the three
months ended March 31, mainly because it has been offering discounts to
passengers to fill planes.
William S Pinckney – Chairman and CEO of
Amway India was arrested by the Andhra Pradesh Police in connection with a
complaint against the direct selling firm. This is the second time that he has
been taken into custody. A year, ago the Kerala
Police had arrested Pinckney and two company directors on charges of financial
irregularities.
China has told its state-owned enterprises to
sever links with American consulting firms after the United States charged five
Chinese military officers with hacking US companies. China’s action which
targets consultancies like McKinsey & Co. and the Boston Consulting Group,
sterns from fears that the first are providing trade secrets to the US
governments.
India has emerged as a country with some of
the highest unregistered businesses in the world. Indonesia has the maximum
number of shadow businesses, says a study of 68 countries by Imperial College
Business School in London.
Pfizer has abandoned its attempt to buy AstraZeneca for nearly $ 118 billion after the latter
refused an offer of 55 pounds a share.
EXTERNAL AGENCY RATING
|
Rating Agency Name |
CRISIL |
|
Rating |
Long Term Rating: AA+ |
|
Rating Explanation |
High degree of safety and very low credit risk. |
|
Date |
October 16, 2013 |
|
Rating Agency Name |
CRISIL |
|
Rating |
Short Term Rating: A1+ |
|
Rating Explanation |
Very strong degree of safety and lowest credit risk. |
|
Date |
October 16, 2013 |
RBI DEFAILTERS’ LIST STATUS
Subject’s name is not enlisted as a defaulter
in the publicly available RBI Defaulters’ list.
EPF (Employee Provident Fund) DEFAILTERS’ LIST STATUS
Subject’s name is not enlisted as a defaulter
in the publicly available EPF (Employee Provident Fund) Defaulters’ list as of
31-03-2012.
INFORMATION DECLINED BY
|
Name : |
Mr. Pravin Kulkarni
|
|
Designation : |
Senior Finance Officer |
|
Date : |
30.06.2014 |
LOCATIONS
|
Registered
Office/ Corporate Office/ Factory 1 (Electrical Cables) : |
26/27, Mumbai-Pune Road, Pimpri, Pune – 411 018, Maharashtra,
India |
|
|
Tel. No.: |
91-20-27475963 (15 lines)/ 27506200 |
|
|
Fax No.: |
91-20-27472239/ 27470344/ 27472224 |
|
|
E-Mail : |
|
|
|
Website : |
|
|
|
|
|
|
|
Factory 2 : |
Optic Fibre Division Urse Taluka Maval, District Pune – 410 506,
Maharashtra, India |
|
|
Tel. No.: |
91-2114-237003/ 4/ 5/ 6/ 7 |
|
|
Fax No.: |
91-2114-237009 |
|
|
E-Mail : |
||
|
|
|
|
|
Factory 3 : |
Switches
Division Gat No.344,
Village Urse, Taluka Maval, District Pune – 410 506,
Maharashtra, India |
|
|
Tel. No.: |
91-2114- 237021-2-3 |
|
|
Fax No.: |
91-2114-237006 |
|
|
E-Mail : |
||
|
|
|
|
|
Factory 4 : |
Goa (Electrical and
Communication Cables) 117/L118, Verna Industrial Estate, Verna Salcette,
Goa – 403 722, India |
|
|
Tel. No.: |
91-832-278202/ 3/ 4 |
|
|
Fax No.: |
91-832-2783909 |
|
|
E-Mail : |
||
|
|
|
|
|
Factory 5 : |
Goa (CCC Rod) S263/2A, Panjim - Belgaum
Road, Usgaon -Tisk, Ponda Goa – 403 406, India |
|
|
Tel. No.: |
91-832-2344376/ 8/ 9 |
|
|
Fax No.: |
91-832-2344140 |
|
|
E-Mail : |
||
|
|
|
|
|
Factory 6 : |
Urse (Electrical and
Communication Cables) Taluka Maval, District Pune – 410 506,
Maharashtra, India
|
|
|
Tel. No.: |
91-2114-237026/ 27 |
|
|
Fax No.: |
91-2114-237025 |
|
|
E-Mail : |
||
|
|
|
|
|
Factory 7 : |
Lighting
Division (CFL) / Sheets Division Plot No.399,
Village - Urse, Taluka - Maval, District Pune – 410 506,
Maharashtra, India
|
|
|
Tel. No.: |
91-2114-237035/ 237024 |
|
|
Fax No.: |
91-2114-237025 |
|
|
E-Mail : |
||
|
|
|
|
|
Factory 8 : |
HVPC Urse, Pune Gat No.343,
Village Urse, Taluka Maval, District Pune – 410 506,
Maharashtra, India
|
|
|
Tel. No.: |
91-2114-237001-5 |
|
|
Fax No.: |
91-2114-237006 |
|
|
E-Mail : |
||
|
|
|
|
|
Factory 9 : |
Goa (Communication
Cables) Plot No. L123/9A, Verna Industrial Estate, Verna Salcette,
South Goa, India
|
|
|
Tel. No.: |
91-832-2782002/ 3/ 4 |
|
|
Fax No.: |
91-832-2783909 |
|
|
E-Mail : |
||
|
|
|
|
|
Factory 10 : |
Roorkee Plot Nos. K-1
and K-2, AIS Industrial Estate, Jatherdeva Hoond, Manglaur, Roorkee, Taluka Haridwar – 247 667, Uttarakhand, India |
|
|
Tel. No.: |
91-1332-224069 |
|
|
Tele Fax No.: |
91-1332-224068 |
|
|
E-Mail : |
||
|
|
|
|
|
Branch Office : |
Located
at: ·
Ahmadabad ·
Bangalore ·
Bhubaneshwar ·
Chandigarh ·
Chennai ·
Coimbatore ·
Goa ·
Guwahati ·
Indore ·
Jaipur ·
Kochi ·
Kolkata ·
Mumbai
·
New Delhi ·
Raipur ·
Secunderabad ·
Lucknow · Dharwad |
|
DIRECTORS
AS ON 31.03.2013
|
Name : |
Mr. P.P Chhabria |
|
Designation : |
Chairman |
|
Address : |
9, ICS Colony, Ganeshkhind Road, Pune – 411 007, Maharashtra,
India |
|
|
|
|
Name : |
Dr. D.K. Chhabria |
|
Designation : |
Managing Director |
|
|
|
|
Name : |
Dr. H.S. Vachha |
|
Designation : |
Director |
|
|
|
|
Name : |
Mr. Atul C. Choksey |
|
Designation : |
Director |
|
|
|
|
Name : |
Mr. Sanjay K.
Asher |
|
Designation : |
Director |
|
|
|
|
Name : |
Mr. P.G. Pawar |
|
Designation : |
Director |
|
|
|
|
Name : |
Mr. S.B Ravi (Pandit) |
|
Designation : |
Director |
|
|
|
|
Name : |
Mr. Pradeep R. Rathi |
|
Designation : |
Director |
|
|
|
|
Name : |
Mr. Adi. J. Engineer |
|
Designation : |
Director |
|
|
|
|
Name : |
Dr. V.G. Pai |
|
Designation : |
Director |
|
|
|
|
Name : |
Mr. M. Viswanathan |
|
Designation : |
Director Finance
and Chief Financial Officer |
KEY EXECUTIVES
|
Name : |
Mr. R.G. D’Silva |
|
Designation : |
Company Secretary and Vice President (Legal) |
|
|
|
|
Name : |
Mr. Pravin Kulkarni
|
|
Designation : |
Senior Finance Officer |
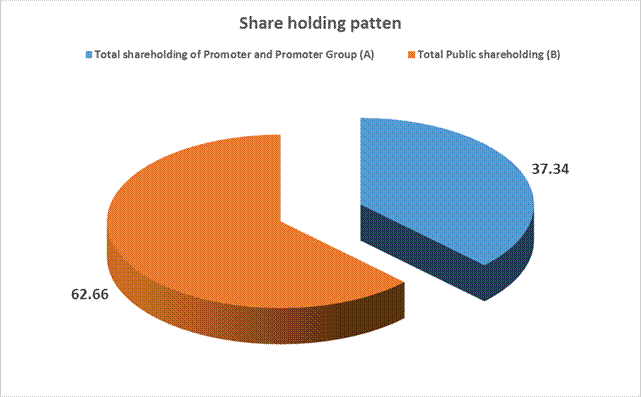
MAJOR SHAREHOLDERS / SHAREHOLDING PATTERN
AS ON 31.03.2014
|
Category of Shareholders |
No. of Shares |
Percentage of
Holding |
|
(A)
Shareholding of Promoter and Promoter Group |
|
|
|
|
|
|
|
|
7875300 |
5.36 |
|
|
46966170 |
31.98 |
|
|
54841470 |
37.34 |
|
|
|
|
|
Total
shareholding of Promoter and Promoter Group (A) |
54841470 |
37.34 |
|
(B)
Public Shareholding |
|
|
|
|
|
|
|
|
13258720 |
9.03 |
|
|
2963851 |
2.02 |
|
|
8419318 |
5.73 |
|
|
24641889 |
16.78 |
|
|
|
|
|
|
27083047 |
18.44 |
|
|
|
|
|
|
25980564 |
17.69 |
|
|
14305950 |
9.74 |
|
|
67369561 |
45.88 |
|
Total
Public shareholding (B) |
92011450 |
62.66 |
|
Total
(A)+(B) |
146852920 |
100.00 |
|
(C)
Shares held by Custodians and against which Depository Receipts have been
issued |
0 |
0.00 |
|
|
0 |
0.00 |
|
|
6086425 |
0.00 |
|
|
6086425 |
0.00 |
|
Total
(A)+(B)+(C) |
152939345 |
0.00 |
Shareholding of securities (including shares, warrants, convertible
securities) of persons belonging to the category Promoter and Promoter Group
|
Sl. No. |
Name of the Shareholder |
Details of Shares held |
|
|
No. of Shares held |
As a % of grand total |
||
|
1 |
Pralhad
Parsram Chhabria |
1760400 |
1.15 |
|
2 |
Sunita
Kishan Chhabria |
1163400 |
0.76 |
|
3 |
Aruna
Katara |
1052850 |
0.69 |
|
4 |
Kishan
Parsram Chhabria |
950750 |
0.62 |
|
5 |
Deepak
Kishan Chhabria |
936750 |
0.61 |
|
6 |
Prakash
Pralhad Chhabria |
831850 |
0.54 |
|
7 |
Vijay
Kishan Chhabria |
539250 |
0.35 |
|
8 |
Hansika
Hiya Prakash Chhabria |
105000 |
0.07 |
|
9 |
Gayatri
Prakash Chhabria |
105000 |
0.07 |
|
10 |
Ritu
Prakash Chhabria |
95000 |
0.06 |
|
11 |
Amit
Katara |
87400 |
0.06 |
|
12 |
Amrita
Katara |
85400 |
0.06 |
|
13 |
Vini
Deepak Chhabria |
33750 |
0.02 |
|
14 |
Katara
Mukesh Dolumal |
31000 |
0.02 |
|
15 |
Radhika
Deepak Chhabria |
30000 |
0.02 |
|
16 |
Karan
Vijay Chhabria |
22500 |
0.01 |
|
17 |
Priya
Vijay Chhabria |
22500 |
0.01 |
|
18 |
Rishi
Vijay Chhabria |
22500 |
0.01 |
|
19 |
Orbit
Electricals Private Limited |
46956120 |
30.70 |
|
20 |
Katara
Dental Private Limited |
10050 |
0.01 |
|
|
Total |
54841470 |
35.86 |
Shareholding of securities (including shares, warrants, convertible
securities) of persons belonging to the category Public and holding more than
1% of the total number of shares
|
Sl. No. |
Name of the Shareholder |
No. of Shares held |
Shares as % of Total No. of Shares |
|
|
1 |
Finolex
Industries Limited |
22187075 |
14.51 |
|
|
2 |
Anil
R Chhabria |
5146060 |
3.36 |
|
|
3 |
Franklin
Templeton Mutual Fund A/c Franklin India |
4236345 |
2.77 |
|
|
4 |
Life
Insurance Corporation of India |
2824234 |
1.85 |
|
|
5 |
Franklin
India Smaller Companies Fund |
1838484 |
1.20 |
|
|
6 |
Leela
Ramchand Chhabria |
1779600 |
1.16 |
|
|
7 |
Reliance
Capital Trustee Co Limited A/c Reliance Div |
1690873 |
1.11 |
|
|
8 |
Integrated
Core Strategies Asia Pte Limited |
1547014 |
1.01 |
|
|
|
Total |
41249685 |
26.97 |
Shareholding of securities (including shares, warrants, convertible
securities) of persons (together with PAC) belonging to the category “Public”
and holding more than 5% of the total number of shares of the company
|
Sl. No. |
Name(s) of the shareholder(s) and the Persons Acting in Concert (PAC)
with them |
No. of Shares |
Shares as % of Total No. of Shares |
|
|
1 |
Finolex Industries Limited |
22187075 |
14.51 |
|
|
|
Total |
22187075 |
14.51 |
Details of Depository Receipts (DRs)
|
Sl. No. |
Type of Outstanding DR (ADRs, GDRs, SDRs, etc.) |
No. of Outstanding DRs |
No. of Shares Underlying |
Shares Underlying Outstanding DRs as % of
Total No. of Shares |
|
1 |
Global Depository |
6086425 |
6086425 |
3.98 |
|
|
Total |
6086425 |
6086425 |
3.98 |
BUSINESS DETAILS
|
Line of Business : |
Manufacturer of electrical and telecommunication cables. |
||||||||||||||||||
|
|
|
||||||||||||||||||
|
Products : |
|
PRODUCTION STATUS [AS ON
31.03.2011]
|
Particulars |
Unit |
Installed
Capacity |
Actual
Production |
|
Electrical Cables |
TCKM |
2467.97 |
1241.83 # |
|
Communication
Cables Optic Fibre Cables |
KM |
58000.00 |
37116.78 |
|
Other
Communication Cables |
TCKM |
5648.00 |
634.61 |
|
PVC Sheets and
Accessories |
MT |
2100.00 |
1331.70 |
|
Fibre |
KM |
150000.00 |
779736.33 * |
|
Poly coated FRP
Rod |
KM |
24000.00 |
19268.48 |
|
Continuous Cast
Copper Rods |
MT |
60000.00 |
33419.75 @ |
Notes:
Installed capacities are certified by the Managing Director and relied upon by the Auditors
- # Equivalent tonnage 32,297 MT
- * Includes captive consumption of 668,730 Kms
- @ captive consumption of 21,906,538MT and Job Work done 0.00
5,000 TCKM of JFTC Capacity is interchangeable with 332 TCKM of Electrical Cable capacity.
GENERAL INFORMATION
|
No. of Employees : |
1611 (Approximately) |
||||||||||||||||||||||||||||||||||||||||||||||||||||||||||
|
|
|
||||||||||||||||||||||||||||||||||||||||||||||||||||||||||
|
Bankers : |
|
||||||||||||||||||||||||||||||||||||||||||||||||||||||||||
|
|
|
||||||||||||||||||||||||||||||||||||||||||||||||||||||||||
|
Facilities : |
Notes: LONG TERM BORROWINGS
|
|
Banking
Relations : |
-- |
|
|
|
|
Auditors : |
|
|
Name : |
B.K. Khare and Company Chartered Accountants |
|
Address : |
706/707, Sharda Chambers, 7th Floor, New Marine Lines,
Mumbai – 400 020, Maharashtra, India |
|
Tel. No.: |
91-22-22000607/7318/6360 91-22-66315835/36 |
|
Fax No.: |
91-22-22003476 |
|
E-Mail : |
|
|
|
|
|
Cost Auditor : |
|
|
Name : |
Joshi Apte and Associates Cost Accountants |
|
|
|
|
Solicitors : |
Crawford Bayley and Company |
|
|
|
|
Associates : |
|
|
|
|
|
Joint Venture : |
·
Finolex J-Power System
Private Limited ·
Corning Finolex Optical
Fibre Private Limited |
|
|
|
|
Enterprises over
which Key Management Personnel and their Relatives exercise significance
influence : |
·
Orbit Electricals
Private Limited ·
Finolex Infrastructure
Limited ·
Magnum Machines Limited |
CAPITAL STRUCTURE
AS ON 31.03.2013
Authorised Capital :
|
No. of Shares |
Type |
Value |
Amount |
|
235000000 |
Equity Shares |
Rs.2/- each |
Rs.470.000 millions |
|
15000000 |
Unclassified Shares |
Rs.2/- each |
Rs.30.000 millions |
|
|
Total |
|
Rs.500.000
millions |
|
|
|
|
|
Issued, Subscribed & Paid-up Capital :
|
No. of Shares |
Type |
Value |
Amount |
|
152939345 |
Equity Shares |
Rs.2/- each |
Rs.305.900
millions |
|
|
|
|
|
Reconciliation of the
shares outstanding at the beginning and at the end of the reporting period
|
Equity Shares |
As on 31.03.2013 |
|
|
Number |
Amount (Rs in Millions) |
|
|
Balance at the beginning of the period |
152939345 |
305.900 |
|
Issued during the year |
-- |
-- |
|
Outstanding at the
end of the year |
152939345 |
305.900 |
Terms / rights
attached to Equity Shares
The Company has
only one class of Equity Shares having a par value of Rs.2 per share. Each
holder of Equity Shares is entitled to one vote per share held. The dividend
proposed by the Board of Directors is subject to the approval of the
shareholders in the ensuing Annual General Meeting, except in case of Interim
dividend.
During the year
ended 31st March 2013, the amount of per share dividend recognised as distributions to the equity shareholders is
Rs.1.20 per share.
In the event of
liquidation of the Company, the holders of Equity Shares will be entitled to
receive remaining assets of the Company, after distribution of all preferential
amounts. The distribution will be in proportion to the number of Equity Shares
held by the shareholders.
Shares held by
holding/ultimate holding company and/or their subsidiaries/associates
There are no shares held by holding/ultimate holding company
and/or their subsidiaries/associates.
Details of
shareholders holding more than 5% shares in the Company
|
|
As on 31.03.2013 |
|
|
Equity Shares |
Number of shares |
% |
|
Finolex Industries Limited |
22187075 |
14.50 |
|
Life Insurance Corporation of India |
7749398 |
5.10 |
|
Orbit Electricals Private Limited |
46843120 |
30.60 |
Aggregate number
of Bonus Shares issued, Shares issued for consideration other than cash and
Shares bought back during the period of five years immediately preceding the
reporting date.
There are no Bonus
Shares issued, Shares issued for consideration other than cash and Shares
bought back during the period of five years immediately preceding the reporting
date.
Terms of
securities issued with conversion option into Equity / Preference Shares
There are no
securities issued with conversion option into Equity/Preference Shares
FINANCIAL DATA
[all figures are
in Rupees Millions]
ABRIDGED BALANCE
SHEET
|
SOURCES OF FUNDS |
31.03.2013 |
31.03.2012 |
31.03.2011 |
|
I.
EQUITY AND LIABILITIES |
|
|
|
|
(1) Shareholders' Funds |
|
|
|
|
(a) Share Capital |
305.900 |
305.900 |
305.900 |
|
(b) Reserves & Surplus |
8937.300 |
7698.400 |
6868.900 |
|
(c) Money received against share warrants |
0.000 |
0.000 |
0.000 |
|
|
|
|
|
|
(2) Share Application money pending allotment |
0.000 |
0.000 |
0.000 |
|
Total Shareholders’
Funds (1) + (2) |
9243.200 |
8004.300 |
7174.800 |
|
|
|
|
|
|
(3) Non-Current
Liabilities |
|
|
|
|
(a) Long-term borrowings |
1451.500 |
1162.200 |
970.400 |
|
(b) Deferred tax liabilities (Net) |
344.700 |
326.100 |
310.400 |
|
(c) Other long
term liabilities |
13.600 |
1.800 |
0.000 |
|
(d) Long-term
provisions |
528.300 |
342.100 |
536.000 |
|
Total Non-current
Liabilities (3) |
2338.100 |
1832.200 |
1816.800 |
|
|
|
|
|
|
(4) Current Liabilities |
|
|
|
|
(a)
Short term borrowings |
171.100 |
383.200 |
291.900 |
|
(b)
Trade payables |
632.900 |
563.800
|
306.900
|
|
(c)
Other current liabilities |
1391.200 |
1189.900
|
2443.400
|
|
(d) Short-term
provisions |
264.900 |
187.100
|
162.400
|
|
Total Current
Liabilities (4) |
2460.100 |
2324.000 |
3204.600 |
|
|
|
|
|
|
TOTAL |
14041.400 |
12160.500 |
12196.200 |
|
|
|
|
|
|
II.
ASSETS |
|
|
|
|
(1) Non-current assets |
|
|
|
|
(a) Fixed Assets |
|
|
|
|
(i) Tangible assets |
4120.700 |
4291.900 |
4032.900 |
|
(ii)
Intangible Assets |
0.400 |
0.400 |
0.400 |
|
(iii)
Capital work-in-progress |
357.300 |
120.200 |
187.600 |
|
(iv)
Intangible assets under development |
0.000 |
0.000 |
0.000 |
|
(b) Non-current Investments |
2173.900 |
2188.800 |
2090.300 |
|
(c) Deferred tax assets (net) |
0.000 |
0.000 |
0.000 |
|
(d) Long-term Loan and Advances |
166.500 |
40.200 |
142.900 |
|
(e) Other
Non-current assets |
190.800 |
121.000 |
0.000 |
|
Total Non-Current
Assets |
7009.600 |
6762.500 |
6454.100 |
|
|
|
|
|
|
(2) Current assets |
|
|
|
|
(a)
Current investments |
1067.000 |
183.300 |
361.200 |
|
(b)
Inventories |
3296.300 |
2811.400
|
2808.400
|
|
(c)
Trade receivables |
1496.500 |
1140.900
|
1302.400
|
|
(d) Cash
and cash equivalents |
398.100 |
490.000
|
212.900
|
|
(e)
Short-term loans and advances |
771.800 |
772.400
|
1051.600
|
|
(f)
Other current assets |
2.100 |
0.000
|
5.600
|
|
Total
Current Assets |
7031.800 |
5398.000 |
5742.100 |
|
|
|
|
|
|
TOTAL |
14041.400 |
12160.500 |
12196.200 |
PROFIT & LOSS
ACCOUNT
|
|
PARTICULARS |
31.03.2013 |
31.03.2012 |
31.03.2011 |
|
|
|
SALES |
|
|
|
|
|
|
|
Revenue from Operations (Net) |
22706.800 |
20641.600 |
20357.500 |
|
|
|
Other Income |
241.700 |
319.900 |
260.900 |
|
|
|
TOTAL (A) |
22948.500 |
20961.500 |
20618.400 |
|
|
|
|
|
|
|
|
Less |
EXPENSES |
|
|
|
|
|
|
|
Cost of
Materials Consumed |
17129.200 |
15769.500 |
16365.900 |
|
|
|
Purchase of
Stock-in-Trade |
60.400 |
24.000 |
23.800 |
|
|
|
(Increase) /
Decrease in Inventories of Finished Goods, Work in Progress and
Stock-in-Trade |
(296.800) |
126.900 |
(640.600) |
|
|
|
Employee Benefit
Expense |
845.900 |
694.800 |
647.400 |
|
|
|
Other Expenses |
2671.500 |
2234.600 |
2226.700 |
|
|
|
Exceptional
Items - Income / (Expenses) |
23.100 |
363.600 |
344.400 |
|
|
|
TOTAL (B) |
20640.300 |
19213.400 |
18967.600 |
|
|
|
|
|
|
|
|
Less |
PROFIT
/ (LOSS) BEFORE INTEREST, TAX, DEPRECIATION AND AMORTISATION (A-B) (C) |
2308.200 |
1748.100 |
1650.800 |
|
|
|
|
|
|
|
|
|
Less |
FINANCIAL
EXPENSES (D) |
133.800 |
260.700 |
191.200 |
|
|
|
|
|
|
|
|
|
|
PROFIT
/ (LOSS) BEFORE TAX, DEPRECIATION AND AMORTISATION (C-D) (E) |
2174.400 |
1487.400 |
1459.600 |
|
|
|
|
|
|
|
|
|
Less/ Add |
DEPRECIATION/
AMORTISATION (F) |
466.300 |
394.700 |
387.800 |
|
|
|
|
|
|
|
|
|
|
PROFIT / (LOSS)
BEFORE TAX (E-F) (G) |
1708.100 |
1092.700 |
1071.800 |
|
|
|
|
|
|
|
|
|
Less |
TAX (H) |
255.400 |
110.800 |
203.700 |
|
|
|
|
|
|
|
|
|
|
PROFIT / (LOSS)
AFTER TAX (G-H) (I) |
1452.700 |
981.900 |
868.100 |
|
|
|
|
|
|
|
|
|
Add |
PREVIOUS YEARS’
BALANCE BROUGHT FORWARD |
1534.900 |
795.200 |
401.600 |
|
|
|
|
|
|
|
|
|
Less |
APPROPRIATIONS |
|
|
|
|
|
|
|
Proposed dividend on the Equity Shares |
183.500 |
122.400 |
107.100 |
|
|
|
Dividend distribution tax on proposed dividend on Equity Shares |
30.300 |
19.800 |
17.400 |
|
|
|
Transferred to Debenture Redemption Reserve |
0.000 |
0.000 |
250.000 |
|
|
|
Transfer to General Reserve |
150.000 |
100.000 |
100.000 |
|
|
BALANCE CARRIED
TO THE B/S |
2623.800 |
1534.900 |
795.200 |
|
|
|
|
|
|
|
|
|
|
EARNINGS IN
FOREIGN CURRENCY |
|
|
|
|
|
|
|
FOB Value of Exports |
486.900 |
483.900 |
393.700 |
|
|
TOTAL EARNINGS |
486.900 |
483.900 |
393.700 |
|
|
|
|
|
|
|
|
|
|
IMPORTS |
|
|
|
|
|
|
|
Raw Materials |
1263.000 |
731.900 |
895.500 |
|
|
|
Spares and Components |
21.000 |
19.600 |
22.000 |
|
|
|
Capital Goods |
93.700 |
215.400 |
32.300 |
|
|
TOTAL IMPORTS |
1377.700 |
966.900 |
949.800 |
|
|
|
|
|
|
|
|
|
|
Earnings Per
Share (Rs.) |
9.50 |
6.40 |
5.70 |
|
KEY RATIOS
|
PARTICULARS |
|
31.03.2013 |
31.03.2012 |
31.03.2011 |
|
PAT / Total Income |
(%) |
6.33 |
4.68 |
4.21 |
|
|
|
|
|
|
|
Net Profit Margin (PBT/Sales) |
(%) |
7.52 |
5.29 |
5.26 |
|
|
|
|
|
|
|
Return on Total Assets (PBT/Total Assets} |
(%) |
14.84 |
11.09 |
10.81 |
|
|
|
|
|
|
|
Return on Investment (ROI) (PBT/Networth) |
|
0.18 |
0.14 |
0.15 |
|
|
|
|
|
|
|
Debt Equity Ratio (Total Debt/Networth) |
|
0.18 |
0.19 |
0.18 |
|
|
|
|
|
|
|
Current Ratio (Current Asset/Current Liability) |
|
2.86 |
2.32 |
1.79 |
FINANCIAL ANALYSIS
[all figures are
in Rupees Millions]
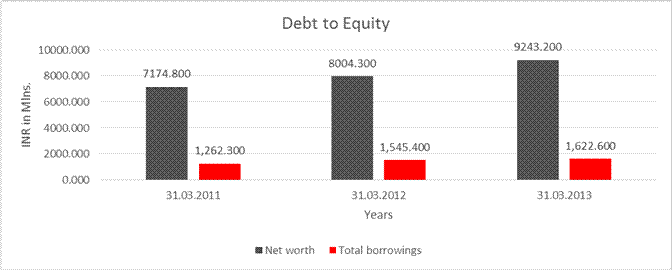
DEBT EQUITY RATIO
|
Particular |
31.03.2011 |
31.03.2012 |
31.03.2013 |
|
|
(INR in Mlns.) |
(INR in Mlns.) |
(INR in Mlns.) |
|
Share Capital |
305.900 |
305.900 |
305.900 |
|
Reserves & Surplus |
6868.900 |
7698.400 |
8937.300 |
|
Net worth |
7174.800 |
8004.300 |
9243.200 |
|
|
|
|
|
|
Long-term borrowings |
970.400 |
1162.200 |
1451.500 |
|
Short term borrowings |
291.900 |
383.200 |
171.100 |
|
Total borrowings |
1262.300 |
1545.400 |
1622.600 |
|
Debt/Equity ratio |
0.176 |
0.193 |
0.176 |
YEAR-ON-YEAR GROWTH
|
Year on Year Growth |
31.03.2011 |
31.03.2012 |
31.03.2013 |
|
|
(INR in Mlns) |
(INR in Mlns) |
(INR in Mlns) |
|
Revenue
from Operations (Net) |
20357.500 |
20641.600 |
22706.800 |
|
|
|
1.396 |
10.005 |

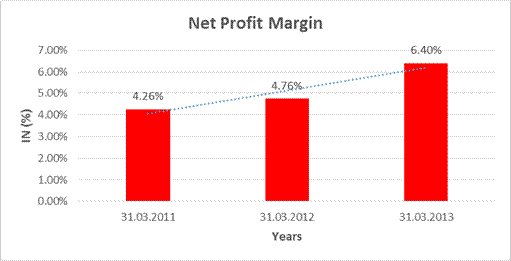
NET PROFIT MARGIN
|
Net Profit Margin |
31.03.2011 |
31.03.2012 |
31.03.2013 |
|
|
(INR in Mlns) |
(INR in Mlns) |
(INR in Mlns) |
|
Revenue
from Operations (Net) |
20357.500 |
20641.600 |
22706.800 |
|
Profit |
868.100 |
981.900 |
1452.700 |
|
|
4.26% |
4.76% |
6.40% |
LOCAL AGENCY FURTHER INFORMATION
Details of Current maturities of long-term borrowing:
|
Particulars |
31.03.2013 (Rs.
in millions) |
31.03.2012 (Rs.
in millions) |
31.03.2011 (Rs.
in millions) |
|
Current maturities of
long-term borrowing |
183.500 |
170.900 |
1338.200 |
|
Check
List by Info Agents |
Available
in Report (Yes / No) |
|
1) Year of Establishment |
Yes |
|
2) Locality of the firm |
Yes |
|
3) Constitutions of the firm |
Yes |
|
4) Premises details |
No |
|
5) Type of Business |
Yes |
|
6) Line of Business |
Yes |
|
7) Promoter’s background |
No |
|
8) No. of employees |
Yes |
|
9) Name of person contacted |
Yes |
|
10) Designation of contact person |
Yes |
|
11) Turnover of firm for last three years |
Yes |
|
12) Profitability for last three years |
Yes |
|
13) Reasons for variation <> 20% |
-- |
|
14) Estimation for coming financial year |
No |
|
15) Capital in the business |
Yes |
|
16) Details of sister concerns |
Yes |
|
17) Major suppliers |
No |
|
18) Major customers |
No |
|
19) Payments terms |
No |
|
20) Export / Import details (if
applicable) |
No |
|
21) Market information |
-- |
|
22) Litigations that the firm / promoter
involved in |
Yes |
|
23) Banking Details |
Yes |
|
24) Banking facility details |
Yes |
|
25) Conduct of the banking account |
-- |
|
26) Buyer visit details |
-- |
|
27) Financials, if provided |
Yes |
|
28) Incorporation details, if applicable |
Yes |
|
29) Last accounts filed at ROC |
Yes |
|
30) Major Shareholders, if available |
Yes |
|
31)
Date of Birth of Proprietor/Partner/Director, if available |
No |
|
32)
PAN of Proprietor/Partner/Director, if available |
No |
|
33)
Voter ID No of Proprietor/Partner/Director, if available |
No |
|
34)
External Agency Rating, if available |
Yes |
LITIGATION
DETAILS:
Case Details
Bench:-Bombay
Lodging No.:- ITXAL/20/2012
Filing Date:- 06.01.2012
Reg. No.:- ITXA/730/2012
Reg. Date:- 24.07.2012
Petitioner:- The Commissioner of Income Tax – (Central)
Respondent:- Finolex Cables
Limited
Petn.
Adv.:- Vipul Arun Bajpayee (I4135)
District:- PUNE
Bench:- DIVISION
Status:- Admitted (Unready)
Category:- TAX APPEALS
Last Date:- 12.02.2013
Stage:- FOR DIRECTION
Last Coram:- HON'BLE
SHRI JUSTICE J.P. DEVADHAR
HON'BLE SHRI JUSTICE
M.S. SANKLECHA
Act :- Income Tax Act, 1961
Under Section:- 260A
INDEX OF CHARGES:
|
S.No. |
Charge ID |
Date of Charge
Creation/Modification |
Charge amount
secured |
Charge Holder |
Address |
Service Request
Number (SRN) |
|
1 |
10353872 |
27/03/2012 |
750,000,000.00 |
AXIS TRUSTEE
SERVICES LIMITED |
AXIS HOUSE, 2ND
FLOOR, BOMBAY DYEING MILLS COMPOUND, PANDURANG BUDHKAR MARG, WORLI, MUMBAI,
MAHARASHTRA - 400025, INDIA |
B39004361 |
|
2 |
10270460 |
23/02/2011 * |
500,000,000.00 |
AXIS TRUSTEE
SERVICES LIMITED |
AXIS HOUSE, 2ND
FLOOR, BOMBAY DYEING MILLS COMPOUND, PANDURANG BUDHKAR MARG, WORLI, MUMBAI,
MAHARASHTRA - 400025, INDIA |
B08437824 |
|
3 |
10192895 |
21/12/2009 |
470,000,000.00 |
STANDARD
CHARTERED BANK |
90 M G ROAD,
MUMBAI, MAHARASHTRA - 400001, INDIA |
A75573964 |
|
4 |
90090849 |
30/12/1998 |
500,000,000.00 |
BANK OF BARODA |
CORPORATE
BANKING BRANCH, MANTRI COURT; 1ST FLOOR; 39; DR. AMBEDKAR ROAD, PUNE,
MAHARASHTRA - 411001, INDIA |
- |
|
5 |
90084770 |
11/06/2001 * |
285,500,000.00 |
CORPORATION BANK |
INDUSTRIAL
FINANCE BRANCH, PUNE, MAHARASHTRA - 411003, INDIA |
- |
|
6 |
90090621 |
24/06/2005 * |
1,361,500,000.00 |
BANK OF
MAHARASHTRA |
INDUSTRIAL
FINANCE BRANCH, PUNE, MAHARASHTRA, INDIA |
- |
|
7 |
90090594 |
13/02/1998 * |
550,000,000.00 |
BANQUE NATIONALE
DE PARIS |
C G-3 KONARK
ESTATES, 9 CONNAUGHT ROAD, PUNE, MAHARASHTRA - 411001, INDIA |
- |
|
8 |
90088034 |
27/04/1998 * |
500,000,000.00 |
THE INDUSTRIAL
CREDIT AND INVESTMENT CORP. OF INDIA LIMITED |
163; BACKBAY
RECLAMATION, MUMBAI, MAHARASHTRA - 400020, INDIA |
- |
|
9 |
90087982 |
04/07/1996 * |
130,000,000.00 |
THE INDUSTRIAL
CREDIT AND INVESTMENT CORP. OF INDIA |
163; BACKBAY
RECLAMATION, BOMBAY, MAHARASHTRA - 400020, INDIA |
- |
|
10 |
90087939 |
07/10/1995 * |
150,000,000.00 |
THE INDUSTRIAL
CREDIT AND INVESTMENT CORP. OF BANK L |
163; BACKBAY
RECLAMATION, BOMBAY, MAHARASHTRA - 400020, INDIA |
- |
|
11 |
90089875 |
17/09/1993 |
50,000,000.00 |
THE INDUSTRIAL
CREDIT AND INVESTMENT CORP. OF INDIA |
163; BACKBAY
RECLAMATION, BOMBAY, MAHARASHTRA - 400020, INDIA |
- |
|
12 |
90093410 |
01/09/1993 |
14,000,000.00 |
CITIBANK N. A. |
293; D. N. ROAD,
BOMBAY, MAHARASHTRA - 400001, INDIA |
- |
|
13 |
90082377 |
26/05/1993 |
60,000,000.00 |
BARCLAYS BANK
PLC |
21/23; MAKER
CHAMBERS VI, NARIMAN POINT, BOMBAY, |
- |
|
14 |
90089777 |
25/09/1992 |
180,000,000.00 |
THE INDUSTRIAL
CREDIT AND INVESTMENT CORP. OF INDIA |
163; BACKBAY
RECLAMATION, BOMBAY, MAHARASHTRA - 400020, INDIA |
- |
|
15 |
90087747 |
26/05/1993 * |
85,000,000.00 |
THE INDUSTRIAL
CREDIT AND INVESTMENT CORPORATION OF |
163; BACKBAY
RECLAMATION, BOMBAY, MAHARASHTRA - 400020, INDIA |
- |
|
16 |
90089725 |
26/02/1993 * |
16,000,000.00 |
CORPORATION BANK |
ADITI COMMERCE
CENTRE, H-2406; GEN. THIMAYYA ROAD; PUNE CAMP, PUNE, MAHARASHTRA - 411001,
INDIA |
- |
|
17 |
90089718 |
17/02/1992 |
10,500,000.00 |
ANZ GRINDLAYS
BANK |
90; MAHATMA
GANDHI ROAD, P. O. BOX 141, BOMBAY, MAHARASHTRA - 400001, INDIA |
- |
|
18 |
90093581 |
27/08/1991 |
40,500,000.00 |
ANZ GRINDLAYS
BANK |
90; MAHATMA
GANDHI ROAD, P. O. BOX 141, BOMBAY, MAHARASHTRA - 400001, INDIA |
- |
|
19 |
90089285 |
27/08/1991 * |
5,000,000.00 |
AMERICAN EXPRESS
BANK LIMITED |
ORIENTAL
BUILDING; 364, DR. D.N. ROAD, BOMBAY, MAHARASHTRA - 400001, INDIA |
- |
|
20 |
90089284 |
10/11/1993 * |
2,500,000.00 |
THE SARASWAT
COOPERATIVE BANK LIMITED |
HOTEL SURAKIRAN;
MIDC INDUSTRIAL ESTATE, BOMBAY-P |
- |
|
21 |
90089118 |
29/05/2010 * |
4,500,000,000.00 |
CENTRAL BANK OF
INDIA LIMITED |
BRANCH OFFICE
AT- JEWEL OF PIMPRI, 'B' WING, 1ST, |
A87731485 |
|
22 |
90083158 |
26/05/1993 * |
5,500,000.00 |
CENTRAL BANK OF
INDIA |
PIMPRI BRANCH;
SR. NO. 22/1, POONAM CHAMBERS; PIMPRI, PUNE, MAHARASHTRA - 411018, INDIA |
- |
* Date of charge modification
|
Unsecured Loan |
31.03.2013 (Rs. in Millions) |
31.03.2012 (Rs. in Millions) |
|
LONG TERM BORROWINGS |
|
|
|
Deferred Sales Tax Loan |
20.600 |
23.100 |
|
SHORT - TERM BORROWINGS |
|
|
|
From Banks in
Foreign Currency |
|
|
|
Buyers’ Credit |
171.100 |
179.700 |
|
Total |
191.700 |
202.800 |
BACKGROUND
Economic recovery
that was expected at the beginning of the year has not materialized. Global
economic growth was lower than in the previous year with all the stars of the
past few years (China/India/Other BRIC nations) clocking very moderate growth.
Most of the large economies which were affected by the crisis of 2008 were
still resorting to quantitative easing in some form or the other, hoping to
stimulate investment and economic activity; however clear signs of recovery are
still to emerge.
On the domestic
front, a few issues continue to defy solutions - inflation has been ruling high
for well over two years now leading to a period of relatively high interest
rates and its negative impact on the economy; GDP growth of 5%,which is far
lower than the 6.5% reported in the previous year and way below the 8% average
that was achieved in the years leading upto 2010; the
high level of government’s fiscal deficit at 5.4% continues to trouble the
economy; and a continuously depreciating Rupee – from a level of Rs.50.88 in
March, 2012 to the US Dollar, the Rupee in March, 2013 closed at Rs.54.285.
The Government
expects the economy to pick up after faltering last year – GDP is expected to
grow at around 6.5% in the coming financial year; fiscal deficit is expected to
be contained to under 5% of GDP, and inflation is expected to be around 6.5%.
However, this will depend on how some elements of the economy play out – such
as oil and commodity prices, availability of adequate finances and the ability
of the manufacturing sector to pull itself out of the current situation.
OPERATIONS
Overall sales grew
by 10% in value terms in 2012-13 when compared to the previous year. In volume
terms the growth was higher at 14%. Higher volumes were achieved in both
Electrical as well as Communication Cable segments. Star performances came in
from product offerings to the following customer sectors – automotive,
agriculture and construction in the Electrical Cables segment and Coaxial and
Optic Fibre Cables in the Communication Cable
segment. Towards the end of the period, however, it was clear that both the
Auto and Infrastructure (Power) sectors were under strain. On the other hand
recent developments within the Telecom sector viz. announcement of the
intention by the Government to create a nationwide Optic Fibre
Network to provide connectivity to village panchayats,
roll out of 4G services by some Telecom service providers etc will substantially
improve growth possibilities in the coming financial year. Outlook on orders
from this segment looks promising.
Income for the
year was higher at Rs.22948.500 millions (previous year Rs.20961.500 millions)
representing a growth of 10% over the previous year. The Company has recorded a
Net Profit after Tax of Rs.1452.700 millions as against a Net Profit of
Rs.981.900 millions in the previous year. The improved profitability comes from
a better product mix, higher capacity utilization, growth in sales volumes
across the product lines mentioned above, tight monitoring of working capital
requirement and improved purchasing efficiencies.
EXPANSION AND
CONSOLIDATION
Consolidation of
the Pune manufacturing operations is underway as
planned. Most operations would be consolidated at the Urse
site by end 2013, with limited activity remaining at Pimpri.
This will help further improve the cost competitiveness in the Low Duty
Electrical Cables offered by the Company.
As announced in
February 2013, the Company will set up a 5MW solar power plant at its Urse site, which has ample land, a part of which will be
used to set up this facility. The facility will cost approximately Rs.400.000
millions to build and it is expected to be operational by January 2014. The
power generated will be entirely consumed within the Urse
site leading to cost efficiencies.
The Roorkee facility expansion is also well under way.
Construction of a new factory shed is almost complete and new machinery has
started arriving at the site. Commissioning of equipment is expected to be
complete by end 2013. The expansion is expected to be within the budget of
Rs.1000.000 millions and will be completed within the timeframe initially set.
In view of the
opportunities now visible in the Telecom sector, the Company is investing in
additional cable making equipment at the Optical Fibre
Cable facility at Goa. Over the next year an
investment of around Rs. 500 million is envisaged.
JOINT VENTURES
Finolex J-Power Systems Private Limited, Shirval near Pune
As mentioned in
the previous year’s report the JV is now fully operational and has been
participating in tenders both locally as well as overseas. The JV has secured
its first large order (valued at Rs.380.000 millions) to supply 132 Kv power cables to the Maharashtra
State Electricity Transmission Co. Limited Thus far, the JV has supplied cables
at the 66Kv and 110Kv range to its customers.
As members will be
aware, in respect of the products offered by the JV, pre-qualification
requirements are very stringent and no effort is being spared in ensuring that
the JV obtains all the requisite certifications. Members will be happy to note
that the JV’s 220Kv range of power cables have already passed the Type Test
requirements and that the JV has secured certification from the Central Power
Research Institute (CPRI) – this will enable the JV to bid and compete in these
range of cables as well.
Corning Finolex Optical Fibre Private
Limited
Business
operations commenced during the last quarter of 2012-13. As mentioned earlier,
recent announcements by the government augur well for the Telecom sector and it
is expected that fiber sales will be robust in the current fiscal. It is
expected that 2013-14 will be a promising year for Optic Fibre
business and the JV expects to benefit from the same.
NEW PRODUCTS
The Company is
continuously looking at developing new products to expand its portfolio as well
as adapt to changing needs of the market. In the current fiscal, the Company
has already launched new lamp models including LED based lighting systems meant
for home use, street lighting and other commercial spaces. The Company has also
plans of entering the switchgear product segment and will launch a series of
products within the MCB, ELCB and MCCB range during 2013-14.
MANAGEMENT
DISCUSSION AND ANALYSIS
BUSINESS OF THE
COMPANY:
The Company
operates in two main segments - Electrical Cables and Communication Cables.
To support its
requirement of Copper Rods for both type of cables, the Company manufactures
Continuous Cast Copper Rods (CCC rods), at its Rod Plant at Goa.
A small part of this production of CCC rods is, however, sold to third party
customers. The result from this operation is declared under the Copper Segment.
The Company’s
foray into the Lamps and Electrical Switches businesses is still in its early
years and account for less than 5% of the Company’s turnover and are hence
reported as “Others” in the Segment Results.
Main Segments:
The Company is the
leading domestic manufacturer of electrical and communication cables with a
wide product range. The Company offers a ‘Total Cable Solution’. The broad
segmentation of the products manufactured by the Company is as follows:
|
Group |
Products Covered |
Application |
|
Electrical
Cables |
1100 V PVC
insulated cables |
Electrification
of industrial establishments, electrical panel wiring and consumer electrical
goods. |
|
Motor winding
PVC insulated cables and 3 core flat cables |
Submersible
pumps and electrical motors. |
|
|
Automotive/battery
cables |
Wiring harness
for automobile industry and battery cables for various applications |
|
|
UPS cables |
For providing
power from the UPS to the computer/ appliances in the networking environment. |
|
|
Heavy duty,
underground, low voltage, power and
control cables |
Connection to
the user point from main supply of power. |
|
|
Heavy duty,
underground, high voltage, power cables |
Intra-city power
distribution network |
|
|
Communication
Cables |
Jelly filled
telephone cables (JFTCs) |
Telephone line
connections to exchanges and users. |
|
Local area network
(LAN) cables |
Indoor and
outdoor networking, voice and data transmission, broadband usage. |
|
|
PE insulated
telephone cables (Switchboard cables) |
Telephone
instrument connections to EPABX. |
|
|
Coaxial cables |
Cable TV network
solutions, microwave communications, mobile towers. |
|
|
Speaker Cables |
Meant for
broadcasting applications in buildings. |
|
|
Optic fibre |
Principal raw
material for optic fibre cables. |
|
|
Optic fibre cables |
For use in
networks requiring high speed transfer of large
bandwidth due to voice, image and data transmission. |
|
|
V-SAT cables |
For connecting
V-SAT dish to base station. |
|
|
Copper Rods |
CCC rods of 8 mm
diameter |
Raw material for
manufacture of copper based cables. |
|
Electrical
Switches |
Premium and
classic switches, sockets, regulators, etc. |
Domestic
lighting, hotels, shops, offices, corridors. |
|
Lamps |
Retrofit and
non-retrofit CFL lamps as well as T5 Tube Lights and Fittings. |
Domestic
lighting, hotels, shops, offices, corridors. |
The Company’s
product application range is thus for electrical usage, transmission of voice,
data and images (contents) for domestic, commercial and industrial applications
to electrical products, touching every person in his daily life.
REVIEW OF
OPERATIONS:
·
Production:
- Electrical
Cables at 50,445 MT as compared to 45,348 MT in the previous year.
- Metal based
Communication Cables at 4,678 MT as compared to 4,276 MT in the previous year.
- Optical Fibre Cables at 49,080 KM as compared to 30,211 KM in the
previous year.
- Optic Fibre at 959,270 fibre kilometers
as compared to 273,130 fibre kilometers in the
previous year.
·
Sales:
- Electrical
Cables (including Excise Duty) at Rs.20858.000 millions as compared to
Rs.17705.000 millions in the previous year.
- Communication
cables (including Excise Duty) at Rs.1991.000 millions as compared to
Rs.1420.000 millions in the previous year.
- Copper Rods (net
of interdivisional transfers and including Excise Duty) at Rs.836.000 millions
as compared to Rs.2051.000 millions in the previous year.
·
Exports were marginally higher at Rs.496.000
millions as against Rs.489.000 millions of the earlier year.
·
The income from operations (including Excise Duty)
was Rs.24235.000 millions for the year as compared to Rs.21826.000 millions for
the earlier year.
·
The Joint Venture with J-Power Systems Corp of
Japan, Finolex J-Power Systems Private Limited,
continues on its journey to become the leading player in the country in the
Extra High Voltage Cable business. Product certifications were obtained during
the year for its 66Kv, 132Kv and 220Kv offerings. The JV also secured its first
large order worth Rs. 380 million recently. Supplies
of this prestigious order from Maharashtra State
Electricity Transmission Company will commence from October 2013. During the
year the JV supplied small quantities of 66Kv and 110Kv cables to its customers
including a breakthrough export order from Singapore for its power utility. All
these orders, though for small quantities will go a long way in establishing
the JV as a quality supplier in the region.
·
The Joint Venture with Corning SAS, Corning Finolex Optical Fibre Private
Limited commenced operations during the last quarter of 2012-13. Small
quantities of Optical Fibre were sold to other
merchant cablers within India.
BUSINESS
ENVIRONMENT:
The segment-wise
discussion on the markets which are served by the Company is as follows:
Electrical Cables:
Electrical cables
can be further categorised into light duty electrical
cables, power and control cables.
(i) Light duty electrical cables include electrical wires
used extensively for electrification of industrial establishments, electrical
panel wiring in industrial establishments and major equipments, consumer
durable goods, automobiles, agricultural pump sets, small generator
applications besides general lighting purposes.
(ii) In power
cable category, the Company has the ability to manufacture such cables within
the range 1.1 kV to 66 kV. These cables are high voltage cables designed in
various contructions depending upon their
applications; however, always meant for underground usage. Power and control
cables upto 3.3 kV rating are used for connecting
user point to the main supply of power. Power cables above 3.3 kV rating are
meant for use in underground application for intra-city electricity
distribution network. The Company manufactures insulated power cables only.
These cables meet the requirements of international standards.
Performance:
For the year, this
segment cables registered sales (including Excise Duty) of Rs.20858.000
millions against Rs.17705.000 millions of the previous year. It accounted for
87% of total sales for the year. Growth during the year was driven by
automobile, construction and agricultural applications. While the
infrastructure area remained very subdued (with the poor financial position of
the various power utilities as well as constraints faced by them in terms of
fuel availability), during the last quarter the automobile sector was also
under strain.
Outlook:
Electrical cables
are the main focus area of business for the Company. In the near term the
outlook is somewhat mixed – construction sector appears positive with
development seeming more broad based and consumption being reported from
interior areas of the Country rather than being limited to the larger cities;
agricultural applications also appear positive and poised to continue on the
growth shown in the previous years; automobile and infrastructure (power),
however seem to be going through a slower growth path at this moment. In the
long term, however, the outlook for the entire segment is positive, given the
fact that sustained economic growth of the country depends on a robust and
stable infrastructure.
The Company faces
two principal risks in this business – firstly competition from a large
unorganized sector which produces products of inferior quality but at cheap
prices and secondly a highly volatile commodity market where price movements
can be very sharp. The Company has been handling the risk of the competitive
forces through its organized business approach by the strength of its reach,
superior quality products, safe products and maintaining high standards of
service levels with its customers. The Company enjoys the advantages of
economies of scale and backward integration. As and when GST is rolled out in
the country, the Company believes the threat of a competitive force that relies
on cheap quality and unfair trade practices will reduce further. As regards the
risk of sharp raw material price movements, though the Company endeavors to
pass on the price effect to the customers, there has always been a time lag
between the price movement and the passing thereof. The Company negotiates
price variation contracts with bulk buyers. The Company has been fair in
dealing with its customers and accordingly enjoys customer confidence in
pricing decisions.
Communication
Cables:
The communication
cables comprise of state of art, new generation communication cables and
traditional telephone cables.
(i) The state of art communication cables are either copper
based or glass based. The copper based cables include LAN cables, coaxial
cables, PE insulated switchboard cables and V-SAT cables. These cables are used
for last mile connectivity. LAN cables are used in high speed networks, Coaxial
cables are used to provide content input to TV receiving sets and in microwave
communications and mobile towers, PE insulated switchboard cables are used to
connect telephone instruments to an EPABX system and V-SAT cables find their
application in V-SAT towers to connect the dish to the base station.
Optic fibre cables are glass based cables and they have the
maximum bandwidth and speed. Certain cable designs are used as trunk cables in
long distance networks while other designs are used in distribution, whether by
telecom companies, multi-service organisations or
other service providers.
Communication
cables which carry, voice data or images is the backbone of an economic
activity. The speed and bandwidth determine the capabilities of a communication
network.
(ii) Traditional
telephone cables include JFTCs which are laid
underground and are used for connecting land line telephones to exchanges.
These are copper based cables. With introduction of mobile telephones in India
and due to substitution by optic fibre cables, JFTC
business has lost its value. Nevertheless, JFTC continues to remain a preferred
option for last mile connectivity in fixed line telephones. The demand for JFTCs will continue to remain modest. The Company would
continue to manufacture JFTCs especially with
broadband features for public sector and private sector telecom companies and
to meet the export demand. The Company has the capability to make JFTCs as per customer’s needs.
Performance:
The communication
cables segment (including optic fibre) recorded sales
of Rs.1991.000 millions for the year against Rs.1420.000 millions for the
earlier year. The year has been a change from the past three years during which
period the telecom sector had been plagued by uncertainties. Some private
service providers commenced roll out of their 4G services which brought in
business opportunities. Also, the changeover to digital transmission in several
cities across the country resulted in additional demand for Coaxial cables.
With attractive price offerings and the past experience of better customer
service, this segment has showed an improved performance in the year. Capacity utilisation at all plants have shown improvement leading to
better margins and profitability.
Outlook:
With the impetus
from the Government in providing better and faster internet access to rural
India, the Company believes that demand for communication products will be
robust for the foreseeable future. The economic development requires inter-alia, a strong, dependable and sustainable communication
network. Besides the programs being implemented by the Government, roll out of
4G services by private service providers will entail additional capital
expenditure in the form of an optic fibre network.
The Company’s communication cables meet with the requirement of local as well
as international standards and therefore, find ready acceptance with domestic
customers as well as in the exports market. The outlook here, is positive, both
in the near as well as long term.
The risks of
competition and copper price movements similar to the electrical cables
business are also applicable to the business of communication cables. The
varying global demand-supply equation of optic fibre
and resultant price movement thereof; availability of preforms
and price thereof and delay/slow-down in investment into networks by telecom
companies/service provider and other relevant entities due to global slow-down
pose risk to the business of communication cables. The Company’s association
with Corning Inc of USA, inventor of glass fibre, one
of the world’s leading glass and fibre manufacturer
and having the largest market share in the world, would be beneficial in
meeting technological and market based challenges.
Copper Rods:
Copper rod is the
feed stock for copper based electrical and communications cables. The Company
manufactures its own copper rods. The base material for producing copper rods
is copper cathodes, the bulk of which are procured from local manufacturers
under long term supply agreements. A smaller portion of the requirement of
copper cathodes is imported as and when needed. After meeting the in-house
requirement of copper rods, the balance capacity to produce copper rods is
allocated for third party sale.
Performance:
The sales were
Rs.7,075 million (previous year Rs.9,504 million) of which Rs.836 million were
sales to third parties (previous year Rs.2,051 million) and balance was
inter-divisional transfers. With continued uncertainties in the global business
environment, commodity markets remained volatile through the year – prices ranged
from USD 8,300 at the beginning of the year before dropping to USD 7,000 levels
by the end of the year. Within the domestic market, the threat of imported
copper led to the domestic majors sharply dropping the premium on copper rods
from earlier levels, while increasing the premium levels on copper cathode.
This put severe pressure on margins related to sale of copper rods to third
party – consequently the Company restricted its sale of copper rods to already
committed contracts or contracts where the margin levels were acceptable.
Overall, therefore, there was a reduction in the throughput at the copper rod
segment.
Outlook:
The copper rod
production is mainly for in-house consumption. The Company’s steps to set up
new plants for cables as well as to expand the cable capacity at the existing
plants will boost up the captive consumption of copper rods. Further, since the
joint venture with J-Power Systems Corp. of Japan has commenced its operations,
the venture’s copper requirements would be met by the Company’s copper rod
plant. Accordingly the utilization of capacity at copper rod plant is expected
to improve in coming years.
Electrical
Switches and CFLs:
The manufacture
and sale of these electrical products act as a logical extension of the cables
business of the Company. They have the backing of Finolex
name, assuring the customer of quality, safety and performance standards. These
electrical and lighting products are sold through the existing well-spread
distribution network of cables. Other distribution avenues are also being
explored to penetrate further in the market. Products have been well accepted
by the market.
On its part to
contain the effects of global warming, the Government is promoting use of CFLs. Keeping in mind the expected growth in CFL demand the
Company has built capacity in T3 and T4 type CFLs and
has also launched the latest T5 tube lights and fittings in the market.
Both the above
products fared well during the year and grew by more than 100% in volume and
value terms. With improved distribution coverage, additions to product range
including LED applications for the home, business, commercial and industrial
usage being planned in the current fiscal, outlook in this area is very
positive.
CONTINGENT
LIABILITIES AND PROVISIONS (AS ON 31.03.2013):
a) Disputed
demands in appeal towards Excise Rs.201.500
millions (Previous year Rs.156.400 millions), Customs Rs.13.400 millions (Previous year
Rs.13.400 millions) and Sales Tax Rs.946.900
millions (Previous year Rs.599.000 millions).
b) i) Disputed Income Tax demands and matters in Appellate
proceedings Rs.497.900 millions (Previous
year Rs.424.900 millions).
ii) Appeals
preferred by Income Tax Department against Appellate decisions in favour of the Company, wherein, should the ultimate
decision be unfavourable to the Company, the
liability is estimated to be Rs.524.400
millions (Previous year Rs.485.600 millions).
c) Guarantees
given by Company’s Bankers on behalf of the Company, towards performance and
other matters, amounting to Rs.573.800
millions (Previous year Rs.474.300 millions), are secured by
hypothecation of Stock in trade, Book Debts, Stores and Spares etc. The Company
has also given margin deposits of Rs.75.000
millions (Previous year Rs.75.000 millions) against above guarantee.
d) The Company has
imported capital goods under the Export Promotion Capital Goods (EPCG) scheme,
of the Government of India, at concessional rates of
duty on an understanding to fulfill quantified exports against which future
obligation aggregates to Rs.1474.000
millions (Previous year Rs.1381.400 millions) over a period of six /
eight years from the date of license.
e) Amounts claimed
by Banks in respect of derivative transactions which are under dispute not
acknowledged as debts Rs.170.900
millions (Previous year Rs.170.900 millions).
f) Provision for
derivatives transactions:
Provision for
derivatives as at the year end is Rs.525.200 millions (Previous year Rs.342.100
millions) including provided during the year of Rs.233.900 millions (Previous
year Rs.92.600 millions) and is net of payments of Rs.
NIL million (Previous year Rs.312.200 millions).
AUDITED FINANCIAL RESULTS FOR THE
QUARTER AND THE YEAR ENDED 31ST MARCH, 2014
(Rs in millions)
|
Particulars |
Quarter ended |
Current year ended |
||
|
31.03.2014 |
31.12.2013 |
31.03.2014 |
||
|
(Audited)# |
(Unaudited) |
(Audited) |
||
|
1. Income from Operations |
|
|
|
|
|
a) Net Sales / Income from Operations (Net of excise duty) |
6424.900 |
5575.500 |
23366.700 |
|
|
b) Other Operating Income |
65.600 |
55.500 |
223.700 |
|
|
Total income from
Operations (Net) |
6490.500 |
5631.000 |
23590.400 |
|
|
2. Expenses |
|
|
|
|
|
a)
Cost of Materials Consumed |
4830.900 |
3783.900 |
17759.300 |
|
|
b)
Purchases of Stock in Trade |
38.600 |
33.600 |
112.100 |
|
|
c)
Change in Inventories of finished goods,
WIP & Stock in trade (increase) |
(117.900) |
640.100 |
(215.300) |
|
|
d)
(Increase) / Decrease In Excise Duty On
Closing Stock of Finished Goods |
(22.300) |
(58.500) |
(13.100) |
|
|
e)
Employee Benefit Expenses |
205.100 |
213.300 |
848.300 |
|
|
f)
Depreciation, Amortisation & Impairment |
122.400 |
126.700 |
484.300 |
|
|
g)
Other Expenses |
355.100 |
116.300 |
813.700 |
|
|
h)
Power & Fuel |
96.000 |
78.300 |
370.700 |
|
|
i)
Sales & Distribution Expenses |
354.400 |
381.000 |
1443.600 |
|
|
Total Expenses |
5862.300 |
5314.700 |
21603.600 |
|
|
3. Profit from Operations before other income, finance costs, prior period adjustments and exceptional items (1-2) |
628.200 |
316.300 |
1986.800 |
|
|
4. Other Income |
60.500 |
34.700 |
483.500 |
|
|
5. Profit from ordinary activities before finance costs, prior period adjustments and exceptional items (3+4) |
688.700 |
351.000 |
2470.300 |
|
|
6. Finance costs |
30.800 |
34.900 |
134.000 |
|
|
7. Profit from ordinary activities after finance costs but before prior period adjustments and exceptional items (5-6) |
657.900 |
316.100 |
2336.300 |
|
|
8. Exceptional Items – Income/ (Expenses) |
-- |
0.000 |
103.800 |
|
|
9. Profit from ordinary activities before Tax (7+8) |
657.900 |
316.100 |
2440.100 |
|
|
10. Tax Expenses |
(35.200) |
71.400 |
363.300 |
|
|
11. Net Profit from ordinary activities after tax (9-10) |
693.100 |
244.700 |
2076.800 |
|
|
12. Extraordinary Items (net of tax expenses) |
-- |
-- |
-- |
|
|
13. Net Profit for the period (11-12) |
693.100 |
244.700 |
2076.800 |
|
|
14. Paid up Equity Share Capital |
305.900 |
305.900 |
305.900 |
|
|
15. Paid up Debt Capital |
500.000 |
500.000 |
500.000 |
|
|
16. Reserves excluding Revaluation Reserve as per balance sheet of previous accounting year |
10727.800 |
10076.300 |
10727.800 |
|
|
17. Debenture Redemption Reserve |
-- |
-- |
250.000 |
|
|
18. Earnings per
share (before and after extraordinary items) (of Rs.2/- each) (not annuaiised): |
|
|
|
|
|
(a) Basic |
4.50 |
1.60 |
13.60 |
|
|
(b) Diluted |
4.50 |
1.60 |
13.60 |
|
|
19. Debt Equity Ratio* |
-- |
-- |
0.13 |
|
|
20. Debt Service Coverage
Ratio** |
-- |
-- |
7.63 |
|
|
21. Interest Service Coverage
Ratio*** |
-- |
-- |
19.21 |
|
|
|
|
|
|
|
|
* Debt Equity Ratio :
Long Term Borrowing + Short Term Borrowing + Current maturity of Long Term
Borrowing/ Shareholders Fund ** Debt Service Coverage
Ratio : PBIT/ Finance Cost + Current maturity of Long Term Borrowing *** Interest Service Coverage Ratio : PBIT/ Finance Cost |
||||
|
|
|
|
|
|
|
PART II |
|
|
|
|
|
A. PARTICULARS OF
SHAREHOLDING |
|
|
|
|
|
1. Public
Shareholding* |
|
|
|
|
|
- Number of shares |
98097875 |
98210875 |
98097875 |
|
|
- Percentage of shareholding |
64.14% |
64.22% |
64.14% |
|
|
2. Promoters and
Promoter Group Shareholding |
|
|
|
|
|
(a) Pledged/
Encumbered |
|
|
|
|
|
- Number of Shares |
Nil |
Nil |
Nil |
|
|
- Percentage of shares (as % of the total shareholding of promoter and promoter group) |
NA |
NA |
NA |
|
|
- Percentage of shares (as % of the total share capital of the company) |
NA |
NA |
NA |
|
|
(b) Non-encumbered |
|
|
|
|
|
- Number of Shares |
54841470 |
54728470 |
54841470 |
|
|
- Percentage of shares (as% of the total shareholding of promoter and promoter group) |
100.00% |
100.00% |
100.00% |
|
|
- Percentage of shares (as % of the total share capital of the company) |
35.86% |
35.78% |
35.86% |
|
* Includes 22187075 shares
(14.51%) held by Associate Company - Finolex
Industries Limited
|
Particulars |
Quarter ended 31.03.2014 |
|
|
B |
INVESTOR COMPLAINTS |
|
|
|
Pending at the beginning of the quarter |
Nil |
|
|
Received during the quarter |
2 |
|
|
Disposed of during the quarter |
2 |
|
|
Remaining unresolved at the end of the quarter |
Nil |
SEGMENT WISE REVENUE,
RESULTS AND CAPITAL EMPLOYED, AS PER CLAUSE 41 OF THE LISTING AGREEMENT
(Rs in millions)
|
Particulars |
Quarter ended |
Current year ended |
||
|
31.03.2014 |
31.12.2013 |
31.03.2014 |
||
|
(Audited)# |
(Unaudited) |
(Audited) |
||
|
1. Segment Revenue
including Other income |
|
|
|
|
|
a.
Electric Cables |
5633.100 |
4699.500 |
20160.100 |
|
|
b.
Communication Cables |
670.200 |
398.400 |
2073.400 |
|
|
c.
Copper Rods |
1420.600 |
1668.000 |
6884.600 |
|
|
d.
Others |
986.800 |
453.900 |
2758.600 |
|
|
Total |
8710.700 |
7219.800 |
31876.700 |
|
|
|
|
|
|
|
|
Less: Inter Segment Revenue |
2220.200 |
1588.800 |
8286.300 |
|
|
|
|
|
|
|
|
Net sales/income from Operations |
6490.500 |
5631.000 |
23590.400 |
|
|
|
|
|
|
|
|
2. Segment Results |
|
|
|
|
|
Profit Before
Interest and Tax |
|
|
|
|
|
Profit (+) / Loss
(-): |
|
|
|
|
|
a.
Electric Cables |
843.300 |
444.800 |
2576.300 |
|
|
b.
Communication Cables |
113.100 |
31.900 |
285.400 |
|
|
c.
Copper Rods |
(1.600) |
13.000 |
22.000 |
|
|
d.
Others |
(14.300) |
(18.700) |
(65.000) |
|
|
Total Profit Before
Interest and Tax |
940.500 |
471.000 |
2818.700 |
|
|
Less : |
|
|
|
|
|
interest |
30.800 |
34.900 |
134.000 |
|
|
Other unallocated expenditure net of unallocated income |
251.800 |
120.000 |
244.600 |
|
|
|
|
|
|
|
|
Total Profit before
Tax |
657.900 |
316.100 |
2440.100 |
|
|
|
|
|
|
|
|
3. Capital Employed (Segment Assets - Segment
Liabilities) |
|
|
|
|
|
a.
Electric Cables |
5379.200 |
5494.400 |
5379.200 |
|
|
b.
Communication Cables |
2015.900 |
1981.800 |
2015.900 |
|
|
c.
Copper Rods |
275.800 |
348.000 |
275.800 |
|
|
d.
Others |
860.600 |
566.000 |
860.600 |
|
|
e.
Other than Segments |
7108.200 |
6547.900 |
7108.200 |
|
|
Total Capital
Employed |
15639.700 |
14938.100 |
15639.700 |
|
STANDALONE / CONSOLIDATED
STATEMENT OF ASSETS AND LIABILITIES
(Rs in millions)
|
SOURCES OF FUNDS |
31.03.2014 (Audited) |
|
I.
EQUITY AND LIABILITIES |
|
|
(1) Shareholders' Funds |
|
|
(a) Share Capital |
305.900 |
|
(b) Reserves & Surplus |
10727.800 |
|
|
|
|
Total Shareholders’
Funds |
11033.700 |
|
|
|
|
(2) Non-Current
Liabilities |
|
|
(a) Long-term borrowings |
1266.900 |
|
(b) Deferred tax liabilities (Net) |
295.200 |
|
(c) Other long
term liabilities |
17.900 |
|
(d) Long-term
provisions |
35.300 |
|
Total Non-current
Liabilities |
1615.300 |
|
|
|
|
(3) Current Liabilities |
|
|
(a)
Short term borrowings |
0.000 |
|
(b)
Trade payables |
526.800
|
|
(c)
Other current liabilities |
1590.400
|
|
(d) Short-term
provisions |
873.500
|
|
Total Current
Liabilities |
2990.700 |
|
|
|
|
TOTAL |
15639.700 |
|
|
|
|
II.
ASSETS |
|
|
(1) Non-current assets |
|
|
(a)
Fixed Assets |
5065.400 |
|
(b) Non-current Investments |
2260.800 |
|
(c) Long-term Loan and Advances |
47.700 |
|
(d) Other
Non-current assets |
264.900 |
|
Total Non-Current
Assets |
7638.800 |
|
|
|
|
(2) Current assets |
|
|
(a)
Current investments |
1770.600 |
|
(b)
Inventories |
3524.000
|
|
(c)
Trade receivables |
1451.700
|
|
(d) Cash
and cash equivalents |
648.600
|
|
(e)
Short-term loans and advances |
605.100
|
|
(f)
Other current assets |
0.900
|
|
Total
Current Assets |
8000.900 |
|
|
|
|
TOTAL |
15639.700 |
1. Exceptional items for the year ended March 31, 2014
represent gains on account of settlement of claims in respect of foreign
exchange derivative transactions of the earlier years.
(Exceptional items for previous periods indicate losses
on account of foreign exchange derivative transactions.)
2. In line with the provisions of AS11 read with
circulars and clarifications issued by Ministry of Corporate Affairs, the
Company has adjusted foreign exchange gain of Rs.5.800 millions for the quarter
and foreign exchange loss of Rs.46.100 millions for the year ended March 31,
2014 (foreign exchange gain of Rs.4.700 millions for the quarter and foreign
exchange loss of Rs.35.200 millions for the year ended March 31, 2013) on
revaluation of foreign currency loan against the value of fixed assets
purchased out of such loan.
3. The operations of the Company's long term and
strategic investment in a joint venture, Finolex
J-Power Systems Limited ("the JV) have been impacted by economic slow-down
and the JVs net worth is partially eroded. Management along with the JV
partner, continues to support the JVs operations and expects improvement in JVs
operations upon revival of the economic environment. Having regard to the
uncertainty in timing of economic revival, a provision of Rs.73.700 millions
has been made on prudent basis towards diminution in the value of investments
for the quarter and year ended March 31, 2014.
4. The above financial results have been audited by the
Company's Statutory Auditors, reviewed by the Audit Committee and taken on
record by the Board of Directors at its meeting held on May 08, 2014.
5. The Board of Directors have recommended a dividend
of Rs.1.60 Per Equity Share of Face value of Rs.2 each.
6. # The figures of the last quarters of the
year ended March 14 and March 13 are the balancing figures between the audited
figures in respect of the full financial year and the published year to date
figures of the third quarter of the respective financial year.
7. Previous period's figures have been regrouped
wherever necessary to conform to the current period's classification.
FIXED ASSETS:
Tangible Assets
· Land
· Lease Hold Land
· Buildings
· Plant and Machinery
· Furniture, Fittings
· Office Equipments
· Computer Peripherals
· Vehicles
· Dies and Moulds
Intangible
Assets
· Software and Others
WEBSITE DETAILS:
NEWS:
FINOLEX CABLES LTD RESULTS
·
Sales up 4% in the year as compared to the previous year.
·
PBT up 43% in the year as compared to the previous year.
·
PAT up by 43% in the year as compared to the previous year.
Pune, May 8th, 2014
Finolex Cables Limited, (FCL) at
the meeting of its Board of Directors held today approved results for the
fourth quarter and year ended March 31st, 2014.
Net Sales for the quarter
ended March 31st 2014 were Rs.6424.900 millions as against
Rs.6254.400 millions for the corresponding period in year 2012-13. Net Sales in
the current quarter shows an increase of 3% compared to the corresponding
period of the previous year. Profit for the quarter, before taxes, increased to
Rs.657.900 millions from Rs.461.700 millions in the previous year - an increase
of 43%.
Net sales for the year
2013-14 stood at Rs.23366.700 millions as against Rs.22438.400 millions for the
year 2012-13, registering an increase of 4% over previous year. Profit for the
year 2013-14 after taxes, increased to Rs.2076.800 millions as compared to
Rs.1452.700 millions for the year 2012-2013 registering a growth of 43%.
As planned, the captive
solar power plant of 5MW capacity was commissioned in March 2014. The plant was
constructed at a cost of Rs.385.000 millions.
The Board of Directors has
recommended a dividend of 80% for the year 2013-14.
ABOUT FCL
Finolex Cables Limited is India's
largest and leading manufacturer of Electrical and Communication cables. Finolex offers a wide range of Electrical and Communication
cables. Its wire and cable products are used in applications such as
automobile, lighting, cable TV, telephone and computers to industrial
applications touching every person in his daily life. Finolex
has added Electrical Switches and Compact Flourescent
Lamps (CFL) to its range of products.
FINANCIAL
HIGHLIGHTS:
(Rs. in millions)
|
|
Quarter
Ended 31.03.2014 |
Quarter
Ended 31.03.2013 |
Year
Ended 31.03.2014 |
Year
Ended 31.03.2013 |
|
Net Sales/ Income from
Operations |
6490.500 |
6321.300 |
23590.400 |
22706.800 |
|
Other Income |
60.500 |
66.100 |
483.500 |
241.700 |
|
Profit before Exceptional
item, Interest, Depreciation and Tax |
811.100 |
730.800 |
2954.600 |
2529.100 |
|
|
|
|
|
|
|
Deductions for: |
|
|
|
|
|
·
Exceptional Item |
-- |
80.200 |
(103.800) |
230.100 |
|
·
Interest |
30.800 |
42.000 |
134.000 |
124.600 |
|
·
Depreciation |
122.400 |
146.900 |
484.300 |
466.300 |
|
|
|
|
|
|
|
Profit before Taxation |
657.900 |
461.700 |
2440.100 |
1708.100 |
|
Tax Expenses |
35.200 |
(74.200) |
(363.300) |
(255.400) |
|
Profit After Tax |
693.100 |
387.500 |
2076.800 |
1452.700 |
FINOLEX CABLES TO SET UP SOLAR POWER PLANT NEAR
PUNE
February 14, 2013
![]()
PUNE: A captive 5
MW solar power plant will soon be set up by Finolex Cables Limited at its manufacturing facility at Urse near Pune with an estimated
investment of Rs.400.000 millions.
The proposed plant, expected to be commissioned within six months, will provide
electricity for the internal consumption of the Urse
facility, which would be pooled with additional State Electricity Board
(MSEDCL) supply for night time operations.
"With this
in-house experience (setting up of captive solar power plant) we can go ahead
and set up larger projects in future," company's Managing Director Deepak Chhabria told PTI, after the Finolex
Cables' Board meeting which approved the third quarter results yesterday.
Referring to the
company's future plans, Chhabria said there was good
scope for growth in the fibre optic business as the
new government initiated projects were expected to spur the demand in the
sector.
"There are
bright prospects for the segment growth in view of the government projects
which envisage laying down of total underground network to be installed and
handed over to the Defence services with an estimated
investment of Rs.80000.000 millions to 100000.000 millions," he said.
"Tenders are
already floated for these projects," Chhabria
added.
While noting that
the fibre optic sector was poised for significant
growth, he said that as a country "we need to spend more on infrastructure
to expand the industry."
Articulating the
company philosophy, he said, "We are reinventing ourselves in large
product portfolio in various segments. If you are diversified, you are better
equipped."
He said the
company aimed at being "one-stop-shop" for any cabling need with
concentration of quality.
In reply to a
question, Chhabria said if the government introduced
uniform Goods and Service Tax ( GST), it will help the industry with improved
sales.
Finolex Cables
Limited is considered India's largest and leading manufacturer of electrical
and communication cables who have also added electrical switches and Compact
Fluorescent Lamps (CFL) to its range of products.
MULTIBAGGER: IFCI SEES 60% UPSIDE IN FINOLEX
CABLES, EXPECTS RE-RATING
October 1, 2012
NEW DELHI: Finolex Cables Limited (FCL),
the manufacturer of electrical and telecommunication cables, is set to report
$1bn revenue by FY15 on account of robust balance sheet as well as backward and
steady improvement in other business segments, IFCI said in a report on Monday
.
IFCI Financial Services, a
subsidiary of IFCI Limited, initiated coverage on the stock with a 'buy' rating and a target price of
Rs 68 per share, translating into an upside of about
60% from the current levels.
IFCI expects the
stock to get re-rated supported by robust fundamental factors and capital
expenditure plans. "The stage is set for FCL to meet the incremental
demand for the next four years, with the capex of
Rs3.9 billion incurred at ten manufacturing facilities in the last five
years," IFCI said in a report.
"Also, the
company is realigning capacities and is likely to incur a capex
of Rs800mn in FY13 and FY14, which will decrease tax expense and improve
production efficiency," the report added.
The government's
impetus towards infrastructure sector, growth visibility for the next couple of
years remains buoyant. IFCI expects the throughput for electrical cables (82%
of total revenue in FY12) to increase from 35,000MT to 45,000MT by FY15 and
expects the company to report $1bn topline by FY15.
Another reason
why IFCI thinks that Finolex scores above its peers
is owning to its 'Superbrand' status, strong
distribution network, and over 20,000 dealers spread across the country.
Improvement in other business segment:
FCL has invested
Rs480.2 million and has 49 per cent share in JV with J-Power systems of Japan.
The JV is operational since September 2011 and is likely to generate Rs5-6
billion of revenue for the JV company in the next five years, according to IFCI
analysis.
In another
marketing JV with Cornings of USA in which FCL has
invested Rs0.5mn will market optic fiber to cable manufacturers in India.
Normally, FCL sells only 10-20 per cent of copper produced and the balance
being used for in house consumption.
IFCI expects
steady improvement for communication cable and other segments (CFL and
electrical switches segments) and estimates a growth of 2-10 per cent in FY13.
Key downside risks to the rally
IFCI is of the
view that a spike in copper price, which accounts for nearly 65 per cent of the
product price, likely to weigh on margins. However, Finolex
Cables is buying raw materials in local currency without exposure to derivative
contracts.
However, the
company generally passes on increase in the product price to customers. Also,
to mitigate the risk of time lag, FCL purchases copper on monthly average
price.
HEARD ON THE STREET: FINOLEX SURGES ON HITACHI
CABLES STAKE-BUY BUZZ
June 19, 2012
Finolex Cables shares surged
4.4% on Monday on buzz that Japan-based Hitachi Cables was planning to purchase a stake in the
company.
Market sources
said Hitachi was planning to buy around 15% stake in the Pune-based
electrical products maker. An email query to Finolex
did not elicit a response till the time of going to print.
Amid high
volumes, Finolex shares climbed to a month's high to
Rs.43.95 on BSE, before closing at Rs.42.5. Over 5 lakh shares
were traded on the bourse against a two-week average volume of 35,000 shares.
CMT REPORT (Corruption, Money Laundering & Terrorism]
The Public Notice information has been collected from various sources
including but not limited to: The Courts,
1] INFORMATION ON
DESIGNATED PARTY
No exist designating subject or any of its beneficial owners,
controlling shareholders or senior officers as terrorist or terrorist
organization or whom notice had been received that all financial transactions
involving their assets have been blocked or convicted, found guilty or against
whom a judgement or order had been entered in a
proceedings for violating money-laundering, anti-corruption or bribery or
international economic or anti-terrorism sanction laws or whose assets were
seized, blocked, frozen or ordered forfeited for violation of money laundering
or international anti-terrorism laws.
2] Court Declaration :
No exist to suggest that subject is or was
the subject of any formal or informal allegations, prosecutions or other
official proceeding for making any prohibited payments or other improper
payments to government officials for engaging in prohibited transactions or
with designated parties.
3] Asset Declaration :
No records exist to suggest that the property or assets of the subject
are derived from criminal conduct or a prohibited transaction.
4] Record on Financial
Crime :
Charges or conviction
registered against subject: None
5] Records on Violation of
Anti-Corruption Laws :
Charges or investigation
registered against subject: None
6] Records on Int’l
Anti-Money Laundering Laws/Standards :
Charges or
investigation registered against subject: None
7] Criminal Records
No
available information exist that suggest that subject or any of its principals
have been formally charged or convicted by a competent governmental authority
for any financial crime or under any formal investigation by a competent
government authority for any violation of anti-corruption laws or international
anti-money laundering laws or standard.
8] Affiliation with
Government :
No record
exists to suggest that any director or indirect owners, controlling
shareholders, director, officer or employee of the company is a government
official or a family member or close business associate of a Government
official.
9] Compensation Package :
Our market
survey revealed that the amount of compensation sought by the subject is fair
and reasonable and comparable to compensation paid to others for similar
services.
10] Press Report :
No press reports / filings exists on
the subject.
CORPORATE GOVERNANCE
MIRA INFORM as part of its Due Diligence do provide comments on
Corporate Governance to identify management and governance. These factors often
have been predictive and in some cases have created vulnerabilities to credit
deterioration.
Our Governance Assessment focuses principally on the interactions
between a company’s management, its Board of Directors, Shareholders and other
financial stakeholders.
CONTRAVENTION
Subject is not known to have contravened any existing local laws,
regulations or policies that prohibit, restrict or otherwise affect the terms
and conditions that could be included in the agreement with the subject.
FOREIGN EXCHANGE RATES
|
Currency |
Unit
|
Indian Rupees |
|
US Dollar |
1 |
Rs.60.09 |
|
|
1 |
Rs.102.33 |
|
Euro |
1 |
Rs.82.01 |
INFORMATION DETAILS
|
Information
Gathered by : |
HNA |
|
|
|
|
Analysis Done by
: |
RAS |
|
|
|
|
Report Prepared
by : |
SMN |
SCORE & RATING EXPLANATIONS
|
SCORE FACTORS |
RANGE |
POINTS |
|
HISTORY |
1~10 |
8 |
|
PAID-UP CAPITAL |
1~10 |
7 |
|
OPERATING SCALE |
1~10 |
8 |
|
FINANCIAL CONDITION |
|
|
|
--BUSINESS SCALE |
1~10 |
8 |
|
--PROFITABILIRY |
1~10 |
8 |
|
--LIQUIDITY |
1~10 |
7 |
|
--LEVERAGE |
1~10 |
7 |
|
--RESERVES |
1~10 |
7 |
|
--CREDIT LINES |
1~10 |
7 |
|
--MARGINS |
-5~5 |
- |
|
DEMERIT POINTS |
|
|
|
--BANK CHARGES |
YES/NO |
YES |
|
--LITIGATION |
YES/NO |
YES |
|
--OTHER ADVERSE INFORMATION |
YES/NO |
NO |
|
MERIT POINTS |
|
|
|
--SOLE DISTRIBUTORSHIP |
YES/NO |
NO |
|
--EXPORT ACTIVITIES |
YES/NO |
NO |
|
--AFFILIATION |
YES/NO |
YES |
|
--LISTED |
YES/NO |
YES |
|
--OTHER MERIT FACTORS |
YES/NO |
YES |
|
DEFAULTER |
|
|
|
--RBI |
YES/NO |
NO |
|
--EPF |
YES/NO |
NO |
|
TOTAL |
|
67 |
This score serves as a reference to assess SC’s credit risk
and to set the amount of credit to be extended. It is calculated from a
composite of weighted scores obtained from each of the major sections of this
report. The assessed factors and their relative weights (as indicated through
%) are as follows:
Financial
condition (40%) Ownership
background (20%) Payment
record (10%)
Credit history
(10%) Market trend
(10%) Operational
size (10%)
RATING EXPLANATIONS
|
RATING |
STATUS |
PROPOSED CREDIT LINE |
|
|
>86 |
Aaa |
Possesses an extremely sound financial base with the strongest
capability for timely payment of interest and principal sums |
Unlimited |
|
71-85 |
Aa |
Possesses adequate working capital. No caution needed for credit
transaction. It has above average (strong) capability for payment of interest
and principal sums |
Large |
|
56-70 |
A |
Financial & operational base are regarded healthy. General unfavourable factors will not cause fatal effect.
Satisfactory capability for payment of interest and principal sums |
Fairly Large |
|
41-55 |
Ba |
Overall operation is considered normal. Capable to meet normal
commitments. |
Satisfactory |
|
26-40 |
B |
Capability to overcome financial difficulties seems comparatively
below average. |
Small |
|
11-25 |
Ca |
Adverse factors are apparent. Repayment of interest and principal sums
in default or expected to be in default upon maturity |
Limited with full
security |
|
<10 |
C |
Absolute credit risk exists. Caution needed to be exercised |
Credit not
recommended |
|
-- |
NB |
New Business |
-- |
This report is issued at your request without any
risk and responsibility on the part of MIRA INFORM PRIVATE LIMITED (MIPL) or
its officials.