MIRA
INFORM REPORT
|
Report Date : |
10.07.2014 |
IDENTIFICATION DETAILS
|
Name : |
PIDILITE INDUSTRIES LIMITED |
|
|
|
|
Registered
Office : |
Regent Chambers, 7th Floor, 208, Nariman Point Mumbai – 400021,
|
|
|
|
|
Country : |
|
|
|
|
|
Financials (as
on) : |
31.03.2013 |
|
|
|
|
Date of
Incorporation : |
28.07.1969 |
|
|
|
|
Com. Reg. No.: |
11-014336 |
|
|
|
|
Capital
Investment / Paid-up Capital : |
Rs.512.640 Millions |
|
|
|
|
CIN No.: [Company Identification
No.] |
L24100MH1969PLC014336 |
|
|
|
|
TAN No.: [Tax Deduction &
Collection Account No.] |
MUMP06924B MUMP12411A |
|
|
|
|
Legal Form : |
A Public Limited Liability Company. The Company’s shares are listed on
Stock Exchange. |
|
|
|
|
Line of Business
: |
Manufacturing of
Adhesives, Sealants, Art Material and Construction Paint and Chemical
Products. |
|
|
|
|
No. of Employees
: |
4223 [Approximately] |
RATING & COMMENTS
|
MIRA’s Rating : |
Aa (72) |
|
RATING |
STATUS |
PROPOSED CREDIT LINE |
|
|
71-85 |
Aa |
Possesses adequate working capital. No caution needed for credit
transaction. It has above average (strong) capability for payment of interest
and principal sums |
Large |
|
Maximum Credit Limit : |
USD 69200000 |
|
|
|
|
Status : |
Good |
|
|
|
|
Payment Behaviour : |
Regular |
|
|
|
|
Litigation : |
Exist |
|
|
|
|
Comments : |
Subject is an
established company having fine track. Financial position
of the company is sound and healthy. Net worth of the company is strong. No
borrowings recorded by the company. Trade relations
are reported to be fair. Business is active. Payments are reported to be
regular and as per commitment. The company can
be considered good for normal business dealings at usual trade terms and
conditions. |
NOTES:
Any query related to this report can be made
on e-mail : infodept@mirainform.com
while quoting report number, name and date.
INDIAN ECONOMIC OVERVIEW
US investment bank
Goldman Sachs has upgraded its outlook on Indian markets as it expects positive
impact of the election cycle.
India’s economy may
grow 4.7 % in the current financial year, lower than the official estimate of
4.9 %, Fitch Rating said. The global rating agency expects the economy to pick
up in the next two financial years.
Global ratings
agency Standard & Poor said increasing focus by India Inc on lowering debt is
likely to improve their credit profiles.
Singapore (1.1
million Indian tourists in 2012), Thailand (one million), the United Arab
Emirates ().98 million) and Malaysia ().82 million) emerged as the preferred
holidays hotspots for Indians. The total figure is expected to increase to 1.93
million by 2017, according to the latest Eurmonitor international report.
There is a $29.34 bn
outward foreign direct investment by domestic companies between April and
January of 2013/14 which has seen some signs of recovery according to a Care
Ratings report.
There are 264 number
of new companies being set up every day on average during 2014. Most of them
are registered in Mumbai. India had 1.38 million registered companies at the
end of January, 2014.
Twitter like messaging
service Weibo Corporation has filed to raise $ 500 million via a US initial
public offering. Alibaba, which owns a stake in Weibo is expected to raise
about $ 15 billion New York this year in the highest profile Internet IPO since
Facebook’s in 2012.
Bharti Airtel has
raised Rs.2,453.2 crore (350 million Swiss Francs) by selling six-year bonds at
a coupon rate of three per cent and maturing in 2020. This is the largest ever
bond offering by an Indian company in Swiss Francs. Bharat Petroleum Corporation
raised 175 million Swiss Francs by selling five year bonds at 2.98 % coupon
rate in February.
Indian Oil
Corporation plans to invest Rs.7650 crore in setting up a petrochemical complex
at its almost complete Paradip refinery in Odhisha in three to four years. The
company board is set to consider the setting up of a 700000 tonne per annum
polypropylene plant at an estimated cost at Rs.3150 crore.
Global chief
information officers at gathering in Bangalore in April to meet Indian startups
at an event called Tech50 Watchout for Little Eye Labs-Facebook type deals in
the making.
EXTERNAL AGENCY RATING
|
Rating Agency Name |
CRISIL |
|
Rating |
Long Term Rating: AA+ |
|
Rating Explanation |
High degree of safety and very low credit
risk. |
|
Date |
28.04.2014 |
|
Rating Agency Name |
CRISIL |
|
Rating |
Short Term Rating A1+ |
|
Rating Explanation |
Very strong degree of safety and carry
lowest credit risk. |
|
Date |
28.04.2014 |
RBI DEFAULTERS’ LIST STATUS
Subject’s name is not enlisted as a defaulter
in the publicly available RBI Defaulters’ list.
EPF (Employee Provident Fund) DEFAULTERS’ LIST STATUS
Subject’s name is not enlisted as a defaulter
in the publicly available EPF (Employee Provident Fund) Defaulters’ list as of
31-03-2012.
INFORMATION DECLINED
MANAGEMENT NON CO-OPERATIVE
Contact No.: 91-22-22822708/
LOCATIONS
|
Registered
Office : |
Regent Chambers,
7th Floor, 208, Nariman Point, Mumbai-400021, Maharashtra, India |
|
Tel. No.: |
91-22-22822708 /
28367085 / 7089 |
|
Fax No.: |
91-22-22043969 |
|
E-Mail : |
|
|
Website : |
|
|
|
|
|
Administrative
Office: |
6th Floor, Vikas Deep, Laxmi Nagar, District Centre, Vikas
Marg, |
|
|
|
|
Corporate /
Head office: |
Ramkrishna Mandir
Road, Office Mathuradas Vasanji Road, Andheri (East), Mumbai – 4000059,
Maharashtra, India |
|
Tel. No.: |
91-22-28357000 / 3083
1000, 91-22-67697000/7949 |
|
Fax No.: |
91-22-28357008 / 2835
7700, 91-22-28216007 |
|
E-Mail : |
|
|
|
|
|
Factory : |
·
Plot No.
A-22, M. I. D. C. Mahad - 402309, District Raigad, Maharashtra, India Tel. No. 91-2145-232043/44/45/46 Fax. No. 91-2145-232054/232048 ·
Plot
No. 78-79, G. I. D. C. Industrial Estate, Vapi - 396 195, District Valsad,
Gujarat, India Tel. No. 91-2638-230215/230521 Fax. No. 91-2638-230199 ·
Plot
No. 23, G. I. D. C. Industrial Estate, Vapi 396 195, District Valsad,
Gujarat, India Tel. No. 91-2638-230520/231517 Fax. No. 91-2638-231085 ·
Plot
No. 25,26,39,40 Jawahar Co-operative Industrial Estate, Kamothe, Panvel -
410206, District Raigad, Maharashtra, India Tel. No. 91-22-27421021/27421856 Fax. No. 91-22-2742332 ·
Plot
No. 19, Taloja Industrial Estate, Taloja, District Raigad, Maharashtra, India Tel. No. 91-22-27410376/77 Fax. No. 91-22-27410376 ·
Daman,
Union Territory |
|
|
|
|
Branch Office
: |
Located
At: ·
Ahmedabad ·
Bangalore ·
Chandigarh ·
Chennai ·
New Delhi ·
Kanpur ·
Kolkata ·
Nagpur ·
Kochi ·
Hyderabad |
DIRECTORS
AS ON 31.03.2013
|
Name : |
Mr. B. K. Parekh |
|
Designation : |
Chairman |
|
|
|
|
Name : |
Mr. S. K. Parekh |
|
Designation : |
Vice Chairman |
|
|
|
|
Name : |
Mr. M. B. Parekh |
|
Designation : |
Chairman cum Managing Director |
|
|
|
|
Name : |
Mr. N. K. Parekh |
|
Designation : |
Joint Managing Director |
|
|
|
|
Name : |
Mr. R. M. Gandhi |
|
Designation : |
Director |
|
|
|
|
Name : |
Mr. N. J. Jhaveri |
|
Designation : |
Director |
|
|
|
|
Name : |
Mr. Bansi S.
Mehta |
|
Designation : |
Director |
|
|
|
|
Name : |
Mr. Ranjan Kapur |
|
Designation : |
Director |
|
|
|
|
Name : |
Mr. Yash Mahajan |
|
Designation : |
Director |
|
|
|
|
Name : |
Mr. A. B. Parekh |
|
Designation : |
Whole Time Director |
|
|
|
|
Name : |
Mr. A N Parekh |
|
Designation : |
Whole Time Director |
|
|
|
|
Name : |
Mr. Bharat puri |
|
Designation : |
Director |
|
Date of Appointment : |
28.05.2008 |
|
|
|
|
Name : |
Mr. D. Bhattacharya |
|
Designation : |
Director |
|
|
|
|
Name : |
J.L. Shah |
|
Designation : |
Whole Time Director [up to 08.11.2011] |
|
|
|
|
Name : |
Mr. Sanjeev Aga |
|
Designation : |
Director [w.e.f.29.07.2011] |
|
|
|
|
Name : |
Mr. R Sreeram |
|
Designation : |
Whole Time Director [up to 08.11.2011] |
KEY EXECUTIVES
|
Name : |
Ms. Savithri Parekh |
|
Designation : |
Company Secretary |
|
|
|
|
Name : |
Ms. Rashmi |
|
Designation : |
Accounts Department |
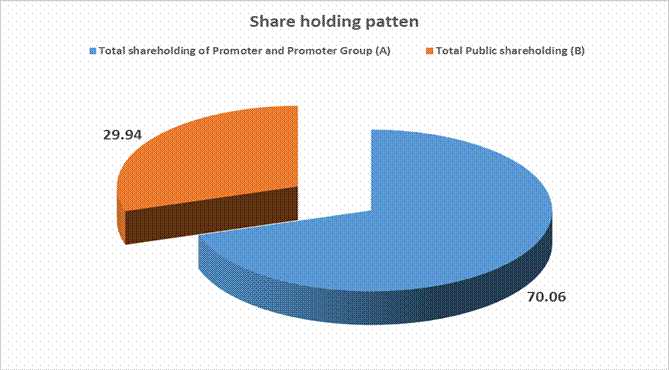
MAJOR SHAREHOLDERS / SHAREHOLDING PATTERN
AS ON 31.03.2014
|
Category of Shareholder |
Total No. of Shares |
Total Shareholding as a % of Total No. of Shares |
|
(A) Shareholding of Promoter and Promoter
Group |
|
|
|
|
|
|
|
|
270364008 |
52.74 |
|
|
85907932 |
16.76 |
|
|
356271940 |
69.50 |
|
|
|
|
|
|
|
|
|
|
2901606 |
0.57 |
|
|
2901606 |
0.57 |
|
|
|
|
|
Total shareholding of Promoter and Promoter
Group (A) |
359173546 |
70.06 |
|
|
|
|
|
(B) Public Shareholding |
|
|
|
|
|
|
|
|
11670069 |
2.28 |
|
|
79743 |
0.02 |
|
|
6756825 |
1.32 |
|
|
79561029 |
15.52 |
|
|
98067666 |
19.13 |
|
|
|
|
|
|
|
|
|
|
7781959 |
1.52 |
|
|
|
|
|
|
|
|
|
|
38764105 |
7.56 |
|
|
8855054 |
1.73 |
|
|
55401118 |
10.81 |
|
|
|
|
|
Total Public shareholding (B) |
153468784 |
29.94 |
|
|
|
|
|
Total (A)+(B) |
512642330 |
100.00 |
|
|
|
|
|
(C) Shares held by Custodians and against which
Depository Receipts have been issued |
|
|
|
|
0 |
0.00 |
|
|
0 |
0.00 |
|
|
0 |
0.00 |
|
|
|
|
|
Total (A)+(B)+(C) |
512642330 |
0.00 |
Shareholding
of securities (including shares, warrants, convertible securities) of persons
belonging to the category Promoter and Promoter Group
|
Sl. No. |
Name of the Shareholder |
Details of Shares held |
|
|
No. of Shares held |
As a % of grand total (A)+(B)+(C) |
||
|
1 |
Abha Ajay Parekh |
19,68,000 |
0.38 |
|
2 |
Ajay Balvantray Parekh |
1,07,85,894 |
2.10 |
|
3 |
Ajay Balvantray Parekh |
3,83,62,696 |
7.48 |
|
4 |
Ami Ajay Parekh |
43,68,616 |
0.85 |
|
5 |
Ami Ajay Parekh |
3,550 |
0.00 |
|
6 |
Amrita Ajay Parekh |
19,68,000 |
0.38 |
|
7 |
Anuja Ankur Shah |
16,000 |
0.00 |
|
8 |
Anuja Ankur Shah |
1,71,600 |
0.03 |
|
9 |
Apurva Narendrakumar Parekh |
27,84,910 |
0.54 |
|
10 |
Apurva Narendrakumar Parekh |
8,00,000 |
0.16 |
|
11 |
Bharati Narendrakumar Parekh |
89,06,086 |
1.74 |
|
12 |
Darshana Bimal Mody |
31,34,480 |
0.61 |
|
13 |
Darshana Bimal Mody |
4,596 |
0.00 |
|
14 |
Gulabben Himatlal Parekh |
2,61,716 |
0.05 |
|
15 |
Harish Himatlal Parekh |
20,76,592 |
0.41 |
|
16 |
Harshada Harvadan Vakil |
51,900 |
0.01 |
|
17 |
Harvadan |
42,300 |
0.01 |
|
18 |
Himatlal Kalyanji Parekh |
48,11,464 |
0.94 |
|
19 |
Himatlal Kalyanji Parekh |
166 |
0.00 |
|
20 |
Indumati Chimanlal Parekh |
20,134 |
0.00 |
|
21 |
Indumati Chimanlal Parekh |
20,234 |
0.00 |
|
22 |
Ishita Rajiv Amersey |
29,01,606 |
0.57 |
|
23 |
Jasna Raoul Thackersey |
36,15,126 |
0.71 |
|
24 |
Jimeet D Sanghavi |
91,600 |
0.02 |
|
25 |
Jimeet D Sanghavi |
300 |
0.00 |
|
26 |
Kalpana Apurva Parekh |
12,00,000 |
0.23 |
|
27 |
Kalpana Apurva Parekh |
30,00,000 |
0.59 |
|
28 |
Kalpana Apurva Parekh |
27,64,334 |
0.54 |
|
29 |
Kamalini Rashmikant Parekh |
8,01,934 |
0.16 |
|
30 |
Kamalini Rashmikant Parekh |
20,000 |
0.00 |
|
31 |
Kanta Balvantray Parekh |
33,85,410 |
0.66 |
|
32 |
Madhukar Balvantrayparekh |
82,12,004 |
1.60 |
|
33 |
Madhukar Balvantrayparekh |
4,87,65,564 |
9.51 |
|
34 |
Mala Madhukar Parekh |
93,60,992 |
1.83 |
|
35 |
Malay Rashmikant Parekh |
1,00,000 |
0.02 |
|
36 |
Malay Rashmikant Parekh |
61,600 |
0.01 |
|
37 |
Monisha Harish Parekh |
2,00,000 |
0.04 |
|
38 |
Mrudula Sushilkumar Parekh |
34,83,120 |
0.68 |
|
39 |
Narendrakumar Kalyanji Parekh |
63,16,092 |
1.23 |
|
40 |
Narendrakumar Kalyanji Parekh |
4,40,01,656 |
8.58 |
|
41 |
Narendrakumar Kalyanji Parekh |
40,14,430 |
0.78 |
|
42 |
Panna Deepak Sanghavi |
80,166 |
0.02 |
|
43 |
Pareet D Sanghavi |
95,600 |
0.02 |
|
44 |
Parul Harish Parekh |
10,39,208 |
0.20 |
|
45 |
Purvee Apurva Parekh |
8,00,000 |
0.16 |
|
46 |
Rashmikant Himatlal Parekh |
23,56,844 |
0.46 |
|
47 |
Rashmikant Himatlal Parekh |
534 |
0.00 |
|
48 |
Sanket Sushilkumar Parekh |
29,000 |
0.01 |
|
49 |
Sushil Kumar Kalyanji Parekh |
3,69,96,720 |
7.22 |
|
50 |
Sushil Kumar Kalyanji Parekh |
89,72,840 |
1.75 |
|
51 |
Urvi Malay Parekh |
40,000 |
0.01 |
|
52 |
Devkalyan Sales Private Limited |
2,60,74,280 |
5.09 |
|
53 |
Harton Private Limited |
1,22,07,634 |
2.38 |
|
54 |
Ishijas Chemical Private Limited |
2,46,30,038 |
4.80 |
|
55 |
Kalva Marketing And Services Limited |
13,82,628 |
0.27 |
|
56 |
Parekh Marketing Limited |
7,96,700 |
0.16 |
|
57 |
Parkem Dyes and Chemicals Private Limited |
12,76,510 |
0.25 |
|
58 |
Pidichem Private Limited |
76,14,916 |
1.49 |
|
59 |
The Vacuum Forming Company Private Limited |
1,14,62,186 |
2.24 |
|
60 |
Trivenikalyan Trading Private Limited |
4,63,040 |
0.09 |
|
|
Total |
35,91,73,546 |
70.06 |
(*) The term encumbrance has the same meaning as
assigned to it in regulation 28(3) of the SAST Regulations, 2011.
Shareholding
of securities (including shares, warrants, convertible securities) of persons
belonging to the category Public and holding more than 1% of the total number
of shares
|
Sl. No. |
Name of the Shareholder |
No. of Shares held |
Shares as % of Total No. of Shares |
|
|
1 |
Genesis Indian Investment Company Limited
-General Sub Fund |
39863145 |
7.78 |
|
|
2 |
Government Pension Fund Global |
5471196 |
1.07 |
|
|
|
Total |
45334341 |
8.84 |
Shareholding
of securities (including shares, warrants, convertible securities) of persons
(together with PAC) belonging to the category “Public” and holding more than 5%
of the total number of shares of the company
|
Sl. No. |
Name(s) of the shareholder(s) and the Persons Acting in Concert (PAC)
with them |
No. of Shares |
Shares as % of Total No. of Shares |
|
|
1 |
Genesis Indian Investment Company Limited -General
Sub Fund |
39863145 |
7.78 |
|
|
|
Total |
39863145 |
7.78 |
BUSINESS DETAILS
|
Line of Business : |
Manufacturing of
Adhesives, Sealants, Art Material and Construction Paint and Chemical
Products. |
||||||||
|
|
|
||||||||
|
Products : |
|
GENERAL INFORMATION
|
No. of Employees : |
4223 [Approximately] |
|||||||||||||||
|
|
|
|||||||||||||||
|
Bankers : |
·
Indian Overseas Bank ·
Corporation Bank ·
ICICI Bank ·
The Royal Bank of Scotland N.V. ·
HDFC Bank |
|||||||||||||||
|
|
|
|||||||||||||||
|
Facilities : |
|
|
|
|
|
Banking
Relations : |
-- |
|
|
|
|
Auditors : |
|
|
Name : |
·
Haribhakti
and Company Chartered Accountants ·
Wadia
Ghandy and Company Solicitors and
Advocates |
|
|
|
|
Internal
Auditors : |
|
|
Name: |
Mahajan and
Aibara Chartered
Accountants |
|
|
|
|
Significant
Influence: |
·
Parekh Marketing Limited ·
Kalva Marketing and Services Limited |
|
|
|
|
Substantial
Interest in Voting Power (Associate): |
Vinyl Chemicals (India) Limited |
|
|
|
|
Partnership firm
of which 100% holding by wholly owned Subsidiaries: |
Nitin Enterprises |
|
|
|
|
100% Subsidiary: |
·
Fevicol Company Limited ·
Bhimad Commercial Co Private Limited ·
Madhumala Traders Private Limited ·
Pidilite International Pte Limited ·
Pidilite Middle East Limited ·
Pulvitec do Brasil Industria e Comercio de Colas
e Adesivos Ltda ·
Pidilite USA Inc ·
Building Envelope Systems India Limited |
|
|
|
|
100% Subsidiary
of wholly owned Subsidiary: |
·
Jupiter Chemicals (LLC) ·
P.T. Pidilite Indonesia ·
Pidilite Speciality Chemicals Bangladesh Private
Limited ·
Pidilite Innovation Centre Pte Limited ·
Pidilite Industries Egypt – SAE ·
Pidilite Bamco Limited ·
Pidilite South East Asia Limited ·
PIL Trading Egypt (LLC) ·
Pidilite Industries Trading (Shanghai) Company
Limited |
|
|
|
|
49% Subsidiary
of wholly owned Subsidiary and having significant influence: |
Bamco Supply Services Limited |
|
|
|
|
60% Subsidiary: |
Building Envelope Systems India Limited |
|
|
|
|
75% Subsidiary: |
Pagel Concrete Technologies Private Limited |
CAPITAL STRUCTURE
AS ON 31.03.2013
Authorised Capital :
|
No. of Shares |
Type |
Value |
Amount |
|
|
|
|
|
|
700000000 |
Equity Shares |
Re.1/- each |
Rs.700.000 Millions |
|
|
|
|
|
Issued, Subscribed & Paid-up Capital :
|
No. of Shares |
Type |
Value |
Amount |
|
|
|
|
|
|
512642330 |
Equity Shares |
Re.1/- each |
Rs.512.640
Millions |
|
|
|
|
|
NOTES:
RECONCILIATION OF
THE SHARES OUTSTANDING AT THE BEGINNING AND AT THE END OF THE REPORTING PERIOD
|
PARTICULAR |
AS ON 31.03.2013 |
|
|
|
No. of Shares |
Rs. in Millions |
|
Shares outstanding at the beginning of the year |
507648626 |
507.650 |
|
Shares issued
during the year upon conversion of Foreign Currency Convertible Bonds |
4993704 |
4.990 |
|
Shares
outstanding at the end of the year |
512642330 |
512.640 |
TERMS /RIGHTS
ATTACHED TO EQUITY SHARES
The Company has
only one class of equity shares having a par value of 1 per share. Each holder
of equity shares is entitled to one vote per share. The Company declares and pays
dividend in Indian rupees. The dividend proposed by the Board of Directors is
subject to the approval of the shareholders in the ensuing Annual General
Meeting. In the event of liquidation, the equity shareholders are eligible to
receive the remaining assets of the Company after distribution of all
preferential amounts, in the proportion of their shareholding. During the year
ended 31st March 2013, the amount of per share dividend recognized as
distributions to equity shareholders is 2.60
(1.90).
DETAILS OF
SHAREHOLDERS HOLDING MORE THAN 5% SHARES IN THE COMPANY
|
PARTICULAR |
AS ON 31.03.2013 |
|
|
|
No. of Shares |
% of Holding |
|
Madhukar Balvantray Parekh |
56958614 |
11.11 |
|
Narendrakumar
Kalyanji Parekh |
54332178 |
10.59 |
|
Ajay Balvantray
Parekh |
49134386 |
9.58 |
|
Sushilkumar
Kalyanji Parekh |
45969560 |
8.97 |
|
Devkalyan Sales
Private Limited |
26074280 |
5.09 |
|
Genesis Indian
Investment Company Limited - General Sub fund |
40675686 |
7.93 |
AGGREGATE NUMBER OF BONUS SHARES ISSUED, SHARE
ISSUED FOR CONSIDERATION OTHER THAN CASH AND SHARES BOUGHT BACK DURING THE
PERIOD OF FIVE YEARS, IMMEDIATELY PRECEDING THE REPORTING DATE:
|
PARTICULAR |
AS ON 31.03.2013 |
|
Equity Shares |
|
|
Fully paid up
pursuant to contract(s) without payment being received
in cash |
-- |
|
Allotted as
fully paid bonus shares |
-- |
|
Allotted on
Conversion of FCCB |
4993704 |
The Company had issued
on 6th December 2007, 400 Foreign Currency Convertible Bonds (FCCB) of
US$100,000 each, which were convertible into Equity shares at any time upto 1st
December 2012. The due date for redemption of FCCBs was 7th December 2012. As
on 7th December 2012, the balance outstanding FCCBs aggregating 205 Bonds were
redeemed by the Company.
FINANCIAL DATA
[All figures are in Rupees Millions]
ABRIDGED BALANCE
SHEET
|
SOURCES
OF FUNDS |
31.03.2013 |
31.03.2012 |
31.03.2011 |
|
I.
EQUITY
AND LIABILITIES |
|
|
|
|
(1)Shareholders' Funds |
|
|
|
|
(a) Share Capital |
512.640 |
507.650 |
506.130 |
|
(b) Reserves & Surplus |
16811.730 |
13208.990 |
10889.130 |
|
(c) Money received against share
warrants |
0.000 |
0.000 |
0.000 |
|
|
|
|
|
|
(2) Share Application
money pending allotment |
0.000 |
0.000 |
0.000 |
|
Total Shareholders’ Funds (1) + (2) |
17324.370 |
13716.640 |
11395.260 |
|
|
|
|
|
|
(3) Non-Current Liabilities |
|
|
|
|
(a) long-term borrowings |
0.000 |
922.970 |
2598.910 |
|
(b) Deferred tax liabilities (Net) |
483.620 |
454.270 |
409.660 |
|
(c) Other long term liabilities |
0.000 |
0.000 |
0.000 |
|
(d) long-term provisions |
142.870 |
101.380 |
86.720 |
|
Total Non-current Liabilities (3) |
626.490 |
1478.620 |
3095.290 |
|
|
|
|
|
|
(4) Current Liabilities |
|
|
|
|
(a) Short term borrowings |
0.000 |
0.000 |
27.700 |
|
(b) Trade payables |
2071.370 |
1702.280 |
1428.900 |
|
(c) Other current
liabilities |
3727.730 |
4928.640 |
2853.6200 |
|
(d) Short-term provisions |
1634.300 |
1179.460 |
1193.490 |
|
Total Current Liabilities (4) |
7433.400 |
7810.380 |
5503.710 |
|
|
|
|
|
|
TOTAL |
25384.260 |
23005.640 |
19994.260 |
|
|
|
|
|
|
II.
ASSETS |
|
|
|
|
(1) Non-current assets |
|
|
|
|
(a) Fixed Assets |
|
|
|
|
(i) Tangible assets |
5119.940 |
4717.130 |
4127.970 |
|
(ii) Intangible Assets |
217.130 |
242.090 |
281.740 |
|
(iii) Capital
work-in-progress |
4087.090 |
3713.350 |
3267.720 |
|
(iv) Intangible assets under development |
0.000 |
0.000 |
0.000 |
|
(b) Non-current Investments |
2623.170 |
2418.830 |
2355.910 |
|
(c) Deferred tax assets (net) |
0.000 |
0.000 |
0.000 |
|
(d) Long-term Loan and Advances |
242.280 |
249.510 |
179.400 |
|
(e) Other Non-current assets |
0.000 |
1.370 |
8.840 |
|
Total Non-Current Assets |
12289.610 |
11342.280 |
10221.580 |
|
|
|
|
|
|
(2) Current assets |
|
|
|
|
(a) Current investments |
2846.290 |
909.160 |
1641.4900 |
|
(b) Inventories |
4511.640 |
3963.040 |
3544.400 |
|
(c) Trade receivables |
3667.630 |
3261.180 |
2865.910 |
|
(d) Cash and cash
equivalents |
1368.240 |
2577.190 |
923.240 |
|
(e) Short-term loans and
advances |
594.080 |
859.870 |
756.840 |
|
(f) Other current assets |
106.770 |
92.920 |
40.800 |
|
Total Current Assets |
13094.650 |
11663.360 |
9772.680 |
|
|
|
|
|
|
TOTAL |
25384.260 |
23005.640 |
19994.260 |
PROFIT & LOSS
ACCOUNT
|
|
PARTICULARS |
31.03.2013 |
31.03.2012 |
31.03.2011 |
|
|
|
SALES |
|
|
|
|
|
|
|
Income |
33316.910 |
28163.200 |
23537.510 |
|
|
|
Other Income |
658.970 |
427.670 |
418.470 |
|
|
|
TOTAL (A) |
33975.880 |
28590.870 |
23955.980 |
|
|
|
|
|
|
|
|
Less |
EXPENSES |
|
|
|
|
|
|
|
Cost of Materials |
16966.670 |
|
|
|
|
|
Purchase of Stock in Trade |
1561.210 |
1316.060 |
|
|
|
|
Employee Benefits Expense |
3010.290 |
2611.560 |
|
|
|
|
Other Expenses |
6039.760 |
5013.240 |
19536.960 |
|
|
|
Exceptional Items (net) |
(59.440) |
126.290 |
|
|
|
|
Change in inventories
of Finished Goods, Work-in-Progress and Stock in Trade |
(392.450) |
(279.160) |
|
|
|
|
TOTAL (B) |
27126.040 |
23425.400 |
19536.960 |
|
|
|
|
|
|
|
|
Less |
PROFIT
/ (LOSS) BEFORE INTEREST, TAX, DEPRECIATION AND AMORTISATION (A-B) (C) |
6849.840 |
5165.470 |
4419.020 |
|
|
|
|
|
|
|
|
|
Less |
FINANCIAL
EXPENSES (D) |
121.740 |
245.040 |
0.000 |
|
|
|
|
|
|
|
|
|
|
PROFIT
/ (LOSS) BEFORE TAX, DEPRECIATION AND AMORTISATION (C-D) (E) |
6728.100 |
4920.430 |
4419.020 |
|
|
|
|
|
|
|
|
|
Less/ Add |
DEPRECIATION/
AMORTISATION (F) |
532.410 |
479.260 |
443.870 |
|
|
|
|
|
|
|
|
|
|
PROFIT / (LOSS)
BEFORE TAX (E-F) (G) |
6195.690 |
4441.170 |
3975.150 |
|
|
|
|
|
|
|
|
|
Less |
TAX (H) |
1588.090 |
1096.110 |
936.240 |
|
|
|
|
|
|
|
|
|
|
PROFIT / (LOSS)
AFTER TAX (G-H) (I) |
4607.600 |
3345.060 |
3038.910 |
|
|
|
|
|
|
|
|
|
Add |
PREVIOUS
YEARS’ BALANCE BROUGHT FORWARD |
1303.000 |
1073.490 |
1006.320 |
|
|
|
|
|
|
|
|
|
Less |
APPROPRIATIONS |
|
|
|
|
|
|
|
Proposed Final Equity Dividend |
1333.000 |
965.140 |
885.740 |
|
|
|
Tax on Proposed Equity Dividend |
226.000 |
156.570 |
143.690 |
|
|
|
Transfer to Debenture Redemption Reserve |
60.000 |
243.400 |
42.310 |
|
|
|
Transfer to General Reserve |
2500.000 |
1750.000 |
1900.000 |
|
|
BALANCE CARRIED
TO THE B/S |
1791.600 |
1303.440 |
1073.490 |
|
|
|
|
|
|
|
|
|
|
EARNINGS IN
FOREIGN CURRENCY |
|
|
|
|
|
|
|
Export Earnings |
3201.730 |
2643.160 |
2392.920 |
|
|
|
Other Earnings |
5.480 |
18.610 |
5.440 |
|
|
TOTAL EARNINGS |
3207.210 |
2661.770 |
2398.360 |
|
|
|
|
|
|
|
|
|
|
IMPORTS |
|
|
|
|
|
|
|
Raw Materials |
3999.210 |
3519.650 |
2912.450 |
|
|
|
Capital Goods |
103.710 |
119.340 |
105.200 |
|
|
|
Others |
665.740 |
639.570 |
582.200 |
|
|
TOTAL IMPORTS |
4768.660 |
4278.560 |
3599.850 |
|
|
|
|
|
|
|
|
|
|
Earnings /
(Loss) Per Share (Rs.) |
|
|
|
|
|
|
- Basic |
9.04 |
6.59 |
6.00 |
|
|
|
- Diluted |
9.04 |
6.43 |
5.84 |
|
KEY RATIOS
|
PARTICULARS |
|
31.03.2013 |
31.03.2012 |
31.03.2011 |
|
PAT / Total Income |
(%) |
13.56 |
11.70 |
12.69 |
|
|
|
|
|
|
|
Net Profit Margin (PBT/Sales) |
(%) |
18.60 |
15.77 |
16.89 |
|
|
|
|
|
|
|
Return on Total Assets (PBT/Total Assets} |
(%) |
33.18 |
26.32 |
27.66 |
|
|
|
|
|
|
|
Return on Investment (ROI) (PBT/Networth) |
|
0.36 |
0.32 |
0.35 |
|
|
|
|
|
|
|
Debt Equity Ratio (Total Debt/Networth) |
|
0.00 |
0.07 |
0.23 |
|
|
|
|
|
|
|
Current Ratio (Current Asset/Current Liability) |
|
1.76 |
1.49 |
1.78 |
FINANCIAL
ANALYSIS
[All figures are in Rupees Millions]
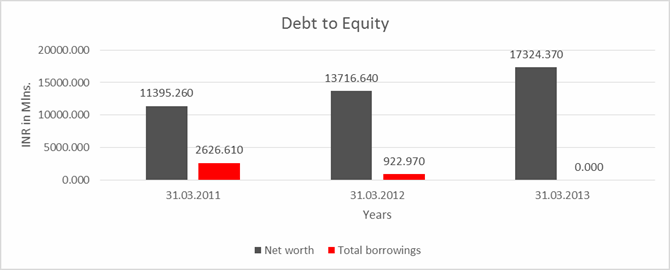
DEBT EQUITY RATIO
|
Particular |
31.03.2011 |
31.03.2012 |
31.03.2013 |
|
|
(INR in Mlns.) |
(INR in Mlns.) |
(INR in Mlns.) |
|
Share Capital |
506.130 |
507.650 |
512.640 |
|
Reserves & Surplus |
10889.130 |
13208.990 |
16811.730 |
|
Net worth |
11395.260 |
13716.640 |
17324.370 |
|
|
|
|
|
|
long-term borrowings |
2598.910 |
922.970 |
0.000 |
|
Short term borrowings |
27.700 |
0.000 |
0.000 |
|
Total borrowings |
2626.610 |
922.970 |
0.000 |
|
Debt/Equity ratio |
0.231 |
0.067 |
0.000 |
YEAR-ON-YEAR GROWTH
|
Year on Year Growth |
31.03.2011 |
31.03.2012 |
31.03.2013 |
|
|
(INR in Mlns) |
(INR in Mlns) |
(INR in Mlns) |
|
Sales |
23,537.510 |
28,163.200 |
33,316.910 |
|
|
|
19.652 |
18.299 |

NET PROFIT MARGIN
|
Net Profit Margin |
31.03.2011 |
31.03.2012 |
31.03.2013 |
|
|
(INR in Mlns) |
(INR in Mlns) |
(INR in Mlns) |
|
Sales |
23,537.510 |
28,163.200 |
33,316.910 |
|
Profit |
3,038.910 |
3,345.060 |
4,607.600 |
|
|
12.91% |
11.88% |
13.83% |
LOCAL AGENCY FURTHER INFORMATION
CURRENT MATURITY
OF LONG TERM BORROWINGS DETAIL:
|
Particulars |
31.03.2013 |
31.03.2012 |
31.03.2011 |
|
|
(Rs. In Millions) |
||
|
|
|
|
|
|
Current maturities of Long-Term borrowings |
|
|
|
|
600
(600) 11.9% Redeemable Non-Convertible Debentures of 1,000,000 Each |
600.000 |
-- |
-- |
|
Foreign
Currency Convertible Bonds (US $ 33.3 million Zero Coupon Convertible Bonds) |
-- |
1705.63 |
-- |
|
Loan
from bank(s) |
-- |
11.560 |
231.670 |
|
Interest
free Sales Tax loan from Government of Maharashtra |
2.430 |
12.730 |
9.030 |
|
Sr. No. |
Check List by
Info Agents |
Available in Report (Yes / No) |
|
1] |
Year of Establishment |
Yes |
|
2] |
Locality of the firm |
Yes |
|
3] |
Constitutions of the firm |
Yes |
|
4] |
Premises details |
No |
|
5] |
Type of Business |
Yes |
|
6] |
Line of Business |
Yes |
|
7] |
Promoter's background |
No |
|
8] |
No. of employees |
Yes |
|
9] |
Name of person contacted |
No |
|
10] |
Designation of contact person |
No |
|
11] |
Turnover of firm for last three years |
Yes |
|
12] |
Profitability for last three years |
Yes |
|
13] |
Reasons for variation <> 20% |
-- |
|
14] |
Estimation for coming financial year |
No |
|
15] |
Capital in the business |
Yes |
|
16] |
Details of sister concerns |
Yes |
|
17] |
Major suppliers |
No |
|
18] |
Major customers |
No |
|
19] |
Payments terms |
No |
|
20] |
Export / Import details (if applicable) |
No |
|
21] |
Market information |
-- |
|
22] |
Litigations that the firm / promoter involved in |
Yes |
|
23] |
Banking Details |
Yes |
|
24] |
Banking facility details |
Yes |
|
25] |
Conduct of the banking account |
-- |
|
26] |
Buyer visit details |
-- |
|
27] |
Financials, if provided |
Yes |
|
28] |
Incorporation details, if applicable |
Yes |
|
29] |
Last accounts filed at ROC |
Yes |
|
30] |
Major Shareholders, if available |
Yes |
|
31] |
PAN of Proprietor/Partner/Director, if available |
No |
|
32] |
Date
of Birth of Proprietor/Partner/Director, if available |
No |
|
33] |
Voter ID No of Proprietor/Partner/Director, if available |
No |
|
34] |
External Agency Rating, if available |
Yes |
------------------------------------------------------------------------------------------------------------------------------
LITIGATION DETAILS
CASE DETAILS
BENCH:-BOMBAY
|
Lodging No.:- |
APPL/69/2014 |
Filing Date:- |
11.02.2014 |
|
Lodging No.: |
NMSL/1717/2013 |
Main Matter |
|
|
Petitioner:- |
Jubilant Agri
And Consumer Products |
Respondent:- |
PIDILITE
INDUSTRIES LIMITED |
|
Petn. Adv.:- |
MAG LEGAL (1295)
|
|
|
|
District:- |
Outside Maharashtra
|
|
|
|
Bench:- |
DIVISION |
|
|
|
Status:- |
Admitted (Unready) |
Category:- |
Appeal (Interlocutory
Appln-NMA) |
|
Last Date:- |
24.02.2014 |
Stage:- |
Appeals for
Admission – Fresh (Original Side
Matters) |
|
Last Coram:- |
HON'BLE SHRI
JUSTICE S. J. VAZIFDAR HON'BLE SHRI
JUSTICE B. P. COLABAWALLA |
|
|
|
|
Act :- |
Trade and Trade
Merchandise Marks Act |
------------------------------------------------------------------------------------------------------------------------------
UNSECURED LOAN
|
Particulars |
As on 31.03.2013 [Rs. in Millions] |
As on 31.03.2012 [Rs. in Millions] |
|
Long Term Borrowings
|
|
|
|
Other loans and
advances |
|
|
|
Interest free Sales Tax loan from Government of Maharashtra Sales Tax loan
was interest free and payable in 16 yearly installments, starting from 30th April
2007. The same has been prepaid during the year except 2.43 million |
0.000 |
322.970 |
|
|
|
|
|
TOTAL |
0.000 |
322.970 |
------------------------------------------------------------------------------------------------------------------------------
FINANCIAL PERFORMANCE:
The Operating
Profit and Net Profit for the year at Rs.6752.000 millions and Rs.4608.000
millions increased by 26% and 38% respectively. Income Tax for the current year
at Rs.1559.000 millions is higher by 48%, due to completion of the first five
year tax holiday period for one manufacturing unit located in Himachal Pradesh.
With this all units have completed their first five year tax holiday period.
Slow down in
industrial growth in India combined with a weak global economy, impacted sales
of industrial products. As a result, sales of industrial products grew by
10.6%, below the historical trends.
Sales of Consumer
and Bazaar products grew by 20.7%. Volume growth, however, was lower than past
trends. The Indian Rupee was at Rs.54.28 to a US $ as on 31st March 2013 as
compared to Rs.50.87 to a US $ as on 31st March 2012. Moreover the Rupee saw
high volatility during the year and at times quoted above Rs.57 to a US $. This
made imports costlier and impacted margins. This movement adversely impacted
the liability on account of outstanding Foreign Currency Convertible Bonds
(FCCBs). However, this impact was partly offset by conversion of 128 FCCBs
which resulted in write back of the earlier exchange fluctuations.
Consequently, exchange loss for the year was only Rs.5 million as compared to
Rs.85 million in the previous year.
SUBSIDIARIES:
DOMESTIC:
During the year, a
Joint Venture Company, Building Envelope Systems India Limited was incorporated
for manufacture of a select range of construction chemicals for application in
waterproofing and thermal insulation. All these products will be sold through the
Company. These products will address demand for high end waterproofing
solutions. The Company holds 60% of the capital in the Joint Venture Company.
OVERSEAS SUBSIDIARIES:
Total revenue grew
by 6.6% in constant currency terms. The business in US reported sales growth of
10.2%. EBIDTA for the year declined by 21.6% due to higher material costs and
item as detailed later.
The subsidiary in
Brazil continued to perform below expectations. Sales declined by 0.9%. However
due to actions taken to improve performance, sales growth in the second half
was 6.7% as compared to a decline of 7.9% in the first half. Actions taken to
improve performance include strengthening the management as well as to reduce
cost and improve margin. The subsidiary in Bangladesh reported sales growth of
34%. The business scope was extended to include trading operations which
started in December 2012. Sales growth after including the revenue from trading
operations was 42%. The manufacturing facility was expanded to produce a wider
range of adhesives. Full benefit of these initiatives will be reflected in the
current year.
The subsidiaries
in Thailand reported sales growth of 22%. The manufacturing operations in
Thailand were rationalized by shutting down one manufacturing facility to reduce
operating costs. The subsidiary in Egypt had a sales growth of 25%. Losses were
significantly reduced. The subsidiary in Dubai reported sales decline of 42%.
With measures taken to reduce costs, losses were lower than last year. Due to
the reasons mentioned above, the overseas operations continue to report losses.
Full year losses
incurred by overseas subsidiaries were Rs.440 million as compared to a loss of
Rs.254.000 millions last year. This was mainly due to the following items:
|
Provision for receivables due from a customer who has filed for bankruptcy in US |
Rs.25.000
millions |
|
Provision for goodwill impairment in Brazil |
Rs.94.000
millions |
|
Provision for disputed tax liabilities of previous years and other disputed items in Brazil |
Rs.46.000
millions |
|
One off expenses for closure of factory in Thailand |
Rs.12.000
millions |
|
Total |
Rs.177.000 millions |
CURRENT YEAR OUTLOOK:
The demand for the
Company’s products is linked to the market demand both in India and globally.
The current year’s outlook is uncertain due to the present weakness in the
underlying economic scenario. With the Indian Rupee likely to remain weak
versus the US $ due to the high fiscal deficit, margins are not likely to
improve as higher cost of imports could offset gains from lower commodity
prices. The Company’s major subsidiaries are in USA, Brazil, Thailand, Egypt
and Bangladesh. All these units are making efforts to improve performance
through demand generation and cost reduction initiatives.
MANAGEMENT DISCUSSION AND ANALYSIS:
Net sales of the
Company grew by 18.3%, marginally lower than that recorded in the previous
year. Sales of Consumer and Bazaar products grew by 20.7% while growth in
Industrial Products was slower at 10.6%. Increase in commodity costs led by
crude oil prices and a depreciating currency impacted margins in the first half
of the year and price increases were implemented. With cost inflation easing in
the second half, margins were better than the corresponding period of the
previous year. The subsidiary in Brazil continued to incur losses. While the
subsidiary has taken a series of measures to improve performance, the continued
losses require the Company to review the value of its investments in that
subsidiary. Accordingly, a provision for diminution in value of Rs.53.100
millions has been made, which is in addition to Rs.96.900 millions provided
last year. This provision has no impact on the consolidated results of the
Company. Earnings before interest, taxes, exceptional items and foreign
exchange differences, increased by 28%, profit before tax (PBT) increased by
40% and profit after tax (PAT) increased by 38%. The Company’s sales have grown
at a CAGR of 17.1% over the last 5 years.
CONTINGENT
LIABILITIES NOT PROVIDED FOR:
|
Particulars |
31.03.2013 [Rs. in millions] |
31.03.2012 [Rs. in millions] |
|
Guarantees given by Banks in favour of Government and others |
278.520 |
75.790 |
|
Guarantees given by Company |
1004.210 |
899.200 |
|
Unexpired Letter of Credit |
212.960 |
0.000 |
|
Disputed
liabilities in respect of Income Tax, Sales Tax, Central Excise and Customs
(under appeal) |
399.530 |
363.530 |
|
Claims against the Company not acknowledged as debts |
5.260 |
62.680 |
|
|
|
|
|
TOTAL |
1900.480 |
1401.200 |
INDEX OF CHARGES
|
S.NO. |
CHARGE ID |
DATE OF CHARGE
CREATION/MODIFICATION |
CHARGE AMOUNT
SECURED |
CHARGE HOLDER |
ADDRESS |
SERVICE REQUEST
NUMBER (SRN) |
|
1 |
90218500 |
06/08/2008 * |
1,519,900,000.00 |
INDIAN OVERSEAS
BANK |
BAKHTAWAR,
NARIMAN POINT, MUMBAI, MAHARASHTRA - 400021, INDIA |
A44106425 |
|
2 |
90242415 |
09/03/2005 * |
954,900,000.00 |
INDIAN OVERSAES
BANK |
BHAKTAWAR,
GROUND FLOOR; NARIMAN POINT, MUMBAI, MAHARASHTRA, INDIA |
- |
|
3 |
90216221 |
05/12/1995 |
50,000,000.00 |
INDUSTRIAL
DEVELOPMENT BANK OF INDIA |
IDBI TOWERS,
CUFFE PARADE; COLABA, BOMBAY, MAHARASHTRA - 400005, INDIA |
- |
|
4 |
90362717 |
05/09/1984 |
150,000.00 |
THE MAHARASHTRA
STATE FINANCIAL CORPORATION |
A.K. NAYAK MARG,
FORT, MUMBAI, MAHARASHTRA, INDIA |
- |
* Date of charge modification
FIXED ASSETS:
·
Goodwill
·
·
·
Buildings
·
Plant and
Machinery
·
Trademark
·
Copyrights
·
Furniture
and Fixtures
·
Vehicles
·
Office Equipment
NEWS:
ACCUMULATE
PIDILITE INDUSTRIES; TGT OF RS 313: PLILLADHER
Prabhudas
Lilladher is bullish on Pidilite Industries and has recommended accumulate
rating on the stock with a target of Rs.313 in its May 29, 2014 research
report.
“We are cutting FY15 and FY16 EPS estimates of
Pidilite Industries (PIDI) by 4-7 percent to factor in 1) sharp spike in VAM
prices and 2) lower financial other income and tax rate. PIDI has reported ~14
percent volume growth in a tough operating environment which reinforces our
view of growth potential in Adhesives, Construction chemicals and Industrial
chemical business. 5-6 percent price increase indicates the strength of brands
like Fevicol, Dr. Fixit and M-Seal and shows PIDI’s ability to increase margins
from the current depressed levels. We believe that PIDI is a compelling play on
any potential recovery in economy as higher construction, interior work and
industrial activity will boost demand for its products. We estimate a
standalone EPS of Rs11.1 and Rs13.9 for FY15 and FY16, respectively, which
shows PAT CAGR of 22 percent over FY14-16. We value PIDI at Rs313 (SOTP,
domestic business valued at Rs307 at 22xMarch 16 EPS) versus Rs327 earlier. We
retain ‘Accumulate’.”
“Volumes grew 14 percent during Q4FY14. Gross margin at
42.6 percent declined 530bps on account of higher input cost. EBITDA margin
declined 350bps to 12.9 percent. EBITDA declined 6.4 percent to Rs1.17bn. 65
percent increase in interest burden, 32 percent increase in depreciation and
32.6 percent decline in other income resulted in 13.3 percent decline in PBT.
Adj. PAT declined 5.4 percent to Rs888m as tax rate declined by 670bps to 20.6
percent. A sharp spike in VAM prices has impacted margins. PIDI has undertaken
5‐6 percent price increase in
products with VAM as feed stock and another price increase is likely in Q2. We
expect meaningful margin recovery only after Q2 as VAM prices are expected to
remain firm for 1‐2 quarters more. IBD Sales
increased 8 percent sales growth, while losses increased due to higher legal,
tax and restructuring expenses in North and South America. Egypt market
recovery boosted performance of the Middle East, while South Asia continued to
sustain strong performance, led by Bangladesh.”
“Q4 volumes in Consumer and Bazaar products increased
in double digits (11 percent in Q3). There is no change in demand scenario as
of now. Economic recovery will aid higher demand for adhesives, construction
chemicals and industrial chemicals. VAM prices have zoomed from a level of
US$1100/ton to US$1500/ton. Maintenance shutdown of 2 units in USA and closure
of 2 units in Europe and USA led to demand supply mismatch and consequent spike
in prices. Prices are likely to remain firm for 1‐2
quarters even as 2 units in USA are back into production. New capacity
additions are also likely. PIDI is yet to decide on using its own VAM unit as
it requires a couple of quarters to put it back to production; it will keep a
watch on prices to take a call on in‐house
production of VAM. PIDI has undertaken 5‐6
percent price increase in products which have VAM as a major feedstock. PIDI is
indicating another round of price increase in Q2 to pass on the full impact of
input cost inflation depending upon the trends in prices. Accumulate Pidilite
Industries with a target of Rs.313,” says Prabhudas Lilladher research report.
CMT REPORT (Corruption, Money Laundering & Terrorism]
The Public Notice information has been collected from various sources
including but not limited to: The Courts,
1] INFORMATION ON
DESIGNATED PARTY
No exist designating subject or any of its beneficial owners, controlling
shareholders or senior officers as terrorist or terrorist organization or whom
notice had been received that all financial transactions involving their assets
have been blocked or convicted, found guilty or against whom a judgement or
order had been entered in a proceedings for violating money-laundering,
anti-corruption or bribery or international economic or anti-terrorism sanction
laws or whose assets were seized, blocked, frozen or ordered forfeited for
violation of money laundering or international anti-terrorism laws.
2] Court Declaration :
No records exist to suggest that subject is
or was the subject of any formal or informal allegations, prosecutions or other
official proceeding for making any prohibited payments or other improper payments
to government officials for engaging in prohibited transactions or with
designated parties.
3] Asset Declaration :
No records exist to suggest that the property or assets of the subject
are derived from criminal conduct or a prohibited transaction.
4] Record on Financial
Crime :
Charges or conviction
registered against subject: None
5] Records on Violation of
Anti-Corruption Laws :
Charges or
investigation registered against subject: None
6] Records on Int’l Anti-Money
Laundering Laws/Standards :
Charges or
investigation registered against subject: None
7] Criminal Records
No
available information exist that suggest that subject or any of its principals
have been formally charged or convicted by a competent governmental authority
for any financial crime or under any formal investigation by a competent
government authority for any violation of anti-corruption laws or international
anti-money laundering laws or standard.
8] Affiliation with
Government :
No record
exists to suggest that any director or indirect owners, controlling
shareholders, director, officer or employee of the company is a government
official or a family member or close business associate of a Government
official.
9] Compensation Package :
Our market
survey revealed that the amount of compensation sought by the subject is fair
and reasonable and comparable to compensation paid to others for similar
services.
10] Press Report :
No press reports / filings exists on
the subject.
CORPORATE GOVERNANCE
MIRA INFORM as part of its Due Diligence do provide comments on
Corporate Governance to identify management and governance. These factors often
have been predictive and in some cases have created vulnerabilities to credit
deterioration.
Our Governance Assessment focuses principally on the interactions
between a company’s management, its Board of Directors, Shareholders and other
financial stakeholders.
CONTRAVENTION
Subject is not known to have contravened any existing local laws, regulations
or policies that prohibit, restrict or otherwise affect the terms and
conditions that could be included in the agreement with the subject.
FOREIGN EXCHANGE RATES
|
Currency |
Unit
|
Indian Rupees |
|
US Dollar |
1 |
Rs.59.73 |
|
|
1 |
Rs.102.36 |
|
Euro |
1 |
Rs.81.38 |
INFORMATION DETAILS
|
Information
Gathered by : |
NYA |
|
|
|
|
Analysis Done by
: |
DIV |
|
|
|
|
Report Prepared
by : |
NIT |
SCORE & RATING EXPLANATIONS
|
SCORE FACTORS |
RANGE |
POINTS |
|
HISTORY |
1~10 |
8 |
|
PAID-UP CAPITAL |
1~10 |
8 |
|
OPERATING SCALE |
1~10 |
8 |
|
FINANCIAL CONDITION |
|
|
|
--BUSINESS SCALE |
1~10 |
8 |
|
--PROFITABILIRY |
1~10 |
8 |
|
--LIQUIDITY |
1~10 |
8 |
|
--LEVERAGE |
1~10 |
8 |
|
--RESERVES |
1~10 |
8 |
|
--CREDIT LINES |
1~10 |
8 |
|
--MARGINS |
-5~5 |
-- |
|
DEMERIT POINTS |
|
|
|
--BANK CHARGES |
YES/NO |
YES |
|
--LITIGATION |
YES/NO |
YES |
|
--OTHER ADVERSE INFORMATION |
YES/NO |
NO |
|
MERIT POINTS |
|
|
|
--SOLE DISTRIBUTORSHIP |
YES/NO |
NO |
|
--EXPORT ACTIVITIES |
YES/NO |
NO |
|
--AFFILIATION |
YES/NO |
YES |
|
--LISTED |
YES/NO |
YES |
|
--OTHER MERIT FACTORS |
YES/NO |
YES |
|
DEFAULTER |
|
|
|
--RBI |
YES/NO |
NO |
|
--EPF |
YES/NO |
NO |
|
TOTAL |
|
72 |
This score serves as a reference to assess SC’s credit risk
and to set the amount of credit to be extended. It is calculated from a
composite of weighted scores obtained from each of the major sections of this
report. The assessed factors and their relative weights (as indicated through
%) are as follows:
Financial
condition (40%) Ownership
background (20%) Payment
record (10%)
Credit history
(10%) Market trend
(10%) Operational
size (10%)
RATING EXPLANATIONS
|
RATING |
STATUS |
PROPOSED CREDIT LINE |
|
|
>86 |
Aaa |
Possesses an extremely sound financial base with the strongest
capability for timely payment of interest and principal sums |
Unlimited |
|
71-85 |
Aa |
Possesses adequate working capital. No caution needed for credit transaction.
It has above average (strong) capability for payment of interest and
principal sums |
Large |
|
56-70 |
A |
Financial & operational base are regarded healthy. General
unfavourable factors will not cause fatal effect. Satisfactory capability for
payment of interest and principal sums |
Fairly Large |
|
41-55 |
Ba |
Overall operation is considered normal. Capable to meet normal
commitments. |
Satisfactory |
|
26-40 |
B |
Capability to overcome financial difficulties seems comparatively below
average. |
Small |
|
11-25 |
Ca |
Adverse factors are apparent. Repayment of interest and principal sums
in default or expected to be in default upon maturity |
Limited with
full security |
|
<10 |
C |
Absolute credit risk exists. Caution needed to be exercised |
Credit not
recommended |
|
- |
NB |
New Business |
- |
This report is issued at your request without any
risk and responsibility on the part of MIRA INFORM PRIVATE LIMITED (MIPL)
or its officials.