MIRA
INFORM REPORT
|
Report Date : |
12.07.2014 |
IDENTIFICATION DETAILS
|
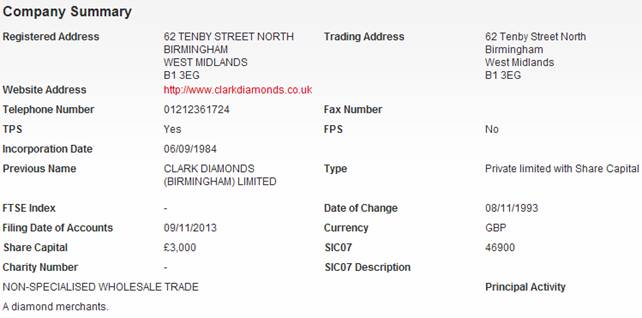
Name : |
CLARK DIAMONDS LIMITED |
|
|
|
|
Formerly Known As : |
CLARK DIAMONDS ( |
|
|
|
|
Registered Office : |
|
|
|
|
|
Country : |
|
|
|
|
|
Financials (as on) : |
30.06.2013 |
|
|
|
|
Date of Incorporation : |
06.09.1984 |
|
|
|
|
Legal Form : |
Private limited with share capital |
|
|
|
|
Line of Business : |
·
Non Specialized wholesale trade ·
Diamond Merchants |
|
|
|
|
No. of Employees |
15 |
RATING & COMMENTS
|
MIRA’s Rating : |
A |
|
RATING |
STATUS |
PROPOSED CREDIT LINE |
|
|
56-70 |
A |
Financial & operational base are regarded healthy. General
unfavourable factors will not cause fatal effect. Satisfactory capability for
payment of interest and principal sums |
Fairly Large |
|
Status : |
Good |
|
Payment Behaviour : |
Regular |
|
Litigation : |
Clear |
NOTES :
Any query related to this report can be made
on e-mail : infodept@mirainform.com
while quoting report number, name and date.
ECGC Country Risk Classification List – March 31, 2014
|
Country Name |
Previous Rating (31.12.2013) |
Current Rating (31.03.2014) |
|
|
A1 |
A1 |
|
Risk Category |
ECGC
Classification |
|
Insignificant |
A1 |
|
Low Risk |
A2 |
|
Moderate Low Risk |
B1 |
|
Moderate Risk |
B2 |
|
Moderate High Risk |
C1 |
|
High Risk |
C2 |
|
Very High Risk |
D |
The
|
Source
: CIA |
Company name and address
CLARK DIAMONDS
LIMITED
DIRECTORS/MANAGEMENT
Current Directors
|
Name |
Date of Birth |
24/03/1954 |
|
|
Officers Title |
Mr |
Nationality |
British |
|
Present Appointments |
2 |
Function |
Director |
|
Appointment Date |
19/01/1993 |
|
|
|
Address |
Redhill House, |
||
|
Other Actions |
|
||
|
Name |
Date of Birth |
24/06/1973 |
|
|
Officers Title |
Mr |
Nationality |
British |
|
Present Appointments |
1 |
Function |
Director |
|
Appointment Date |
01/07/2013 |
|
|
|
Address |
|
||
|
Other Actions |
|
||
|
Name |
Date of Birth |
24/04/1982 |
|
|
Officers Title |
Mr |
Nationality |
British |
|
Present Appointments |
5 |
Function |
Director |
|
Appointment Date |
01/07/2013 |
|
|
|
Address |
|
||
|
Other Actions |
|
||
|
Name |
Date of Birth |
12/04/1984 |
|
|
Officers Title |
Mr |
Nationality |
British |
|
Present Appointments |
1 |
Function |
Director |
|
Appointment Date |
01/07/2013 |
|
|
|
Address |
|
||
|
Other Actions |
|
||
Current Company Secretary
|
Name |
Date of Birth |
- |
|
|
Officers Title |
Mrs |
Nationality |
British |
|
Present Appointments |
4 |
Function |
Company Secretary |
|
Appointment Date |
01/11/2003 |
|
|
|
Address |
|
||
Previous Director/Company
Secretaries
|
Name |
Current Directorships |
Previous Directorships |
|
2 |
4 |
|
|
2 |
4 |
NEGATIVE INFORMATION
Mortgage Summary
Total Mortgage 2
Outstanding 2
Satisfied 0
Trade Debtors / Bad
Debt Summary
Total Number of Documented Trade 6
Total Value of Documented Trade £418,369
CCJ
|
Total Number of Exact CCJs - |
Total Value of Exact CCJs - |
|
|
Total Number of Possible CCJs - |
Total Value of Possible CCJs - |
|
|
Total Number of Satisfied CCJs - |
Total Value of Satisfied CCJs - |
|
|
Total Number of Writs - |
- |
|
Exact CCJ Details
|
No CCJs found |
Possible CCJs Details
|
There are no possible CCJ details |
Writ Details
|
No writs found |
Mortgage Details
|
Mortgage Type: |
DEBENTURE |
||
|
Date Charge Created: |
03/09/03 |
|
|
|
Date Charge Registered: |
10/09/03 |
|
|
|
Date Charge Satisfied: |
- |
|
|
|
Status: |
OUTSTANDING |
|
|
|
Person(s) Entitled: |
HSBC BANK PLC |
||
|
Amount Secured: |
ALL MONIES DUE OR TO BECOME DUE FROM THE COMPANY TO THE CHARGEE ON ANY ACCOUNT WHATSOEVER |
||
|
Details: |
FIXED AND FLOATING CHARGES OVER THE UNDERTAKING AND ALL PROPERTY AND ASSETS PRESENT AND FUTURE INCLUDING GOODWILL BOOKDEBTS UNCALLED CAPITAL BUILDINGS FIXTURESFIXED PLANT AND MACHINERY |
||
|
Mortgage Type: |
CHARGE |
||
|
Date Charge Created: |
16/11/84 |
|
|
|
Date Charge Registered: |
23/11/84 |
|
|
|
Date Charge Satisfied: |
- |
|
|
|
Status: |
OUTSTANDING |
|
|
|
Person(s) Entitled: |
MIDLAND BANK PLC |
||
|
Amount Secured: |
ALL MONIES DUE OR TO BECOME DUE FROM THE COMPANY TO THE CHARGEE ON ANY ACCOUNT WHATSOEVER |
||
|
Details: |
FIXED & FLOATING CHARGE OVERALL BOOK & OTHER DEBTS UNDERTAKING AND ALL PROPERTY AND ASSETS PRESENT AND FUTURE INCLUDING UNCALLED CAPITAL |
||
Creditor Details
|
|
Total Number |
Total Value |
|
Trade Creditors |
0 |
- |
|
No Creditor Data |
Trade Debtors / Bad Debt Detail
|
|
Total Number of Documented Trade |
Total Value of Documented Trade |
|
Trade Debtors |
6 |
£418,369 |
|
Company Name |
Amount |
Statement Date |
|
£374,882 |
10/06/2014 |
|
|
£29,056 |
25/05/2010 |
|
|
£6,829 |
25/01/2012 |
|
|
£3,939 |
16/09/2013 |
|
|
£3,521 |
11/05/2012 |
|
|
£142 |
08/12/2011 |
SHARE & SHARE CAPITAL
INFORMATION
Top 20 Shareholders
|
Name |
Currency |
Share Count |
Share Type |
Nominal Value |
% of Total Share Count |
|
MARK COLEMAN BARROWS |
GBP |
1,200 |
ORDINARY A |
1 |
40 |
|
SIMON IAN BARROWS |
GBP |
900 |
ORDINARY B |
1 |
30 |
|
MICHAEL JAMES BARROWS |
GBP |
900 |
ORDINARY B |
1 |
30 |
PAYMENT INFORMATION
Trade Payment Information
|
Average Invoice Value |
114.18 |
|
Invoices available |
30 |
|
Paid |
30 |
|
Outstanding |
0 |
|
Average Invoice Value |
£114.18 |
|
Invoices available |
30 |
|
Paid |
30 |
|
Outstanding |
0 |
|
Trade Payment Data is information that we collect from selected third party partners who send us information about their whole sales ledger. |
|
|
Within Terms |
0-30 Days |
31-60 Days |
61-90 Days |
91+ Days |
|
Paid |
30 |
0 |
0 |
0 |
0 |
|
Outstanding |
0 |
0 |
0 |
0 |
0 |
GROUP STRUCTURE & AFFILIATED
COMPANIES
Group structure
|
FINANCIAL INFORMATION
Profit & Loss
|
Date Of Accounts |
30/06/13 |
(%) |
30/06/12 |
(%) |
30/06/11 |
(%) |
30/06/10 |
(%) |
30/06/09 |
|
Weeks |
52 |
(%) |
52 |
(%) |
52 |
(%) |
52 |
(%) |
52 |
|
Currency |
GBP |
(%) |
GBP |
(%) |
GBP |
(%) |
GBP |
(%) |
GBP |
|
Consolidated A/cs |
N |
(%) |
N |
(%) |
N |
(%) |
N |
(%) |
N |
|
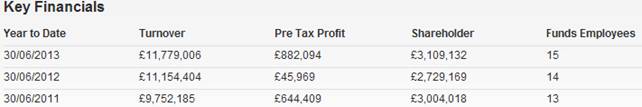
Turnover |
£11,779,006 |
5.6% |
£11,154,404 |
14.4% |
£9,752,185 |
5.1% |
£9,274,971 |
32.9% |
£6,977,312 |
|
Export |
- |
- |
- |
- |
- |
- |
- |
- |
- |
|
Cost of Sales |
- |
- |
- |
- |
- |
- |
- |
-100% |
£5,657,851 |
|
Gross Profit |
- |
- |
- |
- |
- |
- |
- |
- |
£1,319,461 |
|
Wages & Salaries |
£945,644 |
-11.9% |
£1,073,406 |
2.4% |
£1,048,213 |
6.9% |
£980,679 |
15.1% |
£852,132 |
|
Directors Emoluments |
£111,014 |
-57.5% |
£261,185 |
-6.5% |
£279,324 |
-15.3% |
£329,775 |
0.3% |
£328,921 |
|
Operating Profit |
£880,693 |
999.9% |
£43,605 |
-93.2% |
£643,147 |
65.2% |
£389,212 |
73.5% |
£224,394 |
|
Depreciation |
£8,562 |
-3.1% |
£8,834 |
-15.4% |
£10,443 |
-1.7% |
£10,621 |
-21.8% |
£13,586 |
|
Audit Fees |
£8,750 |
6.1% |
£8,250 |
1.2% |
£8,150 |
- |
£8,150 |
2.5% |
£7,950 |
|
Interest Payments |
- |
- |
- |
- |
- |
- |
- |
-100% |
£50 |
|
Pre Tax Profit |
£882,094 |
999.9% |
£45,969 |
-92.9% |
£644,409 |
65.5% |
£389,257 |
58.8% |
£245,103 |
|
Taxation |
-£202,131 |
-870.9% |
-£20,818 |
86.9% |
-£158,640 |
-74.4% |
-£90,955 |
-71.9% |
-£52,905 |
|
Profit After Tax |
£679,963 |
999.9% |
£25,151 |
-94.8% |
£485,769 |
62.8% |
£298,302 |
55.2% |
£192,198 |
|
Dividends Payable |
£300,000 |
- |
£300,000 |
- |
£300,000 |
- |
£300,000 |
- |
£300,000 |
|
Retained Profit |
£379,963 |
238.2% |
-£274,849 |
-248% |
£185,769 |
999.9% |
-£1,698 |
98.4% |
-£107,802 |
Balance Sheet
|
Date Of Accounts |
30/06/13 |
(%) |
30/06/12 |
(%) |
30/06/11 |
(%) |
30/06/10 |
(%) |
30/06/09 |
|
Tangible Assets |
£28,274 |
-4.3% |
£29,544 |
-15.2% |
£34,836 |
-1.1% |
£35,236 |
-21.2% |
£44,727 |
|
Intangible Assets |
0 |
- |
0 |
- |
0 |
- |
0 |
- |
0 |
|
Total Fixed Assets |
£28,274 |
-4.3% |
£29,544 |
-15.2% |
£34,836 |
-1.1% |
£35,236 |
-21.2% |
£44,727 |
|
Stock |
£3,025,395 |
10.9% |
£2,728,905 |
-4.5% |
£2,857,404 |
0.4% |
£2,845,163 |
33.1% |
£2,137,698 |
|
Trade Debtors |
£2,304,043 |
17.6% |
£1,958,689 |
19% |
£1,645,480 |
-0.2% |
£1,648,590 |
5% |
£1,570,761 |
|
Cash |
£263,706 |
-71.9% |
£939,665 |
10.3% |
£851,725 |
45.3% |
£586,378 |
-24% |
£771,194 |
|
Other Debtors |
£48,145 |
-22.2% |
£61,900 |
63.5% |
£37,863 |
8.2% |
£35,005 |
7.1% |
£32,695 |
|
Miscellaneous Current Assets |
0 |
- |
0 |
- |
0 |
- |
0 |
- |
0 |
|
Total Current Assets |
£5,641,289 |
-0.8% |
£5,689,159 |
5.5% |
£5,392,472 |
5.4% |
£5,115,136 |
13.4% |
£4,512,348 |
|
Trade Creditors |
£1,462,062 |
-27.1% |
£2,006,488 |
55.3% |
£1,291,874 |
6.5% |
£1,213,560 |
21.3% |
£1,000,860 |
|
Bank Loans & Overdrafts |
0 |
- |
0 |
- |
0 |
- |
0 |
- |
0 |
|
Other Short Term Finance |
£776,652 |
3.8% |
£748,454 |
10.2% |
£679,354 |
19.4% |
£569,024 |
70.6% |
£333,609 |
|
Miscellaneous Current Liabilities |
£321,717 |
37.1% |
£234,592 |
-48.1% |
£452,062 |
-17.7% |
£549,539 |
36.5% |
£402,659 |
|
Total Current Liabilities |
£2,560,431 |
-14.4% |
£2,989,534 |
23.4% |
£2,423,290 |
3.9% |
£2,332,123 |
34.3% |
£1,737,128 |
|
Bank Loans & Overdrafts and LTL |
0 |
- |
0 |
- |
0 |
- |
0 |
- |
0 |
|
Other Long Term Finance |
0 |
- |
0 |
- |
0 |
- |
0 |
- |
0 |
|
Total Long Term Liabilities |
0 |
- |
0 |
- |
0 |
- |
0 |
- |
0 |
Capital &
Reserves
|
Date Of Accounts |
30/06/13 |
(%) |
30/06/12 |
(%) |
30/06/11 |
(%) |
30/06/10 |
(%) |
30/06/09 |
|
Called Up Share Capital |
£3,000 |
- |
£3,000 |
- |
£3,000 |
- |
£3,000 |
- |
£3,000 |
|
P & L Account Reserve |
£3,100,132 |
14% |
£2,720,169 |
-9.2% |
£2,995,018 |
6.6% |
£2,809,249 |
-0.1% |
£2,810,947 |
|
Revaluation Reserve |
- |
- |
- |
- |
- |
- |
- |
- |
- |
|
Sundry Reserves |
£6,000 |
- |
£6,000 |
- |
£6,000 |
- |
£6,000 |
- |
£6,000 |
|
Shareholder Funds |
£3,109,132 |
13.9% |
£2,729,169 |
-9.1% |
£3,004,018 |
6.6% |
£2,818,249 |
-0.1% |
£2,819,947 |
Other Financial Items
|
Date Of Accounts |
30/06/13 |
(%) |
30/06/12 |
(%) |
30/06/11 |
(%) |
30/06/10 |
(%) |
30/06/09 |
|
Net Worth |
£3,109,132 |
13.9% |
£2,729,169 |
-9.1% |
£3,004,018 |
6.6% |
£2,818,249 |
-0.1% |
£2,819,947 |
|
Working Capital |
£3,080,858 |
14.1% |
£2,699,625 |
-9.1% |
£2,969,182 |
6.7% |
£2,783,013 |
0.3% |
£2,775,220 |
|
Total Assets |
£5,669,563 |
-0.9% |
£5,718,703 |
5.4% |
£5,427,308 |
5.4% |
£5,150,372 |
13% |
£4,557,075 |
|
Total Liabilities |
£2,560,431 |
-14.4% |
£2,989,534 |
23.4% |
£2,423,290 |
3.9% |
£2,332,123 |
34.3% |
£1,737,128 |
|
Net Assets |
£3,109,132 |
13.9% |
£2,729,169 |
-9.1% |
£3,004,018 |
6.6% |
£2,818,249 |
-0.1% |
£2,819,947 |
Cash Flow
|
Date Of Accounts |
30/06/13 |
(%) |
30/06/12 |
(%) |
30/06/11 |
(%) |
30/06/10 |
(%) |
30/06/09 |
|
Net Cashflow from Operations |
-£349,137 |
-163.7% |
£547,936 |
-17.6% |
£664,818 |
293.1% |
£169,124 |
-54.5% |
£371,992 |
|
Net Cashflow before Financing |
-£675,959 |
-868.7% |
£87,940 |
-66.9% |
£265,347 |
243.6% |
-£184,816 |
-71.8% |
-£107,587 |
|
Net Cashflow from Financing |
- |
- |
- |
- |
- |
- |
- |
- |
- |
|
Increase in Cash |
-£675,959 |
-868.7% |
£87,940 |
-66.9% |
£265,347 |
243.6% |
-£184,816 |
-71.8% |
-£107,587 |
Miscellaneous
|
Date Of Accounts |
30/06/13 |
(%) |
30/06/12 |
(%) |
30/06/11 |
(%) |
30/06/10 |
(%) |
30/06/09 |
|
Contingent Liability |
NO |
- |
NO |
- |
NO |
- |
NO |
- |
NO |
|
Capital Employed |
£3,109,132 |
13.9% |
£2,729,169 |
-9.1% |
£3,004,018 |
6.6% |
£2,818,249 |
-0.1% |
£2,819,947 |
|
Number of Employees |
15 |
7.1% |
14 |
7.7% |
13 |
18.2% |
11 |
- |
11 |
|
Auditors |
BAKER TILLY AUDIT LIMITED |
||||||||
|
Auditor Comments |
The audit report contains no adverse comments |
||||||||
|
Bankers |
HSBC BANK PLC |
||||||||
|
Bank Branch Code |
40-46-13 |
||||||||
Ratios
|
Date Of Accounts |
30/06/13 |
30/06/12 |
30/06/11 |
30/06/10 |
30/06/09 |
|
Pre-tax profit margin % |
7.49 |
0.41 |
6.61 |
4.20 |
3.51 |
|
Current ratio |
2.20 |
1.90 |
2.23 |
2.19 |
2.60 |
|
Sales/Net Working Capital |
3.82 |
4.13 |
3.28 |
3.33 |
2.51 |
|
Gearing % |
0 |
0 |
0 |
0 |
0 |
|
Equity in % |
54.80 |
47.70 |
55.40 |
54.70 |
61.90 |
|
Creditor Days |
45.18 |
65.47 |
48.21 |
47.62 |
52.21 |
|
Debtor Days |
71.20 |
63.91 |
61.41 |
64.69 |
81.94 |
|
Liquidity/Acid Test |
1.02 |
0.99 |
1.04 |
0.97 |
1.36 |
|
Return On Capital Employed % |
28.37 |
1.68 |
21.45 |
13.81 |
8.69 |
|
Return On Total Assets Employed % |
15.55 |
0.80 |
11.87 |
7.55 |
5.37 |
|
Current Debt Ratio |
0.82 |
1.09 |
0.80 |
0.82 |
0.61 |
|
Total Debt Ratio |
0.82 |
1.09 |
0.80 |
0.82 |
0.61 |
|
Stock Turnover Ratio % |
25.68 |
24.46 |
29.30 |
30.67 |
30.63 |
|
Return on Net Assets Employed % |
28.37 |
1.68 |
21.45 |
13.81 |
8.69 |
FOREIGN EXCHANGE RATES
N/a
ADDITIONAL INFORMATION
Status History
|
No Status History found |
Event History
|
Date |
Description |
|
24/01/2014 |
Annual Returns |
|
18/11/2013 |
New Accounts Filed |
|
03/07/2013 |
New Board Member Mr D. Kimberley appointed |
|
03/07/2013 |
New Board Member Mr S.I. Barrows appointed |
|
03/07/2013 |
New Board Member Mr M.J. Barrows appointed |
|
31/01/2013 |
Annual Returns |
|
30/11/2012 |
New Accounts Filed |
|
30/01/2012 |
Annual Returns |
|
13/01/2012 |
New Accounts Filed |
|
13/01/2012 |
New Accounts Filed |
|
28/01/2011 |
Annual Returns |
|
07/01/2011 |
New Accounts Filed |
|
19/02/2010 |
New Accounts Filed |
|
19/02/2010 |
New Accounts Filed |
|
03/03/2009 |
New Accounts Filed |
Previous Company
Names
|
Date |
Previous Name |
|
08/11/1993 |
CLARK DIAMONDS ( |
|
23/10/1984 |
SKYDREAM MARKETING LIMITED |
NOTES & COMMENTS
Commentary
|
No exact match CCJs are recorded against the company. |
|
|
There has been no significant change in the company's credit rating. |
|
|
Sales in the latest trading period increased 5.6% on the previous trading period. |
|
|
Net Worth increased by 13.9% during the latest trading period. |
|
|
A 0.9% decline in Total Assets occurred during the latest trading period. |
|
|
Pre-tax profits increased by 999.9% compared to the previous trading period. |
|
|
The company saw a decrease in their Cash Balance of 71.9% during the latest trading period. |
|
|
The audit report contains no adverse comments. |
|
|
The company has undergone recent changes in its directorships. |
|
|
The company is not part of a group. |
|
|
The company was established over 29 years ago. |
|
FOREIGN EXCHANGE RATES
|
Currency |
Unit
|
Indian Rupees |
|
US Dollar |
1 |
Rs.60.19 |
|
|
1 |
Rs.103.15 |
|
Euro |
1 |
Rs.81.87 |
INFORMATION DETAILS
|
Analysis Done by
: |
RAS |
|
|
|
|
Report Prepared
by : |
|
RATING EXPLANATIONS
|
RATING |
STATUS |
PROPOSED CREDIT LINE |
|
|
|
>86 |
Aaa |
Possesses an extremely sound financial base with the strongest
capability for timely payment of interest and principal sums |
Unlimited |
|
|
71-85 |
Aa |
Possesses adequate working capital. No caution needed for credit
transaction. It has above average (strong) capability for payment of interest
and principal sums |
Large |
|
|
56-70 |
A |
Financial &
operational base are regarded healthy. General unfavourable factors will not
cause fatal effect. Satisfactory capability for payment of interest and
principal sums |
Fairly Large |
|
|
41-55 |
Ba |
Overall operation is considered normal. Capable to meet normal
commitments. |
Satisfactory |
|
|
26-40 |
B |
Capability to overcome financial difficulties seems comparatively
below average. |
Small |
|
|
11-25 |
Ca |
Adverse factors are apparent. Repayment of interest and principal sums
in default or expected to be in default upon maturity |
Limited with
full security |
|
|
<10 |
C |
Absolute credit risk exists. Caution needed to be exercised |
Credit not
recommended |
|
|
-- |
NB |
New Business |
-- |
|
This score serves as a reference to assess SC’s credit risk
and to set the amount of credit to be extended. It is calculated from a
composite of weighted scores obtained from each of the major sections of this
report. The assessed factors and their relative weights (as indicated through
%) are as follows:
Financial
condition (40%) Ownership
background (20%) Payment
record (10%)
Credit history
(10%) Market trend
(10%) Operational
size (10%)
This report is issued at your request without any
risk and responsibility on the part of MIRA INFORM PRIVATE LIMITED (MIPL)
or its officials.