MIRA
INFORM REPORT
|
Report Date : |
12.07.2014 |
IDENTIFICATION DETAILS
|
Name : |
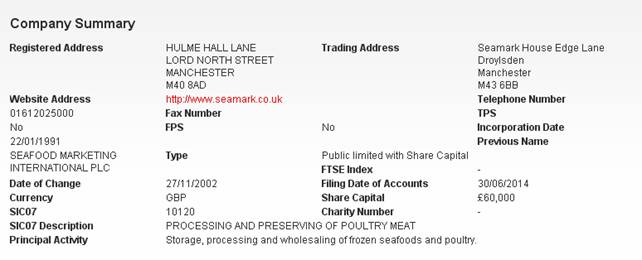
SEAMARK PLC |
|
|
|
|
Formerly Known As : |
SEAFOOD MARKETING INTERNATIONAL PLC |
|
|
|
|
Registered Office : |
|
|
|
|
|
Country : |
|
|
|
|
|
Financials (as on) : |
31.12.2012 |
|
|
|
|
Date of Incorporation : |
22.01.1991 |
|
|
|
|
Com. Reg. No.: |
02575875 |
|
|
|
|
Legal Form : |
Public limited with share capital |
|
|
|
|
Line of Business : |
·
Processing and preserving of poultry meat. ·
Storage, processing and wholesaling of frozen
seafoods and poultry. |
|
|
|
|
No. of Employees |
174 |
RATING & COMMENTS
|
MIRA’s Rating : |
B |
|
RATING |
STATUS |
PROPOSED CREDIT LINE |
|
|
26-40 |
B |
Capability to overcome financial difficulties seems comparatively
below average. |
Small |
|
Status : |
Moderate |
|
Payment Behaviour : |
Slow but correct |
|
Litigation : |
Clear |
NOTES :
Any query related to this report can be made
on e-mail : infodept@mirainform.com
while quoting report number, name and date.
ECGC Country Risk Classification List – March 31, 2014
|
Country Name |
Previous Rating (31.12.2013) |
Current Rating (31.03.2014) |
|
|
A1 |
A1 |
|
Risk Category |
ECGC
Classification |
|
Insignificant |
A1 |
|
Low Risk |
A2 |
|
Moderate Low Risk |
B1 |
|
Moderate Risk |
B2 |
|
Moderate High Risk |
C1 |
|
High Risk |
C2 |
|
Very High Risk |
D |
The
|
Source
: CIA |
Company name and address
Company Name: SEAMARK
PLC
Company No: 02575875
Company Status: Active - Accounts Filed
Registered
Address:
DIRECTORS/MANAGEMENT
|
Total Current Directors |
3 |
|
Total Current Secretaries |
1 |
|
Total Previous Directors / Company Secretaries |
2 |
Current Directors
|
Name |
Date of Birth |
09/01/1964 |
|
|
Officers Title |
Mr |
Nationality |
British |
|
Present Appointments |
8 |
Function |
Director |
|
Appointment Date |
22/01/1991 |
|
|
|
Address |
10 Sherbrook Rise, Wilmslow, |
||
|
Other Actions |
|
||
|
Name |
Date of Birth |
06/04/1960 |
|
|
Officers Title |
|
Nationality |
British |
|
Present Appointments |
6 |
Function |
Director |
|
Appointment Date |
22/01/1991 |
|
|
|
Address |
|
||
|
Other Actions |
|
||
|
Name |
Date of Birth |
04/08/1956 |
|
|
Officers Title |
|
Nationality |
British |
|
Present Appointments |
6 |
Function |
Director |
|
Appointment Date |
22/01/1991 |
|
|
|
Address |
|
||
|
Other Actions |
|
||
Current Company Secretary
|
Name |
Date of Birth |
09/01/1964 |
|
|
Officers Title |
Mr |
Nationality |
British |
|
Present Appointments |
8 |
Function |
Company Secretary |
|
Appointment Date |
22/01/1991 |
|
|
|
Address |
10 Sherbrook Rise, Wilmslow, |
||
NEGATIVE INFORMATION
Mortgage Summary
Total Mortgage 8
Outstanding 5
Satisfied 3
CCJ
|
Total Number of Exact CCJs - |
Total Value of Exact CCJs - |
|
|
Total Number of Possible CCJs - |
Total Value of Possible CCJs - |
|
|
Total Number of Satisfied CCJs - |
Total Value of Satisfied CCJs - |
|
|
Total Number of Writs - |
- |
|
Exact CCJ Details
|
Date |
Court |
Amount |
Status |
Case Number |
Date Paid |
|
25/10/2013 |
|
£1,169 |
Judgement |
3YQ51945 |
- |
Exact CCJ Details
|
Date |
Court |
Amount |
Status |
Case Number |
Date Paid |
|
25/10/2013 |
|
£1,169 |
Judgement |
3YQ51945 |
- |
Possible CCJs
Details
|
There are no possible CCJ details |
Writ Details
|
No writs found |
Mortgage Details
|
Mortgage Type: |
|
||
|
Date Charge Created: |
27/02/14 |
|
|
|
Date Charge Registered: |
28/02/14 |
|
|
|
Date Charge Satisfied: |
- |
|
|
|
Status: |
OUTSTANDING |
|
|
|
Person(s) Entitled: |
HSBC BANK PLC; |
||
|
Amount Secured: |
|
||
|
Details: |
NONENOTIFICATION OF ADDITION TO OR AMENDMENT OF CHARGE. |
||
|
Mortgage Type: |
|
||
|
Date Charge Created: |
28/06/13 |
|
|
|
Date Charge Registered: |
02/07/13 |
|
|
|
Date Charge Satisfied: |
- |
|
|
|
Status: |
OUTSTANDING |
|
|
|
Person(s) Entitled: |
HSBC INVOICE FINANCE ( |
||
|
Amount Secured: |
|
||
|
Details: |
CONTAINS FIXED CHARGE.CONTAINS FLOATINGCHARGE.FLOATING CHARGE COVERS ALL THE PROPERTY OR UNDERTAKING OF THE COMPANY.NOTIFICATION OF ADDITION TO OR AMENDMENT OF CHARGE. |
||
|
Mortgage Type: |
DEBENTURE |
||
|
Date Charge Created: |
28/05/08 |
|
|
|
Date Charge Registered: |
03/06/08 |
|
|
|
Date Charge Satisfied: |
- |
|
|
|
Status: |
OUTSTANDING |
|
|
|
Person(s) Entitled: |
HSBC BANK PLC |
||
|
Amount Secured: |
ALL MONIES DUE OR TO BECOME DUE FROM THE COMPANY TO THE CHARGEE ON ANY ACCOUNT WHATSOEVER |
||
|
Details: |
FIXED AND FLOATING CHARGE OVER THE UNDERTAKING AND ALL PROPERTY AND ASSETS PRESENT AND FUTURE, INCLUDING GOODWILL, BOOKDEBTS, UNCALLED CAPITAL, BUILDINGS, FIXTURES, FIXED PLANT & MACHINERY |
||
|
Mortgage Type: |
LEGAL CHARGE |
||
|
Date Charge Created: |
08/11/06 |
|
|
|
Date Charge Registered: |
09/11/06 |
|
|
|
Date Charge Satisfied: |
- |
|
|
|
Status: |
OUTSTANDING |
|
|
|
Person(s) Entitled: |
HSBC ASSET FINANCE ( |
||
|
Amount Secured: |
ALL MONIES DUE OR TO BECOME DUE FROM THE COMPANY TO THE CHARGEE ON ANY ACCOUNT WHATSOEVER |
||
|
Details: |
THE PROPERTY AT LAND ON THE NORTH EAST SIDE OF ALAN TURNING WAY MANCHESTER T/N GM974940 AND GM970097WITH THE BENEFIT OF ALL RIGHTS LICENCES GUARANTEES RENT DEPOSITS CONTRACTS DEEDS UNDERTAKINGS AND WARRANTIES RELATINGTO THE PROPERTY ANY SHARES OR MEMBERSHIP RIGHTS IN ANY MANAGEMENT COMPANY FOR THEPROPERTY ANY GOODWILL OF ANY BUSINESSFROM TIME TO TIME CARRIED ON AT THE PROPERTY ANY RENTAL AND OTHER MONEY PAYABLEUNDER ANY LEASE LICENCE OR OTHER INTEREST CREATED IN RESPECT OF THE PROPERTY AND ALLOTHER PAYMENTS WHATEVER IN RESPECTOF THE PROPERTY |
||
|
Mortgage Type: |
LEGAL MORTGAGE |
||
|
Date Charge Created: |
06/07/05 |
|
|
|
Date Charge Registered: |
07/07/05 |
|
|
|
Date Charge Satisfied: |
- |
|
|
|
Status: |
OUTSTANDING |
|
|
|
Person(s) Entitled: |
HSBC BANK PLC |
||
|
Amount Secured: |
ALL MONIES DUE OR TO BECOME DUE FROM THE COMPANY TO THE CHARGEE ON ANY ACCOUNT WHATSOEVER |
||
|
Details: |
L/H PROPERTY K/A ALAN TURING WAY MILES PLATTING MANCHESTER WITH THE BENEFIT OF ALL RIGHTS LICENCES GUARANTEES RENT DEPOSITS CONTRACTS DEEDS UNDERTAKINGS AND WARRANTIES RELATINGTO THE PROPERTY ANY SHARES OR MEMBERSHIP RIGHTS IN ANY MANAGEMENT COMPANY FOR THE PROPERTY ANY GOODWILL OF ANY BUSINESSFROMTIME TO TIME CARRIED ON AT THE PROPERTY ANY RENTAL AND OTHER MONEY PAYABLEUNDER ANY LEASE LICENCE OROTHER INTEREST CREATED IN RESPECT OF THE PROPERTY AND ALL OTHER PAYMENTS WHATEVER IN RESPECTOF THEPROPERTY |
||
|
Mortgage Type: |
DEBENTURE |
||
|
Date Charge Created: |
18/05/04 |
|
|
|
Date Charge Registered: |
25/05/04 |
|
|
|
Date Charge Satisfied: |
08/01/05 |
|
|
|
Status: |
SATISFIED |
|
|
|
Person(s) Entitled: |
HSBC BANK PLC |
||
|
Amount Secured: |
ALL MONIES DUE OR TO BECOME DUE FROM THE COMPANY TO THE CHARGEE ON ANY ACCOUNT WHATSOEVER |
||
|
Details: |
FIXED AND FLOATING CHARGES OVER THE UNDERTAKING AND ALL PROPERTY AND ASSETS PRESENT AND FUTURE INCLUDING GOODWILL BOOKDEBTS UNCALLED CAPITAL BUILDINGS FIXTURESFIXED PLANT AND MACHINERY |
||
|
Mortgage Type: |
LEGAL CHARGE |
||
|
Date Charge Created: |
08/10/97 |
|
|
|
Date Charge Registered: |
14/10/97 |
|
|
|
Date Charge Satisfied: |
24/08/11 |
|
|
|
Status: |
SATISFIED |
|
|
|
Person(s) Entitled: |
BARCLAYS BANK PLC |
||
|
Amount Secured: |
|
||
|
Details: |
LAND AND BUILDINGS AT EDGE LANE DROYLSDEN |
||
|
Mortgage Type: |
DEBENTURE |
||
|
Date Charge Created: |
28/05/92 |
|
|
|
Date Charge Registered: |
08/06/92 |
|
|
|
Date Charge Satisfied: |
24/08/11 |
|
|
|
Status: |
SATISFIED |
|
|
|
Person(s) Entitled: |
BARCLAYS BANK PLC |
||
|
Amount Secured: |
|
||
|
Details: |
(FOR FULL DETAILS REFER TO DOC M395)FIXED AND FLOATING CHARGES OVER THE UNDERTAKING AND ALL PROPERTYAND ASSETS PRESENT AND FUTURE INCLUDING GOODWILL BOOKDEBTS UNCALLED CAPITAL BUILDINGS FIXTURESFIXEDPLANT AND MACHINERY |
||
SHARE & SHARE CAPITAL
INFORMATION
Top 20 Shareholders
|
Name |
Currency |
Share Count |
Share Type |
Nominal Value |
% of Total Share Count |
|
IQBAL AHMED |
GBP |
16,000 |
ORDINARY |
1 |
26.67 |
|
BILAL AHMED |
GBP |
16,000 |
ORDINARY |
1 |
26.67 |
|
KAMAL AHMED |
GBP |
16,000 |
ORDINARY |
1 |
26.67 |
|
NASRIM SULTANA |
GBP |
4,000 |
ORDINARY |
1 |
6.67 |
|
SALMA AKTHER IQBAL |
GBP |
4,000 |
ORDINARY |
1 |
6.67 |
|
SAIRA AFROZ KOMOL |
GBP |
4,000 |
ORDINARY |
1 |
6.67 |
PAYMENT INFORMATION
Trade Debtors /
Bad Debt Summary
Total Number of Documented Trade 0
Total Value of Documented Trade £0
Trade Payment
Information
|
Average Invoice Value |
227 |
|
Invoices available |
423 |
|
Paid |
392 |
|
Outstanding |
31 |
Trade Payment Data is information that we collect from selected third party partners who send us information about their whole sales ledger.
|
Average Invoice Value |
£227 |
|
Invoices available |
423 |
|
Paid |
392 |
|
Outstanding |
31 |
|
Trade Payment Data is information that we collect from selected third party partners who send us information about their whole sales ledger. |
|
|
Within Terms |
0-30 Days |
31-60 Days |
61-90 Days |
91+ Days |
|
Paid |
69 |
162 |
140 |
20 |
1 |
|
Outstanding |
0 |
0 |
13 |
12 |
6 |
GROUP STRUCTURE & AFFILIATED
COMPANIES
Statistics
|
Group |
- |
|
Linkages |
|
|
Countries |
Summary
|
Holding Company |
- |
|
Ownership Status |
|
|
Ultimate Holding Company |
- |
Group structure
|
FINANCIAL INFORMATION
Profit & Loss
|
|
Date Of Accounts |
31/12/12 |
(%) |
31/12/11 |
(%) |
31/12/10 |
(%) |
31/12/09 |
(%) |
31/12/08 |
|
|
Weeks |
52 |
(%) |
52 |
(%) |
52 |
(%) |
52 |
(%) |
52 |
|
|
Currency |
GBP |
(%) |
GBP |
(%) |
GBP |
(%) |
GBP |
(%) |
GBP |
|
|
Consolidated A/cs |
N |
(%) |
N |
(%) |
N |
(%) |
N |
(%) |
N |
|
|
Turnover |
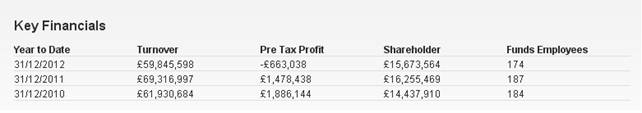
£59,845,598 |
-13.7% |
£69,316,997 |
11.9% |
£61,930,684 |
18.4% |
£52,303,771 |
14.5% |
£45,699,689 |
|
|
Export |
£41,690,855 |
-14.7% |
£48,885,432 |
296.4% |
£12,333,850 |
-62.2% |
£32,636,229 |
4.7% |
£31,181,125 |
|
|
Cost of Sales |
£57,132,688 |
-8.9% |
£62,702,084 |
16.4% |
£53,890,185 |
16% |
£46,438,694 |
13.3% |
£40,982,550 |
|
|
Gross Profit |
£2,712,910 |
-59% |
£6,614,913 |
-17.7% |
£8,040,499 |
37.1% |
£5,865,077 |
24.3% |
£4,717,139 |
|
|
Wages & Salaries |
£3,287,623 |
29.9% |
£2,531,028 |
-33.4% |
£3,803,162 |
42.2% |
£2,674,390 |
-0.8% |
£2,695,185 |
|
|
Directors Emoluments |
£373,000 |
- |
£373,000 |
-59.2% |
£913,539 |
238.9% |
£269,595 |
5.7% |
£255,095 |
|
|
Operating Profit |
-£129,173 |
-106.5% |
£1,984,561 |
-22.6% |
£2,564,474 |
17.1% |
£2,189,451 |
110.6% |
£1,039,684 |
|
|
Depreciation |
£565,121 |
0% |
£565,211 |
-6.2% |
£602,636 |
-8.5% |
£658,812 |
-1.6% |
£669,621 |
|
|
Audit Fees |
£11,700 |
- |
£11,700 |
-55% |
£26,000 |
-3.7% |
£27,000 |
58.8% |
£17,000 |
|
|
Interest Payments |
£533,865 |
5.5% |
£506,123 |
-26.8% |
£691,411 |
15.9% |
£596,371 |
-35.6% |
£925,626 |
|
|
Pre Tax Profit |
-£663,038 |
-144.8% |
£1,478,438 |
-21.6% |
£1,886,144 |
18% |
£1,598,305 |
969% |
£149,521 |
|
|
Taxation |
£133,933 |
132.7% |
-£410,027 |
36.4% |
-£644,481 |
-19.3% |
-£540,334 |
-426% |
-£102,717 |
|
|
Profit After Tax |
-£529,105 |
-149.5% |
£1,068,411 |
-14% |
£1,241,663 |
17.4% |
£1,057,971 |
999.9% |
£46,804 |
|
|
Dividends Payable |
- |
- |
- |
- |
- |
- |
- |
- |
- |
|
|
Retained Profit |
-£529,105 |
-149.5% |
£1,068,411 |
-14% |
£1,241,663 |
17.4% |
£1,057,971 |
999.9% |
£46,804 |
Balance Sheet
|
|
Date Of Accounts |
31/12/12 |
(%) |
31/12/11 |
(%) |
31/12/10 |
(%) |
31/12/09 |
(%) |
31/12/08 |
|
|
Tangible Assets |
£10,053,083 |
-3.3% |
£10,400,033 |
-3.8% |
£10,808,299 |
-9.7% |
£11,974,917 |
-4.9% |
£12,595,650 |
|
|
Intangible Assets |
0 |
- |
0 |
- |
0 |
- |
0 |
- |
0 |
|
|
Total Fixed Assets |
£10,053,083 |
-3.3% |
£10,400,033 |
-3.8% |
£10,808,299 |
-9.7% |
£11,974,917 |
-4.9% |
£12,595,650 |
|
|
Stock |
£11,405,621 |
-41.1% |
£19,361,708 |
45% |
£13,348,852 |
9.8% |
£12,153,080 |
-6% |
£12,933,773 |
|
|
Trade Debtors |
£5,659,588 |
-21.3% |
£7,190,177 |
-0.5% |
£7,228,704 |
53.2% |
£4,719,047 |
-18.2% |
£5,770,765 |
|
|
Cash |
£46,222 |
999.9% |
£200 |
-99.3% |
£28,835 |
999.9% |
£467 |
-98.2% |
£26,279 |
|
|
Other Debtors |
£5,715,749 |
0.6% |
£5,684,132 |
30.6% |
£4,352,184 |
178.6% |
£1,562,163 |
2.8% |
£1,519,105 |
|
|
Miscellaneous Current Assets |
0 |
- |
0 |
- |
0 |
- |
0 |
- |
0 |
|
|
Total Current Assets |
£22,827,180 |
-29.2% |
£32,236,217 |
29.2% |
£24,958,575 |
35.4% |
£18,434,757 |
-9% |
£20,249,922 |
|
|
Trade Creditors |
£1,681,153 |
-23.7% |
£2,204,095 |
105.3% |
£1,073,354 |
-75.1% |
£4,316,179 |
-53% |
£9,177,629 |
|
|
Bank Loans & Overdrafts |
£6,547,081 |
6% |
£6,174,195 |
11.8% |
£5,522,235 |
2.7% |
£5,379,329 |
53.8% |
£3,497,527 |
|
|
Other Short Term Finance |
£6,076,024 |
-37.5% |
£9,725,293 |
351.8% |
£2,152,453 |
488.3% |
£365,874 |
2.3% |
£357,679 |
|
|
Miscellaneous Current Liabilities |
£809,917 |
-84.4% |
£5,189,698 |
-32% |
£7,633,641 |
609.7% |
£1,075,561 |
171.8% |
£395,673 |
|
|
Total Current Liabilities |
£15,114,175 |
-35.1% |
£23,293,281 |
42.2% |
£16,381,683 |
47.1% |
£11,136,943 |
-17.1% |
£13,428,508 |
|
|
Bank Loans & Overdrafts and LTL |
£8,639,605 |
-6.7% |
£9,261,695 |
-11.5% |
£10,469,516 |
-8.6% |
£11,455,813 |
6.3% |
£10,776,315 |
|
|
Other Long Term Finance |
0 |
- |
0 |
-100% |
£2,958 |
-93.1% |
£42,930 |
-88.8% |
£383,794 |
|
Total Long Term Liabilities |
£2,092,524 |
-32.2% |
£3,087,500 |
-37.6% |
£4,947,281 |
-18.6% |
£6,076,484 |
-16.5% |
£7,278,788 |
.
Capital & Reserves
|
|
Date Of Accounts |
31/12/12 |
(%) |
31/12/11 |
(%) |
31/12/10 |
(%) |
31/12/09 |
(%) |
31/12/08 |
|
|
Called Up Share Capital |
£60,000 |
- |
£60,000 |
- |
£60,000 |
- |
£60,000 |
- |
£60,000 |
|
|
P & L Account Reserve |
£14,917,216 |
-3.4% |
£15,446,321 |
7.4% |
£14,377,910 |
9.5% |
£13,136,247 |
8.8% |
£12,078,276 |
|
|
Revaluation Reserve |
- |
- |
- |
- |
- |
- |
- |
- |
- |
|
|
Sundry Reserves |
£696,348 |
-7% |
£749,148 |
- |
- |
- |
- |
- |
- |
|
|
Shareholder Funds |
£15,673,564 |
-3.6% |
£16,255,469 |
12.6% |
£14,437,910 |
9.4% |
£13,196,247 |
8.7% |
£12,138,276 |
Other Financial Items
|
|
Date Of Accounts |
31/12/12 |
(%) |
31/12/11 |
(%) |
31/12/10 |
(%) |
31/12/09 |
(%) |
31/12/08 |
|
|
Net Worth |
£15,673,564 |
-3.6% |
£16,255,469 |
12.6% |
£14,437,910 |
9.4% |
£13,196,247 |
8.7% |
£12,138,276 |
|
|
Working Capital |
£7,713,005 |
-13.8% |
£8,942,936 |
4.3% |
£8,576,892 |
17.5% |
£7,297,814 |
7% |
£6,821,414 |
|
|
Total Assets |
£32,880,263 |
-22.9% |
£42,636,250 |
19.2% |
£35,766,874 |
17.6% |
£30,409,674 |
-7.4% |
£32,845,572 |
|
|
Total Liabilities |
£17,206,699 |
-34.8% |
£26,380,781 |
23.7% |
£21,328,964 |
23.9% |
£17,213,427 |
-16.9% |
£20,707,296 |
|
|
Net Assets |
£15,673,564 |
-3.6% |
£16,255,469 |
12.6% |
£14,437,910 |
9.4% |
£13,196,247 |
8.7% |
£12,138,276 |
Cash Flow
|
|
Date Of Accounts |
31/12/12 |
(%) |
31/12/11 |
(%) |
31/12/10 |
(%) |
31/12/09 |
(%) |
31/12/08 |
|
|
Net Cashflow from Operations |
£1,851,967 |
68.1% |
£1,101,530 |
-61.9% |
£2,888,292 |
490.7% |
£488,982 |
-92.6% |
£6,613,917 |
|
|
Net Cashflow before Financing |
£631,327 |
56.7% |
£402,847 |
-68.9% |
£1,294,819 |
343.6% |
-£531,473 |
-109.6% |
£5,508,450 |
|
|
Net Cashflow from Financing |
-£1,046,431 |
3.4% |
-£1,083,442 |
23.1% |
-£1,409,356 |
-2.4% |
-£1,376,141 |
-923% |
-£134,526 |
|
|
Increase in Cash |
-£415,104 |
39% |
-£680,595 |
-494.2% |
-£114,537 |
94% |
-£1,907,614 |
-135.5% |
£5,373,924 |
Miscellaneous
|
|
Date Of Accounts |
31/12/12 |
(%) |
31/12/11 |
(%) |
31/12/10 |
(%) |
31/12/09 |
(%) |
31/12/08 |
|
|
Contingent Liability |
YES |
- |
YES |
- |
YES |
- |
YES |
- |
YES |
|
|
Capital Employed |
£17,766,088 |
-8.2% |
£19,342,969 |
-0.2% |
£19,385,191 |
0.6% |
£19,272,731 |
-0.7% |
£19,417,064 |
|
|
Number of Employees |
174 |
-7% |
187 |
1.6% |
184 |
10.8% |
166 |
2.5% |
162 |
|
|
Auditors |
BDO LLP |
||||||||
|
|
Auditor Comments |
The audit report contains no adverse comments |
||||||||
|
|
Bankers |
HSBC BANK PLC |
||||||||
|
|
Bank Branch Code |
20-55-34 |
||||||||
Ratios
|
|
Date Of Accounts |
31/12/12 |
31/12/11 |
31/12/10 |
31/12/09 |
31/12/08 |
|
|
Pre-tax profit margin % |
-1.11 |
2.13 |
3.05 |
3.06 |
0.33 |
|
|
Current ratio |
1.51 |
1.38 |
1.52 |
1.66 |
1.51 |
|
|
Sales/Net Working Capital |
7.76 |
7.75 |
7.22 |
7.17 |
6.70 |
|
|
Gearing % |
55.10 |
57 |
72.50 |
86.80 |
88.80 |
|
|
Equity in % |
47.70 |
38.10 |
40.40 |
43.40 |
37 |
|
|
Creditor Days |
10.22 |
11.57 |
6.30 |
30.03 |
73.10 |
|
|
Debtor Days |
34.42 |
37.75 |
42.48 |
32.84 |
45.96 |
|
|
Liquidity/Acid Test |
0.75 |
0.55 |
0.70 |
0.56 |
0.54 |
|
|
Return On Capital Employed % |
-3.73 |
7.64 |
9.72 |
8.29 |
0.77 |
|
|
Return On Total Assets Employed % |
-2.01 |
3.46 |
5.27 |
5.25 |
0.45 |
|
|
Current Debt Ratio |
0.96 |
1.43 |
1.13 |
0.84 |
1.10 |
|
|
Total Debt Ratio |
1.09 |
1.62 |
1.47 |
1.30 |
1.70 |
|
|
Stock Turnover Ratio % |
19.05 |
27.93 |
21.55 |
23.23 |
28.30 |
|
|
Return on Net Assets Employed % |
-4.23 |
9.09 |
13.06 |
12.11 |
1.23 |
FOREIGN EXCHANGE RATES
Na
ADDITIONAL INFORMATION
Commentary
|
CCJ recorded against the company. |
|
|
The company's credit rating has increased from not rated to 41 which indicates it is creditworthy. |
|
|
Sales in the latest trading period decreased 13.7% on the previous trading period. |
|
|
Net Worth decreased by 3.6% during the latest trading period. |
|
|
A 22.9% decline in Total Assets occurred during the latest trading period. |
|
|
Pre-tax profits decreased by 144.8% compared to the previous trading period. |
|
|
The company saw an increase in their Cash Balance of 999.9% during the latest trading period. |
|
|
The audit report contains no adverse comments. |
|
|
No recent changes in directorship are recorded. |
|
|
The company is not part of a group. |
|
|
The company was established over 23 years ago. |
|
Enquiries Trend
|
There have been 195 enquiries in the last 12 months. |
|
There are an average of 16 reports taken each month. |
|
|
3 MONTHS |
6 MONTHS |
9 MONTHS |
|
Enquiries |
33 |
80 |
140 |
Status History
|
No Status History found |
Event History
|
Date |
Description |
|
01/04/2014 |
Annual Returns |
|
09/12/2013 |
New Accounts Filed |
|
09/12/2013 |
New Accounts Filed |
|
19/02/2013 |
Annual Returns |
|
10/07/2012 |
New Accounts Filed |
|
10/07/2012 |
New Accounts Filed |
|
30/01/2012 |
Annual Returns |
|
25/07/2011 |
New Accounts Filed |
|
25/07/2011 |
New Accounts Filed |
|
23/02/2011 |
Annual Returns |
|
23/08/2010 |
New Accounts Filed |
|
19/02/2010 |
Annual Returns |
|
27/11/2009 |
New Accounts Filed |
|
27/11/2009 |
New Accounts Filed |
|
02/03/2009 |
Annual Returns |
Previous Company
Names
|
Date |
Previous Name |
|
27/11/2002 |
SEAFOOD MARKETING INTERNATIONAL PLC |
Previous
Director/Company Secretaries
|
Name |
Current Directorships |
Previous Directorships |
|
1697 |
53451 |
|
|
1799 |
53393 |
NOTES & COMMENTS
Na
FOREIGN EXCHANGE RATES
|
Currency |
Unit
|
Indian Rupees |
|
US Dollar |
1 |
Rs.60.19 |
|
|
1 |
Rs.103.15 |
|
Euro |
1 |
Rs.81.87 |
INFORMATION DETAILS
|
Analysis Done by
: |
SUB |
|
|
|
|
Report Prepared
by : |
NIS |
RATING EXPLANATIONS
|
RATING |
STATUS |
PROPOSED CREDIT LINE |
|
|
|
>86 |
Aaa |
Possesses an extremely sound financial base with the strongest
capability for timely payment of interest and principal sums |
Unlimited |
|
|
71-85 |
Aa |
Possesses adequate working capital. No caution needed for credit
transaction. It has above average (strong) capability for payment of interest
and principal sums |
Large |
|
|
56-70 |
A |
Financial & operational base are regarded healthy. General
unfavourable factors will not cause fatal effect. Satisfactory capability for
payment of interest and principal sums |
Fairly Large |
|
|
41-55 |
Ba |
Overall operation is considered normal. Capable to meet normal
commitments. |
Satisfactory |
|
|
26-40 |
B |
Capability to overcome
financial difficulties seems comparatively below average. |
Small |
|
|
11-25 |
Ca |
Adverse factors are apparent. Repayment of interest and principal sums
in default or expected to be in default upon maturity |
Limited with
full security |
|
|
<10 |
C |
Absolute credit risk exists. Caution needed to be exercised |
Credit not
recommended |
|
|
-- |
NB |
New Business |
-- |
|
This score serves as a reference to assess SC’s credit risk and
to set the amount of credit to be extended. It is calculated from a composite
of weighted scores obtained from each of the major sections of this report. The
assessed factors and their relative weights (as indicated through %) are as
follows:
Financial
condition (40%) Ownership
background (20%) Payment
record (10%)
Credit history
(10%) Market trend
(10%) Operational
size (10%)
This report is issued at your request without any
risk and responsibility on the part of MIRA INFORM PRIVATE LIMITED (MIPL)
or its officials.