MIRA
INFORM REPORT
|
Report Date : |
16.07.2014 |
IDENTIFICATION DETAILS
|
Name : |
HIMACHAL FUTURISTIC COMMUNICATIONS LIMITED |
|
|
|
|
Registered
Office : |
8, Electronics
Complex, Chambaghat, Solan – 173 213, Himachal Pradesh |
|
|
|
|
Country : |
|
|
|
|
|
Financials (as
on) : |
31.03.2013 |
|
|
|
|
Date of
Incorporation : |
11.05.1987 |
|
|
|
|
Com. Reg. No.: |
06-007466 |
|
|
|
|
Capital
Investment / Paid-up Capital : |
Rs.2044.377
millions |
|
|
|
|
CIN No.: [Company Identification No.] |
L64200HP1987PLC007466 |
|
|
|
|
TAN No.: [Tax Deduction &
Collection Account No.] |
DELH04057E |
|
|
|
|
PAN No.: [Permanent Account No.] |
AAACH4041D |
|
|
|
|
Legal Form : |
A Public Limited Liability Company. The Company’s Shares are Listed on
the Stock Exchanges. |
|
|
|
|
Line of Business
: |
Manufacturing of telecom products, executing turnkey contracts and
providing services relating thereto. |
|
|
|
|
No. of Employees
: |
1575 (Approximately) |
RATING & COMMENTS
|
MIRA’s Rating : |
Ba (43) |
|
RATING |
STATUS |
PROPOSED CREDIT LINE |
|
|
41-55 |
Ba |
Overall operation is considered normal. Capable to meet normal
commitments. |
Satisfactory |
|
Maximum Credit Limit : |
USD 28000000 |
|
|
|
|
Status : |
Satisfactory |
|
|
|
|
Payment Behaviour : |
Usually correct |
|
|
|
|
Litigation : |
Clear |
|
|
|
|
Comments : |
Subject is an established company having satisfactory track record. General financial position of the company is normal and acceptable for
business dealing. Trade relations are reported as fair. Business is active. Payments
terms are reported to be usually correct. The company can be considered normal for business dealings at usual
trade terms and conditions. |
NOTES :
Any query related to this report can be made
on e-mail : infodept@mirainform.com
while quoting report number, name and date.
ECGC Country Risk Classification List – March 31, 2014
|
Country Name |
Previous Rating (31.12.2013) |
Current Rating (31.03.2014) |
|
|
A1 |
A1 |
|
Risk Category |
ECGC
Classification |
|
Insignificant |
A1 |
|
Low |
A2 |
|
Moderate |
B1 |
|
High |
B2 |
|
Very High |
C1 |
|
Restricted |
C2 |
|
Off-credit |
D |
INDIAN ECONOMIC OVERVIEW
N E W S
The economy grew 4.7 %in 2013/14, marking a
second straight year of sub-5 % growth – the worst slowdown in more than a quarter
of a century. The data was below an official estimate of 4.9 % annual growth
and compared with 4.5 % in the last fiscal year. However, the current account
deficit narrowed sharply to $ 32.4 billion at 1.7 % of gross domestic product,
in 2013/14 from a record high of $ 98.8 billion or 4.7 %, the year before.A
sharp fall in gold imports due to restrictions on overseas purchases and muted
import of capital goods helped shrink the current account deficit.
Online retailer Flipkart has acquired fashion
portal Myntra as it prepares to battle with the rapidly expanding
General Motors will start exporting vehicles
from its Talegaon plant near Pune in the second half of 2014. GM was one of the
few global carmakers that was using its India plant only for the domestic
market.
Google has overtaken Apple as the world’s top
brand in terms of value, according to global market research agency Millward
Brown. Google’s brand value shot up 40 % in a year to $ 158.84 billion. The top
10 of the 100 slots were dominated by US companies.
Infosys lost another heavy weight when B G
Srinivas, a board member put in his papers. He is the third CEO-hopeful to quit
after Chairman N R Narayana Murthy’s return to the company – Ashok Vemuri and V
Balakrishnan being the other two.While Vemuri went on to lead IGate,
Balakrishnan joined politics.
Naresh Goyal – promoted Jet Airways posted
biggest quarterly loss – Rs 2153.37 crore – in the three months ended March 31,
mainly because it has been offering discounts to passengers to fill planes.
William S Pinckney – Chairman and CEO of
Amway India was arrested by the Andhra Pradesh Police in connection with a
complaint against the direct selling firm. This is the second time that he has
been taken into custody. A year, ago the Kerala Police had arrested Pinckney
and two company directors on charges of financial irregularities.
China has told its state-owned enterprises to
sever links with American consulting firms after the United States charged five
Chinese military officers wih hacking US companies. China’s action which
targets consultancies like McKinsey & Co. and the Boston Consulting Group,
sterns from fears that the first are providing trade secrets to the US
governments.
India has emerged as a country with some of
the highest unregistered businesses in the world. Indonesia has the maximum
number of shadow businesses, says a study of 68 countries by Imperial College
Business School in London.
Pfizer has abandoned its attempt to buy
AstraZeneca for nearly $ 118 billion after the latter refused an offer of 55
pounds a share.
EXTERNAL AGENCY RATING
|
Rating Agency Name |
CARE |
|
Rating |
Long term Bank Facilities = BB+ [Revised from (BB)] |
|
Rating Explanation |
Moderate risk of default |
|
Date |
24.03.2014 |
RBI DEFAULTERS’ LIST STATUS
Subject’s name is not enlisted as a defaulter
in the publicly available RBI Defaulters’ list.
EPF (Employee Provident Fund) DEFAULTERS’ LIST STATUS
Subject’s name is not enlisted as a defaulter
in the publicly available EPF (Employee Provident Fund) Defaulters’ list as of
31-03-2014.
INFORMATION DECLINED
Management Non Corporative (91-11-30882624)
LOCATIONS
|
Registered Office/ Factory 1 : |
8, Electronics
Complex, Chambaghat, Solan – 173 213, |
|
Tel. No.: |
91-1792-230643/ 44/ 45 |
|
Fax No.: |
91-1792-231902 |
|
E-Mail : |
|
|
Website : |
|
|
|
|
|
Corporate Office/ Administrative Office/ Factory 2 : |
8, Commercial Complex, Masjid Moth, Greater Kailash – II, |
|
Tel. No.: |
91-11-30882624/ 30882626/ 29216298/ 29222624 |
|
Fax No.: |
91-11-30689013/ 29224448 |
|
|
|
|
Factory 3 (Optical Fibre Cable Plant) : |
Cable Division, L 35-37, Industrial Area Phase – II, Verna Electronics
City, Salcete, Goa - 403 722, India |
|
Tel. No.: |
91-832-6697000-08 91-832-6697021 (Direct) |
|
Fax No.: |
91-832-2783444 |
DIRECTORS
As on 31.03.2013
|
Name : |
Mr. Mahendra
Pratap Shukla |
|
Designation : |
Non Executive
Chairman |
|
|
|
|
Name : |
Mr. Mahendra
Nahata |
|
Designation : |
Managing
Director |
|
|
|
|
Name : |
Mr. Arvind Kharabanda
|
|
Designation : |
Director
(Finance) |
|
Date of Birth/ Age : |
09.03.1947 |
|
Qualification : |
Chartered
Accountant |
|
Expertise in
specific functional areas : |
Mr. Arvind
Kharabanda has got over 37 years experience in managerial positions, project
implementation and finance. |
|
Date of
Appointment : |
30.10.2004 |
|
|
|
|
Name : |
Dr. R.M. Kastia |
|
Designation : |
Director |
|
Date of Birth/ Age : |
10.10.1941 |
|
Qualification : |
Ph.D., FBIM ( |
|
Expertise in
specific functional areas : |
Dr. Kastia has
to his credit more than 49 years of business experience. Dr. Kastia has
occupied various important positions in well known industries. He has in
depth knowledge of manufacturing of telecom equipments. |
|
Directorship in
other Public Companies : |
HTL Limited |
|
Date of
Appointment : |
07.02.1996 |
|
|
|
|
Name : |
Mr. Y.L. Agarwal
|
|
Designation : |
Director |
|
|
|
|
Name : |
Mr. S.G. Nadkarni |
|
Designation : |
Nominee Director (IDBI) (w.e.f. 28.02.2012) |
KEY EXECUTIVES
|
Name : |
Mr. Manoj Baid |
|
Designation : |
Associate Vice-President (Corporate) and Company Secretary |
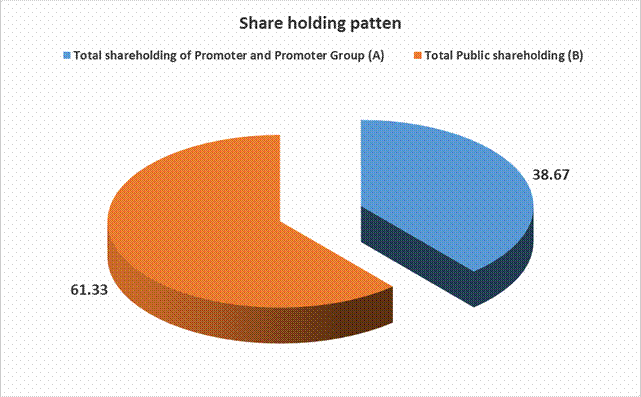
MAJOR SHAREHOLDERS / SHAREHOLDING PATTERN
As on 31.03.2014
|
Category of Shareholders |
No. of Shares |
Percentage of Holding |
|
(A) Shareholding of Promoter and Promoter Group |
|
|
|
|
|
|
|
|
638344 |
0.05 |
|
|
478660870 |
38.62 |
|
|
479299214 |
38.67 |
|
|
|
|
|
Total shareholding of Promoter and Promoter Group (A) |
479299214 |
38.67 |
|
(B) Public Shareholding |
|
|
|
|
|
|
|
|
384520 |
0.03 |
|
|
217189310 |
17.52 |
|
|
521000 |
0.04 |
|
|
4555035 |
0.37 |
|
|
6025 |
0.00 |
|
|
5305 |
0.00 |
|
|
720 |
0.00 |
|
|
222655890 |
17.97 |
|
|
|
|
|
|
264023833 |
21.30 |
|
|
|
|
|
|
158613019 |
12.80 |
|
|
113059661 |
9.12 |
|
|
1725577 |
0.14 |
|
|
138560 |
0.01 |
|
|
43250 |
0.00 |
|
|
1543767 |
0.12 |
|
|
537422090 |
43.36 |
|
Total Public shareholding (B) |
760077980 |
61.33 |
|
Total (A)+(B) |
1239377194 |
100.00 |
|
(C) Shares held by Custodians and against which Depository
Receipts have been issued |
0 |
0.00 |
|
|
0 |
0.00 |
|
|
0 |
0.00 |
|
|
0 |
0.00 |
|
Total (A)+(B)+(C) |
1239377194 |
0.00 |
BUSINESS DETAILS
|
Line of Business : |
Manufacturing of telecom products, executing turnkey contracts and providing
services relating thereto. |
||||||||||||
|
|
|
||||||||||||
|
Products : |
|
||||||||||||
|
|
|
||||||||||||
|
Exports : |
Not Divulged |
||||||||||||
|
|
|
||||||||||||
|
Imports : |
Not Divulged |
GENERAL INFORMATION
|
Suppliers : |
Not Divulged |
||||||||||||||||||||||||||||||||||||||||||||||||
|
|
|
||||||||||||||||||||||||||||||||||||||||||||||||
|
Customers : |
· Nokia Siemens Networks · Ericsson · Huawei · Alcatel-Lucent · Reliance Communications · Airtel · Aircel · Docomo · Idea · Videocon · BSNL · MTNL · BHEL · NTPC · Indian Oil · GSPC · Bharat Petroleum · ABB · Tata Power · D-Link · Reliance Energy · Larsent and Toubro |
||||||||||||||||||||||||||||||||||||||||||||||||
|
|
|
||||||||||||||||||||||||||||||||||||||||||||||||
|
No. of Employees : |
1575 (Approximately) |
||||||||||||||||||||||||||||||||||||||||||||||||
|
|
|
||||||||||||||||||||||||||||||||||||||||||||||||
|
Bankers : |
· State Bank of India · Oriental Bank of Commerce · Punjab National Bank · Bank of Baroda · Union Bank of India |
||||||||||||||||||||||||||||||||||||||||||||||||
|
|
|
||||||||||||||||||||||||||||||||||||||||||||||||
|
Facilities : |
(Rs.
In Millions)
|
||||||||||||||||||||||||||||||||||||||||||||||||
|
|
|
|
Banking
Relations : |
--- |
|
|
|
|
Auditors : |
|
|
Name : |
Khandelwal Jain and Company Chartered Accountants |
|
Address : |
12-B, Baldota Bhawan, 117, |
|
|
|
|
Subsidiaries: : |
· HTL Limited ·
Moneta Finance Private Limited |
|
|
|
|
Associates: |
· Exicom Tele-systems Limited · HFCL Satellite Communications Limited · HFCL Dacom Infochek Limited (HDIL) · HFCL Bezeq Telecom Limited · Westel Wireless Limited · Polixel Security Systems Private Limited · DragonWave HFCL India Private Limited · ANM Enginnering and Works Private Limited ·
NextWave Communications Private Limited |
CAPITAL STRUCTURE
As on 31.03.2013
Authorised Capital :
|
No. of Shares |
Type |
Value |
Amount |
|
5100000000 |
Equity Shares |
Re.1/- each |
Rs.5100.000 millions |
|
25000000 |
Redeemable Preference Shares |
Rs.100/- each |
Rs.2500.000 millions |
|
|
Total |
|
Rs.7600.000
millions |
|
|
|
|
|
Issued & Subscribed Capital :
|
No. of Shares |
Type |
Value |
Amount |
|
1239377194 |
Equity Shares |
Re.1/- each |
Rs.1239.377 millions
|
|
8050000 |
6.5% Cumulative Redeemable Preference Shares |
Rs.100/-
each |
Rs.805.000
millions |
|
|
Total |
|
Rs.2044.377 millions |
|
|
|
|
|
Paid-up Capital :
|
No. of Shares |
Type |
Value |
Amount |
|
1239377194 |
Equity Shares |
Re.1/- each |
Rs.1239.377
millions |
|
8050000 |
6.5% Cumulative Redeemable Preference Shares |
Rs.100/-
each |
Rs.805.000
millions |
|
|
Total |
|
Rs.2044.377 millions |
|
|
|
|
|
A. Equity Shares
(i) 278,180 shares
of Re.1/- each represent Global Depository Receipts.
(ii) 14,550,000
shares of Re.1/- each issued for consideration other than cash pursuant to the
amalgamation of erstwhile Himachal Telematics Limited with the Company.
(iii) 529,601,640
shares of Re.1/- each have been allotted for a consideration other than cash
pursuant to the Composite Scheme of Arrangement and Amalgamation between
Sunvision Engineering Company Private Limited (SECPL) its share holders and the
Optionally Convertible Debenture (OCD) holders and the Company and its
shareholders sanctioned by the Hon'ble High Court of Himachal Pradesh at Shimla
vide its order passed on 5th January, 2011.
B. Preference
Shares
The Cumulative
Redeemable Preference Shares (CRPS) aggregating to Rs. 805,000 shall be
redeemed at the rate of 25% and 75% of the face value in the financial years
ending 31st March 2018 and 31st March, 2019, respectively
and will carry the coupon rate of 6.50% from new cut off date i.e. 1st
January 2011. However, dividend accrued on notional basis, as same has not been
declared and fallen due for payment, and penal interest thereon, till the
cut-off date, stands waived as per CDR rework package.
C. (i) Shareholders holding more than 5 percent of Equity Shares
|
Name of
Shareholder |
Figures as at 31st
March, 2013 |
|
|
No. of share held |
||
|
NextWave Communications Private Limited |
|
234765 |
|
|
% of Holding |
18.94% |
|
ANM Engineering and Works Private Limited |
|
234765 |
|
|
% of Holding |
18.94% |
|
IDBI Bank Limited |
|
150945 |
|
|
% of Holding |
12.18% |
|
Oriental Bank of Commerce |
|
82825 |
|
|
% of Holding |
6.68% |
(ii) Shareholders holding more than 5 percent of Preference Shares
|
Name of
Shareholder |
Figures as at 31st
March, 2013 |
|
|
No. of share held |
||
|
General Insurance Corporation of India Limited |
|
500000 |
|
|
% of Holding |
6.21% |
|
Digivive Contents Services (Private) Limited |
|
2950000 |
|
|
% of Holding |
36.65% |
|
IDBI Bank Limited |
|
3500000 |
|
|
% of Holding |
43.48% |
|
Oriental Bank of Commerce |
|
600000 |
|
|
% of Holding |
7.45% |
D. Statement of Reconciliation of equity capital is set below:
|
Name of
Shareholder |
Figures as at 31st
March, 2013 |
|
|
No. of share held |
||
|
No. of shares at the beginning of the year |
|
1,239,377,194 |
|
Add: Shares issued during the year |
|
-- |
|
Add: Bonus shares issued during the year |
|
-- |
|
Less: Share bought back during the year |
|
-- |
|
No. of shares at the end of the year |
|
1,239,377,194 |
E. Terms/right
attached to Equity/Preference Shares
The Company has
issued equity share of Re.1/- each and preference share of Rs.100/- each. On a
show of hands, every holder of equity shares is entitled for one vote and upon a
poll shall have voting rights in proportion to the shares of the paid up
capital of the Company held by them. Preference shareholders shall have voting
right in proportion to the shares of the paid up capital provided if the
dividend due on such capital or any part of such dividend has remained unpaid.
The Company declares dividend, if any, in Indian Rupees. The dividend, if any,
proposed by the Board of Directors is subject to the approval of shareholders
in the Annual General Meeting. In the event of liquidation of the Company, the
holders of equity shares will be entitled to receive remaining assets of the
company, after distribution of all preferential amount in proportion to their
shareholdings.
LISTING DETAILS:
|
|
BSE : 500183 NSE : HFCL ISIN: INE548A01028 |
|
Stock Exchange Place : |
· Bombay Stock Exchange Limited ·
National Stock Exchange of India Limited |
|
Listed Date : |
09.03.2011 |
FINANCIAL DATA
[all figures are
in Rupees Millions]
ABRIDGED BALANCE
SHEET
|
SOURCES OF FUNDS |
31.03.2013 |
31.03.2012 |
31.03.2011 |
|
I.
EQUITY
AND LIABILITIES |
|
|
|
|
(1)Shareholders' Funds |
|
|
|
|
(a) Share Capital |
2044.377 |
2044.377 |
1797.395 |
|
(b) Reserves & Surplus |
5065.617 |
4517.611 |
2220.006 |
|
(c) Money
received against share warrants |
0.000 |
0.000 |
0.000 |
|
|
|
|
|
|
(2) Share Application money pending allotment |
0.000 |
0.000 |
2430.301 |
|
Total
Shareholders’ Funds (1) + (2) |
7109.994 |
6561.988 |
6447.702 |
|
|
|
|
|
|
(3) Non-Current
Liabilities |
|
|
|
|
(a) long-term borrowings |
2023.486 |
2169.209 |
2297.071 |
|
(b) Deferred tax liabilities (Net) |
0.000 |
0.000 |
0.000 |
|
(c) Other long term liabilities |
39.699 |
6186.747 |
6185.546 |
|
(d) long-term provisions |
50.335 |
20.180 |
12.139 |
|
Total Non-current Liabilities (3) |
2113.520 |
8376.136 |
8494.756 |
|
|
|
|
|
|
(4) Current Liabilities |
|
|
|
|
(a) Short term borrowings |
716.884 |
973.654 |
1523.873 |
|
(b) Trade payables |
476.780 |
321.520 |
529.708 |
|
(c) Other current
liabilities |
1568.982 |
681.268 |
358.554 |
|
(d) Short-term provisions |
37.456 |
27.428 |
2.690 |
|
Total Current Liabilities (4) |
2800.102 |
2003.870 |
2414.825 |
|
|
|
|
|
|
TOTAL |
12023.616 |
16941.994 |
17357.283 |
|
|
|
|
|
|
II.
ASSETS |
|
|
|
|
(1) Non-current assets |
|
|
|
|
(a) Fixed Assets |
|
|
|
|
(i) Tangible assets |
1028.058 |
856.072 |
888.121 |
|
(ii) Intangible Assets |
25.034 |
15.958 |
0.000 |
|
(iii) Capital
work-in-progress |
216.467 |
197.450 |
144.654 |
|
(iv)
Intangible assets under development |
0.937 |
0.362 |
0.000 |
|
(b) Non-current Investments |
3635.804 |
9698.304 |
10341.404 |
|
(c) Deferred tax assets (net) |
0.000 |
0.000 |
0.000 |
|
(d) Long-term Loan and Advances |
64.155 |
36.448 |
29.902 |
|
(e) Other Non-current assets |
0.000 |
0.000 |
0.000 |
|
Total Non-Current Assets |
4970.455 |
10804.594 |
11404.081 |
|
|
|
|
|
|
(2) Current assets |
|
|
|
|
(a) Current investments |
1.815 |
1.839 |
1.829 |
|
(b) Inventories |
327.567 |
321.745 |
348.128 |
|
(c) Trade receivables |
2998.447 |
3112.845 |
3329.951 |
|
(d) Cash and cash
equivalents |
389.500 |
555.380 |
749.898 |
|
(e) Short-term loans and
advances |
3134.553 |
1936.350 |
1325.712 |
|
(f) Other current assets |
201.279 |
209.241 |
197.684 |
|
Total Current Assets |
7053.161 |
6137.400 |
5953.202 |
|
|
|
|
|
|
TOTAL |
12023.616 |
16941.994 |
17357.283 |
PROFIT & LOSS
ACCOUNT
|
|
PARTICULARS |
31.03.2013 |
31.03.2012 |
31.03.2011 |
|
|
|
SALES |
|
|
|
|
|
|
|
Income |
6053.496 |
2607.078 |
864.147 |
|
|
|
Other Income |
259.298 |
277.451 |
131.976 |
|
|
|
TOTAL (A) |
6312.794 |
2884.529 |
996.123 |
|
|
|
|
|
|
|
|
Less |
EXPENSES |
|
|
|
|
|
|
|
Cost of Materials Consumed |
915.356 |
281.615 |
211.723 |
|
|
|
Purchases of Stock-in-Trade |
129.077 |
853.425 |
399.609 |
|
|
|
Changes in inventories of
finished goods, work-in-progress and Stock-in-Trade |
(17.878) |
2.410 |
6.903 |
|
|
|
Employees benefits expense |
977.413 |
384.013 |
87.711 |
|
|
|
Provision for Impairment of
Fixed assets |
0.000 |
0.000 |
795.275 |
|
|
|
Other expenses |
2932.154 |
622.779 |
228.662 |
|
|
|
Investments written off |
12.600 |
0.000 |
0.000 |
|
|
|
Less: Transferred from
provision for diminution in value |
(12.600) |
0.000 |
0.000 |
|
|
|
Bad debts, Loans &
advances and Others written off (Net) |
291.498 |
155.058 |
2244.284 |
|
|
|
Less : Transferred from provision
made in earlier years |
0.000 |
(74.660) |
(1132.715) |
|
|
|
Exceptional Items |
98.187 |
59.500 |
(2613.477) |
|
|
|
TOTAL (B) |
5325.807 |
2284.140 |
227.975 |
|
|
|
|
|
|
|
|
Less |
PROFIT
BEFORE INTEREST, TAX, DEPRECIATION AND AMORTISATION (A-B) (C) |
986.987 |
600.389 |
768.148 |
|
|
|
|
|
|
|
|
|
Less |
FINANCIAL
EXPENSES (D) |
271.816 |
334.939 |
253.539 |
|
|
|
|
|
|
|
|
|
|
PROFIT
BEFORE TAX, DEPRECIATION AND AMORTISATION (C-D) (E) |
715.171 |
265.450 |
514.609 |
|
|
|
|
|
|
|
|
|
Less/ Add |
DEPRECIATION/
AMORTISATION (F) |
166.765 |
150.652 |
112.246 |
|
|
|
|
|
|
|
|
|
|
PROFIT BEFORE
TAX (E-F) (G) |
548.406 |
114.798 |
402.363 |
|
|
|
|
|
|
|
|
|
Less |
TAX (H) |
0.400 |
0.512 |
0.212 |
|
|
|
|
|
|
|
|
|
|
PROFIT AFTER TAX
(G-H) (I) |
548.006 |
114.286 |
402.151 |
|
|
|
|
|
|
|
|
|
Add |
PREVIOUS
YEARS’ BALANCE BROUGHT FORWARD |
516.437 |
402.151 |
0.000 |
|
|
|
|
|
|
|
|
|
|
BALANCE CARRIED
TO THE B/S |
1064.443 |
516.437 |
402.151 |
|
|
|
|
|
|
|
|
|
|
EARNINGS IN
FOREIGN CURRENCY |
|
|
|
|
|
|
|
Export Earnings |
13.948 |
0.944 |
1.599 |
|
|
TOTAL EARNINGS |
13.948 |
0.944 |
1.599 |
|
|
|
|
|
|
|
|
|
|
IMPORTS |
|
|
|
|
|
|
|
Raw Materials & Components |
561.700 |
119.056 |
70.291 |
|
|
|
Stores & Spares |
3.585 |
1.300 |
0.744 |
|
|
|
Capital Goods |
102.010 |
12.222 |
0.000 |
|
|
TOTAL IMPORTS |
667.295 |
132.578 |
71.035 |
|
|
|
|
|
|
|
|
|
|
Earnings Per
Share (Rs.) |
|
|
|
|
|
|
- Basic |
0.40 |
0.06 |
0.38 |
|
|
|
- Diluted |
0.40 |
0.06 |
0.35 |
|
QUARTERLY RESULTS
|
PARTICULARS |
30.09.2013 |
31.12.2013 |
31.03.2014 |
30.06.2014 |
|
|
1st
Quarter |
2nd
Quarter |
3rd
Quarter |
4th
Quarter |
|
Net Sales |
5040.300 |
5813.200 |
6751.000 |
6188.200 |
|
Total Expenditure |
4424.500 |
5142.400 |
6414.200 |
5349.400 |
|
PBIDT (Excl OI) |
615.800 |
670.800 |
336.800 |
838.800 |
|
Other Income |
10.700 |
16.700 |
87.100 |
38.900 |
|
Operating Profit |
626.600 |
687.600 |
423.900 |
877.700 |
|
Interest |
76.900 |
81.200 |
104.100 |
92.500 |
|
Exceptional Items |
0.000 |
0.000 |
0.000 |
0.000 |
|
PBDT |
549.600 |
606.300 |
319.800 |
785.200 |
|
Depreciation |
48.100 |
51.500 |
54.000 |
90.500 |
|
Profit Before Tax |
501.600 |
554.800 |
265.800 |
694.700 |
|
Tax |
0.000 |
0.000 |
00.300 |
0.000 |
|
Provisions and contingencies |
0.000 |
0.000 |
0.000 |
0.000 |
|
Profit After Tax |
501.600 |
554.800 |
265.500 |
694.700 |
|
Extraordinary Items |
0.000 |
0.000 |
0.000 |
0.000 |
|
Prior Period Expenses |
0.000 |
0.000 |
0.000 |
0.000 |
|
Other Adjustments |
0.000 |
0.000 |
0.000 |
0.000 |
|
Net Profit |
501.600 |
554.800 |
265.500 |
694.700 |
KEY RATIOS
|
PARTICULARS |
|
31.03.2013 |
31.03.2012 |
31.03.2011 |
|
PAT / Total Income |
(%) |
8.68 |
3.96 |
40.37 |
|
|
|
|
|
|
|
Net Profit Margin (PBT/Sales) |
(%) |
9.06 |
4.40 |
46.56 |
|
|
|
|
|
|
|
Return on Total Assets (PBT/Total Assets} |
(%) |
6.71 |
1.63 |
5.86 |
|
|
|
|
|
|
|
Return on Investment (ROI) (PBT/Networth) |
|
0.08 |
0.02 |
0.06 |
|
|
|
|
|
|
|
Debt Equity Ratio (Total Debt /Networth) |
|
0.39 |
0.48 |
0.59 |
|
|
|
|
|
|
|
Current Ratio (Current Asset/Current Liability) |
|
2.52 |
3.06 |
2.47 |
FINANCIAL ANALYSIS
[all figures are
in Rupees Millions]
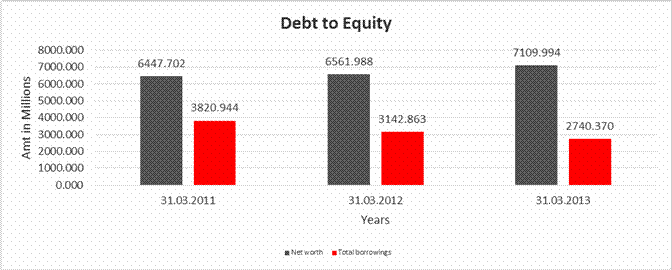
DEBT EQUITY RATIO
|
Particular |
31.03.2011 |
31.03.2012 |
31.03.2013 |
|
|
(Rs.
In Millions) |
(Rs.
In Millions) |
(Rs.
In Millions) |
|
Share Capital |
1797.395 |
2044.377 |
2044.377 |
|
Reserves & Surplus |
2220.006 |
4517.611 |
5065.617 |
|
Share Application money
pending allotment |
2430.301 |
0.000 |
0.000 |
|
Net
worth |
6447.702 |
6561.988 |
7109.994 |
|
|
|
|
|
|
long-term borrowings |
2297.071 |
2169.209 |
2023.486 |
|
Short term borrowings |
1523.873 |
973.654 |
716.884 |
|
Total
borrowings |
3820.944 |
3142.863 |
2740.370 |
|
Debt/Equity
ratio |
0.593 |
0.479 |
0.385 |
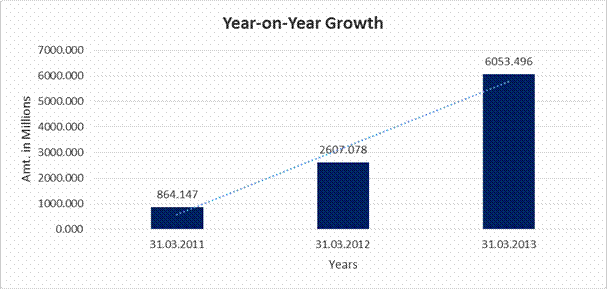
YEAR-ON-YEAR GROWTH
|
Year
on Year Growth |
31.03.2011 |
31.03.2012 |
31.03.2013 |
|
|
(Rs.
In Millions) |
(Rs.
In Millions) |
(Rs.
In Millions) |
|
Sales |
864.147 |
2607.078 |
6053.496 |
|
|
|
201.694 |
132.195 |
NET PROFIT MARGIN
|
Net
Profit Margin |
31.03.2011 |
31.03.2012 |
31.03.2013 |
|
|
(Rs.
In Millions) |
(Rs.
In Millions) |
(Rs.
In Millions) |
|
Sales |
864.147 |
2607.078 |
6053.496 |
|
Profit |
402.151 |
114.286 |
548.006 |
|
|
46.54% |
4.38% |
9.05% |
LOCAL AGENCY FURTHER INFORMATION
|
Sr. No. |
Check List by Info
Agents |
Available in Report (Yes / No) |
|
1] |
Year of Establishment |
Yes |
|
2] |
Locality of the firm |
Yes |
|
3] |
Constitutions of the firm |
Yes |
|
4] |
Premises details |
No |
|
5] |
Type of Business |
Yes |
|
6] |
Line of Business |
Yes |
|
7] |
Promoter's background |
Yes |
|
8] |
No. of employees |
Yes |
|
9] |
Name of person contacted |
No |
|
10] |
Designation of contact person |
No |
|
11] |
Turnover of firm for last three years |
Yes |
|
12] |
Profitability for last three years |
Yes |
|
13] |
Reasons for variation <> 20% |
---------------------- |
|
14] |
Estimation for coming financial year |
No |
|
15] |
Capital in the business |
Yes |
|
16] |
Details of sister concerns |
Yes |
|
17] |
Major suppliers |
No |
|
18] |
Major customers |
Yes |
|
19] |
Payments terms |
No |
|
20] |
Export / Import details (if applicable) |
No |
|
21] |
Market information |
---------------------- |
|
22] |
Litigations that the firm / promoter involved in |
---------------------- |
|
23] |
Banking Details |
Yes |
|
24] |
Banking facility details |
Yes |
|
25] |
Conduct of the banking account |
---------------------- |
|
26] |
Buyer visit details |
---------------------- |
|
27] |
Financials, if provided |
Yes |
|
28] |
Incorporation details, if applicable |
Yes |
|
29] |
Last accounts filed at ROC |
Yes |
|
30] |
Major Shareholders, if available |
Yes |
|
31] |
Date of Birth of Proprietor/Partner/Director, if available |
Yes |
|
32] |
PAN of Proprietor/Partner/Director, if available |
No |
|
33] |
Voter ID No of Proprietor/Partner/Director, if available |
No |
|
34] |
External Agency Rating, if available |
Yes |
UNSECURED LOAN
Rs.
In Millions
|
Particular |
As
on 31.03.2013 |
As
on 31.03.2012 |
|
SHORT TERM
BORROWINGS |
|
|
|
Loans Repayable on
Demand |
|
|
|
From Body Corporates |
360.150 |
610.150 |
|
Buyer's Credit |
50.071 |
0.000 |
|
Total |
410.221 |
610.150 |
MANAGEMENT
DISCUSSIONS AND ANALYSIS (MDA)
Financial Review
Sales during the financial year ended 31st March, 2013 stood at Rs.6173.131 Millions as against the sale of Rs.2638.282 Millions in the previous financial year ended 31st March, 2012. During the year, the Company has earned a net profit of Rs.548.006 Millions as compared to net profit of Rs.114.286 Millions in the previous financial year.
Capital Structure
During the financial year 2012-13 the paid up capital of the Company stood at Rs.2044.377 Millions.
OVERVIEW OF TELECOM
GROWTH IN INDIA
Telecom has been one of the biggest success story for India. Just 5 million connections in 1991 having grown to 895 million in December 2012 itself speaks of the exponential growth that has been achieved by the Telecom Sector. It has been one of the fastest growing sectors in recent years and has the second largest telephone network in the world which accounts for 12% subscribers in the world. This has been possible with a series of reform measures by the government, large scale introduction of wireless technologies (evolution of wireless technology) and active participation by the private sector.
Easy access and affordability have been the most remarkable features from consumer’s point of view which made mobile, once the luxury, an affordable gadget in the hands of every class of people. This is very evident from the tele-density that has increased from 4.3 in March 2002 to 73.3 in December, 2012. Vital to note that the tele-density in rural areas registered an increase from 1.2 in March 2002 to 39.95 in December,2012.
Telecommunications is no longer limited to voice as the data usage has shown an unparallel growth. The evolution of digital technology has facilitated the conversion of voice, data and video to the digital form and all these services are being increasingly rendered through single network, bringing about a convergence in networks, services and also the devices. This has been a result of massive investments both by Private and Government sectors in the last decade. Telecom Sector’s contribution to overall GDP has increased from 1.5 percent to 3 percent during the last decade. It stands third largest sector in attracting FDI inflows, having attracted more than 8 percent of cumulative FDI inflows during the period.
The Telecom Sector has witnessed series of reforms in last few years which have been big boost factor. However, with the recent cancellation of 2G licenses, restrictive terms for auction of cancelled licenses etc. including other government decisions, the confidence of the operators and investors in this industry is low. All of this has generated an enormous amount of negative publicity and discouraged investors, both domestic and international. This is evident from the operators closing down or limiting engagements coupled with decreasing FDI. However with recent initiatives by the Government by increasing FDI in telecom sector, the industry will re-attract investors and will have excellent future prospects. The Sector has also witnessed some significant developments such as introduction of Mobile Number Portability (MNP), 3G and 4G rollout, National Telecom Policy, National Optical Fibre Network (NOFN), OFC network for Defence etc. giving much needed direction to the industry.
The New Telecom Policy (NTP 2012) targets to increase tele-density, broadband connections, indigenous R&D, manufacturing, investor friendly environment and employment opportunities. NTP-2012 has the vision of Broadband on demand for rural or urban ensuring equitable and inclusive development across the nation. NOFN with planned investment of Rs 20,000 crore, is going to provide broadband connectivity to every village panchayat. The NOFN network will also be available to private telecom operators and cable TV operators, for their use and to extend the reach of their services to the remote villages in India. Government has also approved a budget of about Rs.130000.000 Millions for setting up a fibre optic network of 60,000 route kilometers for defence services. These projects will provide huge business opportunities to telecom companies for providing range of infrastructure services and manufacturing and supply of broadband related telecom equipments. Corresponding investment shall be made in various broadband access technologies.
OPPORTUNITIES AND
OUTLOOK
There is a huge potential of business in both equipment and turnkey services during the coming years. The broadband networks will be IP based and there will be rollout of several Pan India Broadband wireless networks. Operators shall strive to be first mover through rapid installation and expansion. The Company is a proven one-stop-shop for telecom infrastructure providers, capable to deliver end to end telecom solutions. Operators also now outsource operation and maintenance services of their network and the Company has again the experience and expertise of managing and maintaining the networks at highest level of efficiency.
With NTP emphasising on local manufacturing, the Company stands to gain more as there is huge potential for contract manufacturing too. The Company has already signed contract manufacturing agreement for manufacture of Microwave Radios with DragonWave Inc., a Canadian Radio manufacturing company and the technology agreement with CDoT, for the manufacture of broadband Fiber to the Home (FTTH) equipments. The Company also has the capability to cater the upcoming demand of customer premises equipment. The Company is already one of the largest player in supplying optical fibre cables which shall be in continued demand by the service providers. During the year, the Company has made a capital investment of Rs. 35 Crore approx. to increase the existing manufacturing capacity of optical fibre cable at its Goa plant.
UNAUDITED
FINANCIAL RESULTS FOR THE FIRST QUARTER ENDED 30TH JUNE, 2014
Rs. In Millions
|
Particulars |
Three Months
Ended |
Preceding Three
Months Ended |
Corresponding
Three Months Ended in the previous year |
Previous Year
Ended |
|
|
June 30, 2014 |
March 31, 2014 |
June 30, 2013 |
March 31, 2014 |
|
1. Income from
operations |
|
|
|
|
|
Net Sales/Income from operations (Net of Excise Duty) |
6188.200 |
6751.000 |
2583.300 |
20187.800 |
|
2. Expenses |
|
|
|
|
|
a) Cost of materials/services consumed |
5290.200 |
5399.100 |
1748.700 |
14801.200 |
|
b) Purchases of stock-in-trade |
8.000 |
24.300 |
-- |
159.300 |
|
c) Changes in Inventories of finished goods, work in progress
and stock In Trade |
(962.900) |
(1027.500) |
(29.200) |
(1068.500) |
|
d) Employee benefits expenses |
550.100 |
614.400 |
347.900 |
1954.400 |
|
e) Depreciation. Impairment and Amortisation Expenses |
90.500 |
54.000 |
44.900 |
198.500 |
|
f) Other expenses |
462.600 |
542.200 |
251.500 |
1536.500 |
|
g) Provision for doubtful advances |
-- |
60.00 |
-- |
60.000 |
|
f) Bad debts advances & Miscellaneous balances written off (net) |
1.400 |
801.700 |
19.700 |
876.700 |
|
Total |
5439.900 |
6468.200 |
2383.500 |
18518.100 |
|
3. Profit/ (Loss) from Operations before Other Income, Finance Costs
and Exceptional Items |
748.300 |
282.800 |
199.800 |
1669.700 |
|
4. Other Income |
38.900 |
87.100 |
22.200 |
136.800 |
|
5. Profit/(Loss) from ordinary activities before finance costs and
exceptional items (3+4) |
787.200 |
369.900 |
222.000 |
1806.500 |
|
6. Finance Cost |
92.500 |
104.100 |
69.100 |
331.400 |
|
7. Profit/ (Loss) from ordinary activities alter finance costs but
before exceptional items (5-6) |
694.700 |
265.800 |
152.900 |
1475.100 |
|
8. Exceptional Items - expenses
/(income) |
-- |
-- |
-- |
-- |
|
9. Profit/ (Loss) from ordinary activities before Tax |
694.700 |
265.800 |
152.900 |
1475.100 |
|
10. Tax Expenses |
145.900 |
70.800 |
32.300 |
324.500 |
|
MAT Credit Entitlements |
(145.900) |
(70.500) |
(32.300) |
(324.200) |
|
11. Net Profit/ (Loss) from ordinary activities after Tax (9-10) |
694.700 |
265.500 |
152.900 |
1474.800 |
|
12. Extra-ordinary items – expenses / (Income) |
-- |
-- |
-- |
-- |
|
13. Net Profit/ (Loss) for the period (11-12) |
694.700 |
265.500 |
152.900 |
1474.800 |
|
14. Share of (profit) I loss of Associates |
-- |
-- |
-- |
-- |
|
15 Minority interest |
-- |
-- |
-- |
-- |
|
16. Net profit/ (loss) after taxes, minority interest and share of
profit/ (loss) of associates (13-14) |
694.700 |
265.500 |
152.900 |
1474.800 |
|
17 Pad-up Equity Share Capital (Face
value of Re.1/- each) |
1239.400 |
1239.400 |
1239.400 |
1239.400 |
|
18. Reserves excluding revaluation reserves as per Balance sheet of
previous year |
-- |
-- |
-- |
6341.700 |
|
19. (a) EPS before Extraordinary Item (Rs.) (Not Annualised) |
|
|
|
|
|
Basic |
0.55 |
0.20 |
0.11 |
1.15 |
|
Diluted |
0.55 |
0.20 |
0.11 |
1.15 |
|
(b) EPS after
Extraordinary Item (Rs.) (Not Annualised |
|
|
|
|
|
Basic |
0.55 |
0.20 |
0.11 |
1.15 |
|
Diluted |
0.55 |
0.20 |
0.11 |
1.15 |
|
|
|
|
|
|
|
PART – 2 |
|
|
|
|
|
1. Public shareholding |
|
|
|
|
|
- Number of shares |
760,077,980 |
760,077,980 |
759,799,800 |
760,077,980 |
|
- Percentage of shareholding |
61.33% |
61.33% |
61.30% |
61.33% |
|
2. Promoters and Promoters group Shareholding- |
|
|
|
|
|
a) Pledged /Encumbered |
|
|
|
|
|
Number of shares |
240,756,000 |
240,756,000 |
180,831,001 |
240,756,000 |
|
Percentage of shares (as a % of total shareholding of the promoter and
promoter group) |
50.23% |
50.23% |
37.73% |
50.23% |
|
Percentage of shares (as a % of total share capital of the company) |
19.43% |
19.43% |
14.59% |
19.43% |
|
b) Non Encumbered |
|
|
|
|
|
Number of shares |
238,543,214 |
238,543,214 |
298,468,213 |
238,543,214 |
|
Percentage of shares (as a % of total shareholding of the promoter and
promoter group) |
49.77% |
49.77% |
62.27% |
49.77% |
|
Percentage of shares (as a % of total share capital of the company) |
19.25% |
19.25% |
24.08% |
19.25% |
|
|
|
|
|
|
|
B. INVESTOR COMPLAINTS |
|
|
|
|
|
Pending at the beginning of the quarter |
Nil |
|
|
|
|
Received during the quarter |
4 |
|
|
|
|
Disposed of during the quarter |
4 |
|
|
|
|
Remaining unresolved at the end of the
quarter |
Nil |
|
|
|
SEGMENTWISE
REVENUE, RESULTS AND CAPITAL EMPLOYED
Rs. In Millions
|
Particulars |
Three Months
Ended |
Preceding Three
Months Ended |
Corresponding
Three Months Ended in the previous year |
Previous Year
Ended |
|
|
June 30, 2014 |
March 31, 2014 |
June 30, 2013 |
March 31, 2014 |
|
1. Segment
Revenue |
|
|
|
|
|
a. Telecom Products |
1216.000 |
1266.800 |
470.200 |
3474.800 |
|
b. Turnkey Contracts and Services |
4972.200 |
5484.200 |
2113.100 |
16713.000 |
|
Total |
6188.200 |
6751.000 |
2583.300 |
20187.800 |
|
|
|
|
|
|
|
Less: Inter segment revenue |
-- |
-- |
-- |
-- |
|
Net Sales/Income
from Operations |
6188.200 |
6751.000 |
2583.300 |
20187.800 |
|
|
|
|
|
|
|
2. Segment
Results Profit /(Loss) before tax and interest for each segment |
|
|
|
|
|
a. Telecom Products |
174.800 |
(612.800) |
(34.800) |
(570.500) |
|
b. Turnkey Contracts and Services |
603.300 |
969.600 |
266.300 |
2372.100 |
|
Total |
778.100 |
356.800 |
231.500 |
1801.600 |
|
Less. i. Interest |
92.500 |
104.100 |
69.100 |
331.400 |
|
ii. Other un-allocable expenditure net off un-allocable income |
(9.100) |
(13.100) |
9.500 |
(4.900) |
|
Total Profit
before Tax |
694.700 |
265.800 |
152.900 |
1475.100 |
|
|
|
|
|
|
|
3. Capital Employed |
|
|
|
|
|
a. Telecom Products |
3214.700 |
3069.200 |
3783.700 |
3069.200 |
|
b. Turnkey Contracts and Services |
2276.000 |
1649.000 |
421.300 |
1649.000 |
|
Total capital
employed in segments |
5490.700 |
4718.200 |
4205.000 |
4718.200 |
|
Add: Un-allocable corporate assets less liabilities |
3494.800 |
3667.800 |
3057.900 |
3667.800 |
|
Total capital
employed In Company |
8985.500 |
8386.000 |
7262.900 |
8386.000 |
Note:
1. The above results have been reviewed by the Audit Committee and taken on record by the Board of Directors at its meeting held on July 10, 2014 and the Statutory Auditors have carried out Limited Review of the same.
2. The figures of the last quarter for the previous financial year are the
balancing figures between audited figures in respect of the full financial year
and the published un-audited year to date figures up to third quarter of
previous financial year.
3. The figures of the previous periods have been regrouped wherever necessary
and restated in 'Rupees in crores' in lieu of 'Rupees in lakhs' as mentioned
earlier.
INDEX OF CHARGES
|
S.No. |
Charge ID |
Date of Charge
Creation/Modification |
Charge amount
secured |
Charge Holder |
Address |
Service Request
Number (SRN) |
|
1 |
10477787 |
14/02/2014 |
400,000,000.00 |
IDBI BANK LIMITED |
IDBI TOWERWTC COMPLEX, CUFFE PARADE, MUMBAI, MAHARASHTRA - 400005, INDIA |
B96444773 |
|
2 |
10054919 |
06/01/2014 * |
2,238,500,000.00 |
STATE BANK OF INDIA CONSORTIUM |
N-3, SOUTH EXTENSION PART -1, NEW DELHI, DELHI - 110049, INDIA |
B94271665 |
|
3 |
90183275 |
10/01/2014 * |
2,238,500,000.00 |
STATE BANK OF INDIA CONSORTIUM |
N-3, SOUTH EXTENSION PART -1, NEW DELHI, DELHI - 110049, INDIA |
B94372299 |
|
4 |
80019393 |
16/10/2003 |
200,000,000.00 |
RABO INDIA FINANCE PRIVATE LIMITED. |
FORBES BUILDING, 2ND FLOOR, CHARANJIT RAI MARG, FORT, MUMBAI, MAHARASHTRA - 400001, INDIA |
- |
|
5 |
80019425 |
25/05/2001 |
750,000,000.00 |
GLOBAL TRUST BANK LIMITED |
15, MAKER CHAMBRS III, NARIMAN POINT, MUMBAI, MAHARASHTRA - 400021, INDIA |
- |
|
6 |
80019386 |
15/12/2000 |
2,500,000,000.00 |
THE INDUSTRIAL DEVELOPMENT BANK OF INDIA LIMITED |
IDBI TOWER, CUFFE PARADE, MUMBAI, MAHARASHTRA - 400005, INDIA |
- |
|
7 |
80018675 |
28/11/2006 * |
2,500,000,000.00 |
INDUSTRIAL DEVELOPMENT BANK OF INDIA LIMITED |
IDBI TOWER, CUFFEE PARADE, COLOBA, MUMBAI, MAHARASHTRA - 400005, INDIA |
- |
* Date of charge modification
FIXED ASSETS
· Land
· Buildings
· Plant and machinery
· Electrical installation
· Furniture and fixtures
· Office equipments
· Vehicles
· Moulds and dies
CMT REPORT (Corruption, Money Laundering & Terrorism]
The Public Notice information has been collected from various sources
including but not limited to: The Courts,
1] INFORMATION ON
DESIGNATED PARTY
No exist designating subject or any of its beneficial owners, controlling
shareholders or senior officers as terrorist or terrorist organization or whom
notice had been received that all financial transactions involving their assets
have been blocked or convicted, found guilty or against whom a judgement or
order had been entered in a proceedings for violating money-laundering,
anti-corruption or bribery or international economic or anti-terrorism sanction
laws or whose assets were seized, blocked, frozen or ordered forfeited for
violation of money laundering or international anti-terrorism laws.
2] Court Declaration :
No exist to suggest that subject is or was
the subject of any formal or informal allegations, prosecutions or other
official proceeding for making any prohibited payments or other improper payments
to government officials for engaging in prohibited transactions or with
designated parties.
3] Asset Declaration :
No records exist to suggest that the property or assets of the subject are
derived from criminal conduct or a prohibited transaction.
4] Record on Financial
Crime :
Charges or conviction
registered against subject: None
5] Records on Violation of
Anti-Corruption Laws :
Charges or
investigation registered against subject: None
6] Records on Int’l
Anti-Money Laundering Laws/Standards :
Charges or
investigation registered against subject: None
7] Criminal Records
No
available information exist that suggest that subject or any of its principals
have been formally charged or convicted by a competent governmental authority
for any financial crime or under any formal investigation by a competent
government authority for any violation of anti-corruption laws or international
anti-money laundering laws or standard.
8] Affiliation with
Government :
No record
exists to suggest that any director or indirect owners, controlling
shareholders, director, officer or employee of the company is a government
official or a family member or close business associate of a Government
official.
9] Compensation Package :
Our market
survey revealed that the amount of compensation sought by the subject is fair
and reasonable and comparable to compensation paid to others for similar
services.
10] Press Report :
No press reports / filings exists on
the subject.
CORPORATE GOVERNANCE
MIRA INFORM as part of its Due Diligence do provide comments on
Corporate Governance to identify management and governance. These factors often
have been predictive and in some cases have created vulnerabilities to credit
deterioration.
Our Governance Assessment focuses principally on the interactions
between a company’s management, its Board of Directors, Shareholders and other
financial stakeholders.
CONTRAVENTION
Subject is not known to have contravened any existing local laws,
regulations or policies that prohibit, restrict or otherwise affect the terms
and conditions that could be included in the agreement with the subject.
FOREIGN EXCHANGE RATES
|
Currency |
Unit
|
Indian Rupees |
|
US Dollar |
1 |
Rs. |
|
|
1 |
Rs. |
|
Euro |
1 |
Rs. |
INFORMATION DETAILS
|
Information
Gathered by : |
|
|
|
|
|
Analysis Done by
: |
|
|
|
|
|
Report Prepared
by : |
NTH |
SCORE & RATING EXPLANATIONS
|
SCORE FACTORS |
RANGE |
POINTS |
|
HISTORY |
1~10 |
5 |
|
PAID-UP CAPITAL |
1~10 |
5 |
|
OPERATING SCALE |
1~10 |
4 |
|
FINANCIAL CONDITION |
|
|
|
--BUSINESS SCALE |
1~10 |
5 |
|
--PROFITABILIRY |
1~10 |
5 |
|
--LIQUIDITY |
1~10 |
5 |
|
--LEVERAGE |
1~10 |
5 |
|
--RESERVES |
1~10 |
5 |
|
--CREDIT LINES |
1~10 |
4 |
|
--MARGINS |
-5~5 |
-- |
|
DEMERIT POINTS |
|
|
|
--BANK CHARGES |
YES/NO |
YES |
|
--LITIGATION |
YES/NO |
NO |
|
--OTHER ADVERSE INFORMATION |
YES/NO |
NO |
|
MERIT POINTS |
|
|
|
--SOLE DISTRIBUTORSHIP |
YES/NO |
NO |
|
--EXPORT ACTIVITIES |
YES/NO |
YES |
|
--AFFILIATION |
YES/NO |
YES |
|
--LISTED |
YES/NO |
YES |
|
--OTHER MERIT FACTORS |
YES/NO |
YES |
|
DEFAULTER |
|
|
|
--RBI |
YES/NO |
NO |
|
--EPF |
YES/NO |
NO |
|
TOTAL |
|
43 |
This score serves as a reference to assess SC’s credit risk
and to set the amount of credit to be extended. It is calculated from a
composite of weighted scores obtained from each of the major sections of this report.
The assessed factors and their relative weights (as indicated through %) are as
follows:
Financial
condition (40%) Ownership
background (20%) Payment
record (10%)
Credit history
(10%) Market trend
(10%) Operational
size (10%)
RATING EXPLANATIONS
|
RATING |
STATUS |
PROPOSED CREDIT LINE |
|
|
>86 |
Aaa |
Possesses an extremely sound financial base with the strongest
capability for timely payment of interest and principal sums |
Unlimited |
|
71-85 |
Aa |
Possesses adequate working capital. No caution needed for credit
transaction. It has above average (strong) capability for payment of interest
and principal sums |
Large |
|
56-70 |
A |
Financial & operational base are regarded healthy. General unfavourable
factors will not cause fatal effect. Satisfactory capability for payment of
interest and principal sums |
Fairly Large |
|
41-55 |
Ba |
Overall operation is considered normal. Capable to meet normal
commitments. |
Satisfactory |
|
26-40 |
B |
Capability to overcome financial difficulties seems comparatively
below average. |
Small |
|
11-25 |
Ca |
Adverse factors are apparent. Repayment of interest and principal sums
in default or expected to be in default upon maturity |
Limited with full
security |
|
<10 |
C |
Absolute credit risk exists. Caution needed to be exercised |
Credit not
recommended |
|
-- |
NB |
New Business |
-- |
This report is issued at your request without any
risk and responsibility on the part of MIRA INFORM PRIVATE LIMITED (MIPL)
or its officials.