MIRA
INFORM REPORT
|
Report Date : |
17.07.2014 |
IDENTIFICATION DETAILS
|
Name : |
HUIJBREGTS GROEP B.V. |
|
|
|
|
Registered Office : |
Vossenbeemd 107 5705CL |
|
|
|
|
Country : |
|
|
|
|
|
Financials (as on) : |
31.12.2012 |
|
|
|
|
Date of Incorporation : |
01.01.1936 |
|
|
|
|
Com. Reg. No.: |
17056299 |
|
|
|
|
Legal Form : |
Private Company |
|
|
|
|
Line of Business : |
Manufacture of condiments and seasonings |
|
|
|
|
No. of Employees |
85 |
RATING & COMMENTS
|
MIRA’s Rating : |
Ba |
|
RATING |
STATUS |
PROPOSED CREDIT LINE |
|
|
41-55 |
Ba |
Overall operation is considered normal. Capable to meet normal
commitments. |
Satisfactory |
|
Status : |
Satisfactory |
|
Payment Behaviour : |
No complaints |
|
Litigation : |
Clear |
NOTES :
Any query related to this report can be made
on e-mail : infodept@mirainform.com
while quoting report number, name and date.
ECGC Country Risk Classification List – March 31, 2014
|
Country Name |
Previous Rating (31.12.2013) |
Current Rating (31.03.2014) |
|
|
A1 |
A1 |
|
Risk Category |
ECGC
Classification |
|
Insignificant |
A1 |
|
Low Risk |
A2 |
|
Moderate Low Risk |
B1 |
|
Moderate Risk |
B2 |
|
Moderate High Risk |
C1 |
|
High Risk |
C2 |
|
Very High Risk |
D |
|
Source
: CIA |
Company name and address
|
Company name |
HUIJBREGTS GROEP B.V. |
|
Operative address |
Vossenbeemd 107 5705CL |
|
|
|
|
Legal form |
Private Company |
|
Registration number |
KvK-nummer: 17056299 |
|
VAT-number |
007687813 |
|
Year |
2012 |
|
Mutation |
2011 |
|
Mutation |
2010 |
|
Fixed assets |
240.483 |
|
34,93 |
178.222 |
|
59,50 |
111.741 |
|
Total receivables |
4.575.879 |
|
-8,57 |
5.005.057 |
t |
25,25 |
3.996.153 |
|
|
|||||||
|
Total equity |
5.832.815 |
|
3,63 |
5.628.286 |
t |
67,00 |
3.370.224 |
|
Short term liabilities |
8.622.575 |
|
13,17 |
7.618.975 |
|
0,11 |
7.610.429 |
|
|
|||||||
|
Net result |
2.304.529 |
|
2,06 |
2.258.062 |
|
2,77 |
2.197.106 |
|
|
|||||||
|
Working capital |
5.592.332 |
|
2,61 |
5.450.064 |
t |
67,26 |
3.258.483 |
|
Quick ratio |
0,69 |
|
-11,54 |
0,78 |
t |
25,81 |
0,62 |

Contact information
Company name Huijbregts Groep B.V.
Trade names Huijbregts Groep
Operative address Vossenbeemd 107
5705CL
Correspondence address Postbus 165
5700AD
Telephone number 0492596300
Fax number 0492550540
Email address info@huijbregts.nl
Website www.huijbregts.nl
Registration
Registration number KvK-nummer: 17056299
Registered in Kamer
van Koophandel
Branch number 000018286364
VAT-number 007687813
Status Active
Memorandum 1985-11-15
Establishment date 1936-01-01
Legal form Private Company
Legal person since 1985-11-15
Last proposed admendment 1992-06-10
Activities
SBI Manufacture of condiments and seasonings (108401)
Exporter No
Importer No
Goal Processing, storage, and distribution voorrraadbeheersing dry and liquid
components for the food industry,
as well as the participation in and management
carry on companies
with similar or related objects
Relations
Shareholders Huijbregts Groep Holding B.V.
Vossenbeemd 107
5705CL
Registration number: 170654270000
Percentage: 100%
Companies on same
addres
Automatiserings
Producten & Supplies International B.V.
Registration number: 170536780000
Bostad
B.V.
Registration number: 170972220000
Helmondse
Internationale Levensmiddelen Holding B.V.
Registration number: 170130730000
Huijbregts
Central Buying B.V.
Registration number: 170960490000
Huijbregts
Groep Holding B.V.
Registration number: 170654270000
L
& F Machinebouw B.V.
Registration number: 170528500000
Personeelsvereniging
't Kruidvat
Registration number: 402386420000
Red
& Silver B.V.
Registration number: 170735480000
Stichting
Administratiekantoor Huybregts Beheer
Registration number: 410928210000
Companies
on same address
Stichting
Administratiekantoor Huybregts Specerijen
Registration number: 410909310000
Management
Active management Huijbregts Groep Holding B.V.
Vossenbeemd 107
5705CL
Registration number: 170654270000
Competence: Fully authorized
Function: Manager
Starting date: 1993-08-01
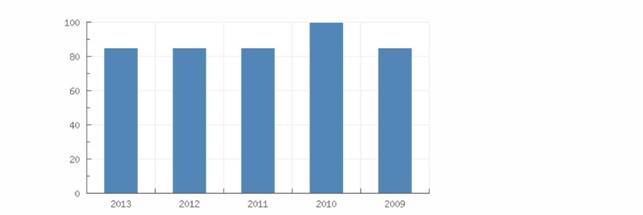
Employees
|
|
||||||
|
Total according to the
Chamber of Commerce |
85 |
|
|
|
|
|
|
Year |
|
2013 |
2012 |
2011 |
2010 |
2009 |
|
Total |
|
85 |
85 |
85 |
100 |
85 |
Payments
Description Payments are made regularly no complaints are known
Key figures
|
|||||
|
|
|||||
|
Year |
2012 |
2011 |
2010 |
2009 |
2008 |
|
Quick ratio |
0,69 |
0,78 |
0,62 |
0,79 |
0,56 |
|
Current ratio |
1,65 |
1,72 |
1,43 |
1,81 |
1,53 |
|
|
|||||
|
Working capital/ balance
total |
0,39 |
0,41 |
0,30 |
0,44 |
0,34 |
|
Equity / balance total |
0,40 |
0,42 |
0,31 |
0,45 |
0,35 |
|
Equity / Fixed assets |
24,25 |
31,58 |
30,16 |
36,95 |
42,61 |
|
Equity / liabilities |
0,68 |
0,74 |
0,44 |
0,83 |
0,54 |
|
Balance total /
liabilities |
1,68 |
1,74 |
1,44 |
1,83 |
1,54 |
|
|
|||||
|
Working capital |
5.592.332 |
5.450.064 |
3.258.483 |
3.379.133 |
3.023.415 |
|
Equity |
5.832.815 |
5.628.286 |
3.370.224 |
3.473.118 |
3.096.071 |
|
Mutation equity |
3,63 |
67,00 |
-2,96 |
12,18 |
36,03 |
|
Mutation short term
liabilities |
13,17 |
0,11 |
81,65 |
-27,01 |
-7,76 |
|
|
|||||
|
Return on total assets
(ROA) |
21,26 |
22,73 |
26,86 |
42,20 |
27,39 |
|
Return on equity (ROE) |
52,68 |
53,49 |
87,51 |
93,10 |
78,18 |
|
Gross profit margin |
|
7,78 |
|
|
|
|
Net profit margin |
|
5,53 |
|
|
|
|
|
|||||
|
Average collection ratio |
|
5,36 |
|
|
|
|
Average payment ratio |
|
8,16 |
|
|
|
|
Equity turnover ratio |
|
7,26 |
|
|
|
|
Total assets turnover
ratio |
|
3,08 |
|
|
|
|
Fixed assets turnover
ratio |
|
229,19 |
|
|
|
|
Inventory conversion ratio |
|
5,70 |
|
|
|
|
|
|||||
|
Turnover |
|
40.846.528 |
|
|
|
|
Gross margin |
13.976.132 |
13.179.358 |
11.721.971 |
10.667.634 |
10.144.895 |
|
Operating result |
3.231.311 |
3.176.043 |
3.037.770 |
3.314.449 |
2.595.886 |
Summary
The 2012 financial result structure is a postive working captial of 5.592.332 euro, which is in
agreement with 39 % of the total assets of the company.
The working capital has increase with 2.61 % compared to previous year. The ratio with
respect to the total assets of the company has however, declined.
The improvement between 2011 and 2012 has mainly been caused by a current liabilities
reduction.
The current ratio of the company in 2012 was 1.65. A company with a current ratio between
1.5 and 3.0 generally indicates good short-term financial strength.
The quick ratio in 2012 of the company was 0.69. A company with a Quick Ratio of less than
1 cannot currently pay back its current liabilities.
The 2011 financial result structure is a postive working captial of 5.450.064 euro, which is in
agreement with 41 % of the total assets of the company.
The working capital has increased with 67.26 % compared to previous year. The ratio, with
respect to the total assets of the company has however, increased.
The improvement between 2010 and 2011 has mainly been caused by an increase of the
current assets.
The current ratio of the company in 2011 was 1.72. A company with a current ratio between
1.5 and 3.0 generally indicates good short-term financial strength.
The quick ratio in 2011 of the company was 0.78. A company with a Quick Ratio of less than
1 cannot currently pay back its current liabilities.

Financial statement
Type of annual account Corporate
Annual account Huijbregts Groep B.V.
Vossenbeemd 107
5705CL
Registration number: 170562990000
Balance
|
Year |
2012 |
2011 |
2010 |
2009 |
2008 |
|
End date |
2012-12-31 |
2011-12-31 |
2010-12-31 |
2009-12-31 |
2008-12-31 |
|
Tangible fixed assets |
240.483 |
178.222 |
111.741 |
93.985 |
72.656 |
|
Fixed assets |
240.483 |
178.222 |
111.741 |
93.985 |
72.656 |
|
Year |
2012 |
2011 |
2010 |
2009 |
2008 |
|
End date |
2012-12-31 |
2011-12-31 |
2010-12-31 |
2009-12-31 |
2008-12-31 |
|
Total stock |
8.306.436 |
7.163.601 |
6.185.677 |
4.254.011 |
5.551.769 |
|
Total receivables |
4.575.879 |
5.005.057 |
3.996.153 |
3.295.246 |
3.209.574 |
|
Liquid funds |
1.332.592 |
900.381 |
687.082 |
19.587 |
2.365 |
|
Current assets |
14.214.907 |
13.069.039 |
10.868.912 |
7.568.844 |
8.763.708 |
|
Total assets |
14.455.390 |
13.247.261 |
10.980.653 |
7.662.829 |
8.836.364 |
|
|
|||||
|
Total equity |
5.832.815 |
5.628.286 |
3.370.224 |
3.473.118 |
3.096.071 |
|
|
|||||
|
Short term liabilities |
8.622.575 |
7.618.975 |
7.610.429 |
4.189.711 |
5.740.293 |
|
Total short and long term
liabilities |
8.622.575 |
7.618.975 |
7.610.429 |
4.189.711 |
5.740.293 |
|
Total liabilities |
14.455.390 |
13.247.261 |
10.980.653 |
7.662.829 |
8.836.364 |
Summary
The total assets of the company increased with 9.12 % between 2011 and 2012.
The total asset increase is retrievable in the fixed asset growth of 34.93 %.
The asset growth has mainly been financed by a debt increase of 13.17 %. The Net Worth,
however, grew with 3.63 %.
In 2012 the assets of the company were 1.66 % composed of fixed assets and 98.34 % by
current assets. The assets are being financed by an equity of 40.35 %, and total debt of
59.65 %.
The total assets of the company increased with 20.64 % between 2010 and 2011.
The total asset increase is retrievable in the fixed asset growth of 59.5 %.
In 2011 the assets of the company were 1.35 % composed of fixed assets and 98.65 % by
current assets. The assets are being financed by an equity of 42.49 %, and total debt of
57.51 %.

Profit and loss
|
|
|||||
|
Year |
2012 |
2011 |
2010 |
2009 |
2008 |
|
Revenues |
|
40.925.669 |
|
|
|
|
Other operating income |
|
79.141 |
|
|
|
|
Net turnover |
|
40.846.528 |
|
||
|
|
|||||
|
Gross margin |
13.976.132 |
13.179.358 |
11.721.971 |
10.667.634 |
10.144.895 |
|
|
|||||
|
Wages and salaries |
4.597.580 |
4.067.174 |
3.728.984 |
3.536.385 |
3.680.089 |
|
Amorization and
depreciation |
48.129 |
35.313 |
24.092 |
16.294 |
24.033 |
|
Sales |
|
27.667.170 |
|
|
|
|
other operating costs |
6.099.112 |
5.979.969 |
4.931.125 |
3.800.506 |
3.844.887 |
|
Operating expenses |
10.744.821 |
37.749.626 |
8.684.201 |
7.353.185 |
7.549.009 |
|
Operating result |
3.231.311 |
3.176.043 |
3.037.770 |
3.314.449 |
2.595.886 |
|
|
|||||
|
Financial income |
1.942 |
1.253 |
1.070 |
2.547 |
4.546 |
|
Financial expenses |
160.548 |
166.547 |
89.705 |
83.355 |
179.918 |
|
Financial result |
-158.606 |
-165.294 |
-88.635 |
-80.808 |
-175.372 |
|
Result on ordinary
operations before taxes |
3.072.705 |
3.010.749 |
2.949.135 |
3.233.641 |
2.420.514 |
|
|
|||||
|
Taxation on the result of
ordinary activities |
768.176 |
752.687 |
752.029 |
813.619 |
623.080 |
|
Result of ordinary
activities after taxes |
2.304.529 |
2.258.062 |
2.197.106 |
2.420.022 |
1.797.434 |
|
|
|||||
|
Extraordinary income |
|
|
|
5.383 |
30.746 |
|
Extraordinary expense |
|
|
|
48.358 |
7.810 |
|
Extraordinary result after
taxation |
|
|
|
-42.975 |
22.936 |
|
Net result |
2.304.529 |
2.258.062 |
2.197.106 |
2.377.047 |
1.820.370 |
Summary
The gross profit of the company grew with 6.05 % between 2011 and 2012.
The operating result of the company grew with 1.74 % between 2011 and 2012. This
evolution implies an increase of the company's economic profitability.
The result of these changes is a reduction of the company's Economic Profitability of -6.47 %
of the analysed period, being equal to 2011 % in the year 2012.
The Net Result of the company decreased by 2.06 % between 2011 and 2012.
The company's Financial Profitability has been negatively affected by the financial activities in
comparison to the EBITs behaviour. The result of these variations is a profitability reduction
of -1.51 % of the analysed period, being 52.68 % in the year 2012.
The company's financial profitability has been positively affected by its financial structure.
The gross profit of the company grew with 12.43 % between 2010 and 2011.
The operating result of the company grew with 4.55 % between 2010 and 2011. This
evolution implies an increase of the company's economic profitability.
The result of these changes is a reduction of the company's Economic Profitability of -15.38
% of the analysed period, being equal to 2010 % in the year 2011.
The Net Result of the company decreased by 2.77 % between 2010 and 2011.
The company's Financial Profitability has been positively affected by the financial activities in
comparison to the EBITs behaviour. The result of these variations is a profitability increase of
-38.88 % of the analysed period, being 53.49 % in the year 2011.
The company's financial profitability has been positively affected by its financial structure

Analysis
Branch (SBI) Manufacture of food products (10)
Region Zuid-Oost-Brabant
In the Netherlands 6059 of the companies are registered with the SBI code 10
In the region Zuid-Oost-Brabant 331 of the companies are registered with the SBI code 10
In the Netherlands 140 of the bankrupcties are published within this sector
In the region Zuid-Oost-Brabant 7 of the bankruptcies are published within this sector
The risk of this specific sector in the Netherlands is normal
The risk of this specific sector in the region Zuid-Oost-Brabant is normal
Publications
Filings 15-04-2013: De jaarrekening over 2012 is gepubliceerd.
17-07-2012: De jaarrekening over 2011 is gepubliceerd.
16-09-2011: De jaarrekening over 2010 is gepubliceerd.
16-06-2010: De jaarrekening over 2009 is gepubliceerd.
FOREIGN EXCHANGE RATES
|
Currency |
Unit
|
Indian Rupees |
|
US Dollar |
1 |
Rs.60.19 |
|
|
1 |
Rs.103.14 |
|
Euro |
1 |
Rs.81.66 |
INFORMATION DETAILS
|
Analysis Done by
: |
DIV |
|
|
|
|
Report Prepared
by : |
NIS |
RATING EXPLANATIONS
|
RATING |
STATUS |
PROPOSED CREDIT LINE |
|
|
|
>86 |
Aaa |
Possesses an extremely sound financial base with the strongest
capability for timely payment of interest and principal sums |
Unlimited |
|
|
71-85 |
Aa |
Possesses adequate working capital. No caution needed for credit
transaction. It has above average (strong) capability for payment of interest
and principal sums |
Large |
|
|
56-70 |
A |
Financial & operational base are regarded healthy. General
unfavourable factors will not cause fatal effect. Satisfactory capability for
payment of interest and principal sums |
Fairly Large |
|
|
41-55 |
Ba |
Overall
operation is considered normal. Capable to meet normal commitments. |
Satisfactory |
|
|
26-40 |
B |
Capability to overcome financial difficulties seems comparatively
below average. |
Small |
|
|
11-25 |
Ca |
Adverse factors are apparent. Repayment of interest and principal sums
in default or expected to be in default upon maturity |
Limited with
full security |
|
|
<10 |
C |
Absolute credit risk exists. Caution needed to be exercised |
Credit not
recommended |
|
|
-- |
NB |
New Business |
-- |
|
This score serves as a reference to assess SC’s credit risk
and to set the amount of credit to be extended. It is calculated from a
composite of weighted scores obtained from each of the major sections of this
report. The assessed factors and their relative weights (as indicated through
%) are as follows:
Financial
condition (40%) Ownership
background (20%) Payment
record (10%)
Credit history
(10%) Market trend
(10%) Operational
size (10%)
This report is issued at your request without any
risk and responsibility on the part of MIRA INFORM PRIVATE LIMITED (MIPL)
or its officials.