MIRA
INFORM REPORT
|
Report Date : |
18.07.2014 |
IDENTIFICATION DETAILS
|
Name : |
CRESCENT PHARMA LIMITED |
|
|
|
|
Registered Office : |
Units3-4 Quidhampton
Business |
|
|
|
|
Country : |
|
|
|
|
|
Financials (as on) : |
31.12.2012 |
|
|
|
|
Date of Incorporation : |
01.05.2003 |
|
|
|
|
Com. Reg. No.: |
04750933 |
|
|
|
|
Legal Form : |
Private Limited with Share Capital |
|
|
|
|
Line of Business : |
· Manufacturer, Distributor & Exporter of Cost Conscious Generic Medicines · Manufacturer of Pharmaceuticals Products ·
Subject product categories are as follows: ·
Women’s Health ·
Oral Health ·
Sport and Fitness |
|
|
|
|
No. of Employees |
05 (31.12.2012) |
RATING & COMMENTS
|
MIRA’s Rating : |
Ba |
|
RATING |
STATUS |
PROPOSED CREDIT LINE |
|
|
41-55 |
Ba |
Overall operation is considered normal. Capable to meet normal
commitments. |
Satisfactory |
|
Status : |
Satisfactory |
|
|
|
|
Payment Behaviour : |
No complaints |
|
|
|
|
Litigation : |
Clear |
NOTES :
Any query related to this report can be made
on e-mail : infodept@mirainform.com
while quoting report number, name and date.
ECGC Country Risk Classification List – March 31, 2014
|
Country Name |
Previous Rating (31.12.2013) |
Current Rating (31.03.2014) |
|
|
A1 |
A1 |
|
Risk Category |
ECGC
Classification |
|
Insignificant |
A1 |
|
Low |
A2 |
|
Moderate |
B1 |
|
High |
B2 |
|
Very High |
C1 |
|
Restricted |
C2 |
|
Off-credit |
D |
The
|
Source : CIA |
Company name & address
Company Name: CRESCENT
PHARMA LIMITED
Company No: 04750933
Company Status: Active
- Accounts Filed
Registered Address: UNITS3-4 QUIDHAMPTON
BUSINESS
OVERTON
Company summary
Registered address UNITS3-4 QUIDHAMPTON
BUSINESS UNITS POLHAMPTON LANE
OVERTON
Trading Address 5 QUIDHAMPTON BUSINESS Units,
Quidhampton Overton,
Hampshire RG25 3ED
Telephone Number +44
(0) 1256 772730
Fax Number +44 (0) 1256
772740
Email: info@crescentpharma.com
Website Address http://www.crescentpharma.com
TPS Yes
FPS No
Incorporation Date 01/05/2003
Type Private
Limited with Share Capital
Filing date of Accounts 31.12.2012
Currency GBP
Share Capital £
5,700,000
Principal Activity
· Manufacturer, Distributor & Exporter of Cost Conscious Generic Medicines
· Manufacturer of Pharmaceuticals Products
·
Subject product categories are as follows:
·
Women’s Health
·
Oral Health
·
Sport and
Fitness.
DIRECTORS/MANAGEMENT
|
Total Current Directors |
1 |
|
Total Current
Secretaries |
0 |
|
Total Previous Directors
/ Company Secretaries |
6 |
Current Directors
|
Name |
Date of Birth |
23/11/1965 |
|
|
Officers Title |
Mr |
Nationality |
British |
|
Present Appointments |
6 |
Function |
Director |
|
Appointment Date |
01/05/2003 |
|
|
|
Address |
|
||
Current Company
Secretary
Previous
Director/Company Secretaries
|
Name |
Current Directorships |
Previous Directorships |
|
Luma Auchi |
6 |
3 |
|
Margaret Mary Bartlett |
0 |
2 |
|
Gerald Malone |
0 |
3 |
|
ACORN ACCOUNTING SOLUTIONS LTD |
1 |
3 |
|
BRIGHTON DIRECTOR LTD |
132 |
34318 |
|
BRIGHTON SECRETARY LTD |
133 |
31711 |
NEGATIVE INFORMATION
Mortgage Summary
Total Mortgage 1
Outstanding 1
Satisfied 0
CCJ
|
Total Number of Exact CCJs - |
Total Value of Exact CCJs - |
|
|
|
Total Number of Possible CCJs - |
Total Value of Possible CCJs - |
|
|
|
Total Number of Satisfied CCJs - |
Total Value of Satisfied CCJs - |
|
|
|
Total Number of Writs - |
- |
|
|
Exact CCJ Details
|
No CCJs found |
Possible CCJs
Details
|
There are no possible CCJ details |
Writ Details
|
No writs found |
Mortgage Details
|
Mortgage Type: |
CHARGE OF DEPOSIT |
||
|
Date Charge Created: |
31/10/07 |
|
|
|
Date Charge Registered: |
17/11/07 |
|
|
|
Date Charge Satisfied: |
- |
|
|
|
Status: |
OUTSTANDING |
|
|
|
Person(s) Entitled: |
NATIONAL WESTMINSTER BANK PLC |
||
|
Amount Secured: |
ALL MONIES DUE OR TO BECOME DUE FROM THE
COMPANY TO THE CHARGEE ON ANY ACCOUNT WHATSOEVER |
||
|
Details: |
ALL DEPOSITS NOW AND IN THE FUTURE CREDITED
TO ACCOUNT DESIGNATION 47019999 WITH THE BANK AND ANY DEPOSIT OR ACCOUNT
OFANY OTHER DESCRIPTION OR DESIGNATION WHICH DERIVES IN WHOLE OR IN PART FROM
SUCHDEPOSITS OR ACCOUNT |
||
SHARE & SHARE CAPITAL
INFORMATION
Top 20
Shareholders
|
Name |
Currency |
Share Count |
Share Type |
Nominal Value |
% of Total Share Count |
|
CRESCENT PHARMACEUTICALS
LTD |
GBP |
5,700,000 |
ORDINARY |
1 |
100 |
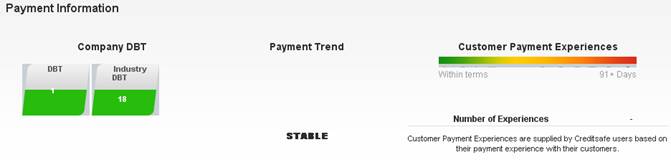
PAYMENT INFORMATION
Trade Debtors /
Bad Debt Summary
Total Number of Documented Trade 2
Total Value of Documented Trade £263,171
Trade Payment
Information
|
Average Invoice Value |
56.72 |
|
Invoices available |
32 |
|
Paid |
32 |
|
Outstanding |
0 |
Trade Payment Data is information that we collect from
selected third party partners who send us information about their whole sales
ledger.
Creditor Details
|
|
Total Number |
Total Value |
|
Trade Creditors |
0 |
- |
|
No Creditor Data |
Trade Debtors /
Bad Debt Detail
|
|
Total Number of Documented Trade |
Total Value of Documented Trade |
|
Trade Debtors |
2 |
£263,171 |
|
Company Name |
Amount |
Statement Date |
|
|
Melbrosin UK Limited |
£178,571 |
13/10/2009 |
|
|
Dexo Biopharm Limited |
£84,600 |
13/10/2009 |
|
|
Average Invoice Value |
£56.72 |
||
|
Invoices available |
32 |
||
|
Paid |
32 |
||
|
Outstanding |
0 |
||
|
Trade Payment Data is information that we
collect from selected third party partners who send us information about
their whole sales ledger. |
|
|
Within Terms |
0-30 Days |
31-60 Days |
61-90 Days |
91+ Days |
|
Paid |
12 |
20 |
0 |
0 |
0 |
|
Outstanding |
0 |
0 |
0 |
0 |
0 |
GROUP STRUCTURE & AFFILIATED
COMPANIES
Statistics
|
Group |
5 companies |
|
Linkages |
|
|
Countries |
Summary
|
Holding Company |
CRESCENT PHARMACEUTICALS
LIMITED |
|
Ownership Status |
Wholly Owned |
|
Ultimate Holding Company
|
RUNTEX CORP |
Group structure
|
Company Name |
|
Registered Number |
Latest Key Financials |
Consol. Accounts |
Turnover |
|
|
|
N/A |
- |
- |
|
|
|
07117426 |
31.12.2012 |
Y |
£16,386,153 |
|
|
|
04750933 |
31.12.2012 |
N |
£14,506,929 |
|
|
|
04766806 |
31.12.2013 |
N |
|
|
|
|
03940020 |
31.12.2012 |
N |
|
FINANCIAL INFORMATION
Key Financials
Year to date Turnover Pre Tax Profit Shareholder Funds Employees 31/12/2012 £ 14,506,929 £ 2,355,928 £ 9,813,635 5
31/12/2011 £ 13,705,413 £ 3,626,134 £ 8,082,092 5
31/12/2010 £ 7,265,429 £ 243,461 £ 5,306,355 3
Profit & Loss
|
Date Of Accounts |
31/12/12 |
(%) |
31/12/11 |
(%) |
31/12/10 |
(%) |
31/12/09 |
(%) |
31/12/08 |
|
Weeks |
52 |
(%) |
52 |
(%) |
52 |
(%) |
52 |
(%) |
52 |
|
Currency |
GBP |
(%) |
GBP |
(%) |
GBP |
(%) |
GBP |
(%) |
GBP |
|
Consolidated A/cs |
N |
(%) |
N |
(%) |
N |
(%) |
N |
(%) |
N |
|
Turnover |
£14,506,929 |
5.8% |
£13,705,413 |
88.6% |
£7,265,429 |
43.8% |
£5,050,771 |
9.2% |
£4,624,888 |
|
Export |
- |
- |
- |
- |
- |
- |
- |
- |
- |
|
Cost of Sales |
£6,793,418 |
-9.3% |
£7,487,355 |
55.2% |
£4,825,177 |
46.2% |
£3,299,766 |
-17.9% |
£4,020,614 |
|
Gross Profit |
£7,713,511 |
24.1% |
£6,218,058 |
154.8% |
£2,440,252 |
39.4% |
£1,751,005 |
189.8% |
£604,274 |
|
Wages & Salaries |
£190,386 |
28.7% |
£147,942 |
36.1% |
£108,669 |
-35.2% |
£167,815 |
23% |
£136,425 |
|
Directors Emoluments |
£20,710 |
-87.5% |
£165,077 |
- |
- |
- |
£111,000 |
155.2% |
£43,500 |
|
Operating Profit |
£5,501,215 |
21.7% |
£4,521,546 |
341.7% |
£1,023,664 |
132.3% |
£440,585 |
140.5% |
-£1,087,643 |
|
Depreciation |
£6,583 |
2.6% |
£6,415 |
18.1% |
£5,434 |
-59.5% |
£13,423 |
-43.1% |
£23,594 |
|
Audit Fees |
£11,576 |
-26.5% |
£15,740 |
109.9% |
£7,500 |
57.9% |
£4,750 |
-52.5% |
£10,000 |
|
Interest Payments |
- |
-100% |
£5 |
- |
- |
-100% |
£37 |
999.9% |
£1 |
|
Pre Tax Profit |
£2,355,928 |
-35% |
£3,626,134 |
999.9% |
-£243,461 |
-109.3% |
£2,631,597 |
343% |
-£1,083,092 |
|
Taxation |
-£624,385 |
26.6% |
-£850,397 |
-150.7% |
£1,676,600 |
- |
- |
- |
- |
|
Profit After Tax |
£1,731,543 |
-37.6% |
£2,775,737 |
93.7% |
£1,433,139 |
-45.5% |
£2,631,597 |
343% |
-£1,083,092 |
|
Dividends Payable |
- |
- |
- |
- |
- |
- |
- |
- |
- |
|
Retained Profit |
£1,731,543 |
-37.6% |
£2,775,737 |
93.7% |
£1,433,139 |
-45.5% |
£2,631,597 |
343% |
-£1,083,092 |
Balance Sheet
|
Date Of Accounts |
31/12/12 |
(%) |
31/12/11 |
(%) |
31/12/10 |
(%) |
31/12/09 |
(%) |
31/12/08 |
|
Tangible Assets |
£701,037 |
-0.6% |
£705,216 |
-47.4% |
£1,340,146 |
-48.6% |
£2,609,292 |
0.5% |
£2,597,147 |
|
Intangible Assets |
£379,981 |
-25.7% |
£511,072 |
-20.6% |
£643,691 |
-12.7% |
£737,400 |
-41% |
£1,249,332 |
|
Total Fixed Assets |
£1,081,018 |
-11.1% |
£1,216,288 |
-38.7% |
£1,983,837 |
-40.7% |
£3,346,692 |
-13% |
£3,846,479 |
|
Stock |
£975,562 |
-23.2% |
£1,270,789 |
57% |
£809,653 |
-5.6% |
£857,424 |
7.1% |
£800,537 |
|
Trade Debtors |
£4,707,095 |
19.3% |
£3,945,212 |
257.8% |
£1,102,683 |
-0.9% |
£1,112,659 |
78% |
£625,065 |
|
Cash |
£5,319,323 |
459.1% |
£951,353 |
359.3% |
£207,148 |
382.5% |
£42,929 |
-65.6% |
£124,805 |
|
Other Debtors |
£1,548,702 |
21% |
£1,279,410 |
-31.6% |
£1,870,922 |
- |
0 |
-100% |
£356,884 |
|
Miscellaneous Current
Assets |
0 |
- |
0 |
- |
0 |
- |
0 |
- |
0 |
|
Total Current Assets |
£12,550,682 |
68.5% |
£7,446,764 |
86.6% |
£3,990,406 |
98.2% |
£2,013,012 |
5.5% |
£1,907,291 |
|
Trade Creditors |
£2,609,653 |
444.3% |
£479,438 |
-10.3% |
£534,674 |
-64% |
£1,486,488 |
-22% |
£1,905,539 |
|
Bank Loans &
Overdrafts |
0 |
- |
0 |
- |
0 |
- |
0 |
- |
0 |
|
Other Short Term Finance |
0 |
- |
0 |
- |
0 |
- |
0 |
-100% |
£46,318 |
|
Miscellaneous Current
Liabilities |
£1,208,412 |
999.9% |
£101,522 |
-23.8% |
£133,214 |
- |
0 |
-100% |
£34,429 |
|
Total Current
Liabilities |
£3,818,065 |
557.2% |
£580,960 |
-13% |
£667,888 |
-55.1% |
£1,486,488 |
-25.2% |
£1,986,286 |
|
Bank Loans &
Overdrafts and LTL |
0 |
- |
0 |
- |
0 |
- |
0 |
-100% |
£2,380,105 |
|
Other Long Term Finance |
0 |
- |
0 |
- |
0 |
- |
0 |
-100% |
£2,380,105 |
|
Total Long Term
Liabilities |
0 |
- |
0 |
- |
0 |
- |
0 |
-100% |
£2,380,105 |
Capital &
Reserves
|
Date Of Accounts |
31/12/12 |
(%) |
31/12/11 |
(%) |
31/12/10 |
(%) |
31/12/09 |
(%) |
31/12/08 |
|
Called Up Share Capital |
£5,700,000 |
- |
£5,700,000 |
- |
£5,700,000 |
- |
£5,700,000 |
- |
£5,700,000 |
|
P & L Account
Reserve |
£4,113,635 |
72.7% |
£2,382,092 |
705.1% |
-£393,645 |
78.5% |
-£1,826,784 |
57.6% |
-£4,312,621 |
|
Revaluation Reserve |
- |
- |
- |
- |
- |
- |
- |
- |
- |
|
Sundry Reserves |
- |
- |
- |
- |
- |
- |
- |
- |
- |
|
Shareholder Funds |
£9,813,635 |
21.4% |
£8,082,092 |
52.3% |
£5,306,355 |
37% |
£3,873,216 |
179.2% |
£1,387,379 |
Other Financial
Items
|
Date Of Accounts |
31/12/12 |
(%) |
31/12/11 |
(%) |
31/12/10 |
(%) |
31/12/09 |
(%) |
31/12/08 |
|
Net Worth |
£9,433,654 |
24.6% |
£7,571,020 |
62.4% |
£4,662,664 |
48.7% |
£3,135,816 |
999.9% |
£138,047 |
|
Working Capital |
£8,732,617 |
27.2% |
£6,865,804 |
106.6% |
£3,322,518 |
531% |
£526,524 |
766.5% |
-£78,995 |
|
Total Assets |
£13,631,700 |
57.4% |
£8,663,052 |
45% |
£5,974,243 |
11.5% |
£5,359,704 |
-6.8% |
£5,753,770 |
|
Total Liabilities |
£3,818,065 |
557.2% |
£580,960 |
-13% |
£667,888 |
-55.1% |
£1,486,488 |
-66% |
£4,366,391 |
|
Net Assets |
£9,813,635 |
21.4% |
£8,082,092 |
52.3% |
£5,306,355 |
37% |
£3,873,216 |
179.2% |
£1,387,379 |
Cash Flow
|
Date Of Accounts |
31/12/12 |
(%) |
31/12/11 |
(%) |
31/12/10 |
(%) |
31/12/09 |
(%) |
31/12/08 |
|
Net Cashflow from
Operations |
£4,363,023 |
480.9% |
£751,047 |
266.2% |
£205,117 |
- |
- |
- |
- |
|
Net Cashflow before
Financing |
£4,367,970 |
486.9% |
£744,210 |
353.2% |
£164,220 |
- |
- |
- |
- |
|
Net Cashflow from
Financing |
- |
- |
- |
- |
- |
- |
- |
- |
- |
|
Increase in Cash |
£4,367,970 |
486.9% |
£744,210 |
353.2% |
£164,220 |
- |
- |
- |
- |
Miscellaneous
|
Date Of Accounts |
31/12/12 |
(%) |
31/12/11 |
(%) |
31/12/10 |
(%) |
31/12/09 |
(%) |
31/12/08 |
|
Contingent Liability |
NO |
- |
NO |
- |
NO |
- |
NO |
- |
NO |
|
Capital Employed |
£9,813,635 |
21.4% |
£8,082,092 |
52.3% |
£5,306,355 |
37% |
£3,873,216 |
2.8% |
£3,767,484 |
|
Number of Employees |
5 |
- |
5 |
66.7% |
3 |
-25% |
4 |
- |
4 |
|
Auditors |
CW FELLOWES LIMITED |
||||||||
|
Auditor Comments |
The audit report
contains no adverse comments |
||||||||
|
Bankers |
NATIONAL WESTMINSTER
BANK PLC |
||||||||
|
Bank Branch Code |
60-10-12 |
||||||||
Ratios
|
Date Of Accounts |
31/12/12 |
31/12/11 |
31/12/10 |
31/12/09 |
31/12/08 |
|
Pre-tax profit margin % |
16.24 |
26.46 |
-3.35 |
52.10 |
-23.42 |
|
Current ratio |
3.29 |
12.82 |
5.97 |
1.35 |
0.96 |
|
Sales/Net Working
Capital |
1.66 |
2 |
2.19 |
9.59 |
-58.55 |
|
Gearing % |
0 |
0 |
0 |
0 |
171.60 |
|
Equity in % |
74.10 |
99.10 |
99.50 |
83.80 |
30.80 |
|
Creditor Days |
65.47 |
12.73 |
26.78 |
107.12 |
149.97 |
|
Debtor Days |
118.10 |
104.78 |
55.24 |
80.18 |
49.19 |
|
Liquidity/Acid Test |
3.03 |
10.63 |
4.76 |
0.77 |
0.55 |
|
Return On Capital
Employed % |
24 |
44.86 |
-4.58 |
67.94 |
-28.74 |
|
Return On Total Assets
Employed % |
17.28 |
41.85 |
-4.07 |
49.09 |
-18.82 |
|
Current Debt Ratio |
0.38 |
0.07 |
0.12 |
0.38 |
1.43 |
|
Total Debt Ratio |
0.38 |
0.07 |
0.12 |
0.38 |
3.14 |
|
Stock Turnover Ratio % |
6.72 |
9.27 |
11.14 |
16.97 |
17.30 |
|
Return on Net Assets
Employed % |
24 |
44.86 |
-4.58 |
67.94 |
-78.06 |
ADDITIONAL INFORMATION
Commentary
|
No exact match CCJs are recorded against the
company. |
|
|
Sales in the latest trading period increased
5.8% on the previous trading period. |
|
|
Net Worth increased by 24.6% during the
latest trading period. |
|
|
A 57.4% growth in Total Assets occurred
during the latest trading period. |
|
|
Pre-tax profits decreased by 35% compared to
the previous trading period. |
|
|
The company saw an increase in their Cash
Balance of 459.1% during the latest trading period. |
|
|
The audit report contains no adverse
comments. |
|
|
No recent changes in directorship are
recorded. |
|
|
The company is part of a group. |
|
|
The company has changed its registered
address recently. |
|
|
The company was established over 10 years
ago. |
|
Status History
|
No Status History found |
Event History
|
Date |
Description |
|
13/02/2014 |
Annual Returns |
|
14/10/2013 |
New Accounts Filed |
|
14/10/2013 |
New Accounts Filed |
|
18/07/2013 |
Annual Returns |
|
15/01/2013 |
Annual Returns |
|
10/10/2012 |
New Accounts Filed |
|
10/10/2012 |
New Accounts Filed |
|
19/04/2012 |
Change in Reg.Office |
|
19/04/2012 |
Change of Company Postcode |
|
18/02/2012 |
Annual Returns |
|
12/10/2011 |
New Accounts Filed |
|
12/10/2011 |
New Accounts Filed |
|
07/10/2011 |
Change in Reg.Office |
|
07/10/2011 |
Change of Company Postcode |
|
30/05/2011 |
Annual Returns |
FOREIGN EXCHANGE RATES
|
Currency |
Unit
|
Indian Rupees |
|
US Dollar |
1 |
Rs.60.14 |
|
|
1 |
Rs.103.00 |
|
Euro |
1 |
Rs.81.33 |
INFORMATION DETAILS
|
Analysis Done by
: |
RAS |
|
|
|
|
Report Prepared
by : |
MNL |
RATING EXPLANATIONS
|
RATING |
STATUS |
PROPOSED CREDIT LINE |
|
|
|
>86 |
Aaa |
Possesses an extremely sound financial base with the strongest
capability for timely payment of interest and principal sums |
Unlimited |
|
|
71-85 |
Aa |
Possesses adequate working capital. No caution needed for credit
transaction. It has above average (strong) capability for payment of interest
and principal sums |
Large |
|
|
56-70 |
A |
Financial & operational base are regarded healthy. General unfavourable
factors will not cause fatal effect. Satisfactory capability for payment of
interest and principal sums |
Fairly Large |
|
|
41-55 |
Ba |
Overall operation is considered normal. Capable to meet normal
commitments. |
Satisfactory |
|
|
26-40 |
B |
Capability to overcome financial difficulties seems comparatively
below average. |
Small |
|
|
11-25 |
Ca |
Adverse factors are apparent. Repayment of interest and principal sums
in default or expected to be in default upon maturity |
Limited with
full security |
|
|
<10 |
C |
Absolute credit risk exists. Caution needed to be exercised |
Credit not
recommended |
|
|
-- |
NB |
New Business |
-- |
|
This score serves as a reference to assess SC’s credit risk
and to set the amount of credit to be extended. It is calculated from a
composite of weighted scores obtained from each of the major sections of this
report. The assessed factors and their relative weights (as indicated through
%) are as follows:
Financial
condition (40%) Ownership
background (20%) Payment
record (10%)
Credit history
(10%) Market trend (10%) Operational size
(10%)
This report is issued at your request without any
risk and responsibility on the part of MIRA INFORM PRIVATE LIMITED (MIPL)
or its officials.