MIRA
INFORM REPORT
|
Report Date : |
21.07.2014 |
IDENTIFICATION DETAILS
|
Name : |
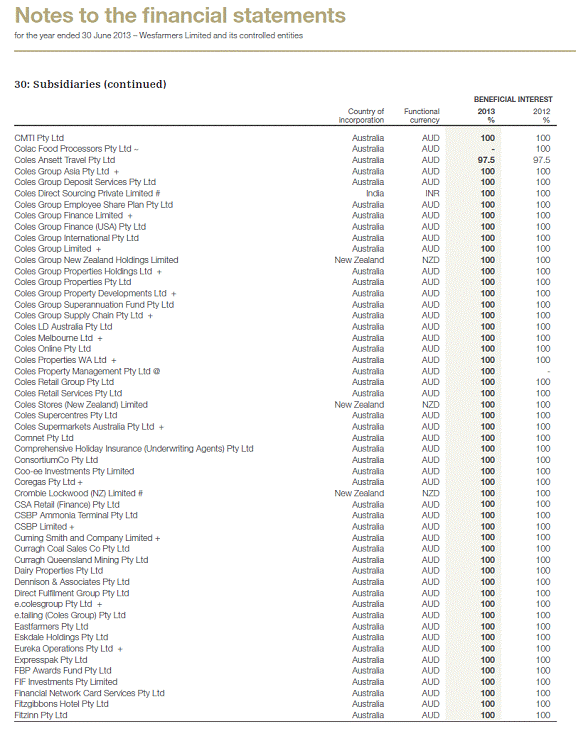
COLES GROUP NEW ZEALAND HOLDINGS LIMITED |
|
|
|
|
Formerly known as : |
COLES MYER NEW ZEALAND |
|
|
|
|
Registered Office : |
C/O Minter Ellison Rudd Watts
Limited Level 20, Lumley Centre, 88 Shortland Street, Auckland Central, Auckland Postal Code 1010 |
|
|
|
|
Country : |
New Zealand |
|
|
|
|
Financials (as on) : |
30.06.2013 (Consolidated) 30.06.2013 (Group Consolidated) |
|
|
|
|
Date of Incorporation : |
04.05.1987 |
|
|
|
|
Com. Reg. No.: |
335513 |
|
|
|
|
Legal Form : |
Limited Private Company |
|
|
|
|
Line of Business : |
· Subject operates 16 discount department stores in New Zealand under the name KMART. · Subject is part of Wesfarmers Limited Subject product ranges includes · Apparel · Fashion accessories · Beauty products · Home products · Health & beauty products · Outdoor living products · Entertainment products · Toys & sporting products · Automotive products · Camping & fishing products |
|
|
|
|
No of Employees : |
1,000 employees (Subject); 200,000 employees (Wesfarmers Group) |
RATING & COMMENTS
|
MIRA’s Rating : |
Ba |
|
RATING |
STATUS |
PROPOSED CREDIT LINE |
|
|
41-55 |
Ba |
Overall operation is considered normal. Capable to meet normal
commitments. |
Satisfactory |
|
Status : |
Satisfactory |
|
|
|
|
Payment Behaviour : |
No Complaints |
|
|
|
|
Litigation : |
Clear |
NOTES :
Any query related to this report can be made
on e-mail : infodept@mirainform.com
while quoting report number, name and date.
ECGC Country Risk Classification List – March 31, 2014
|
Country Name |
Previous Rating (31.12.2013) |
Current Rating (31.03.2014) |
|
New Zealand |
A1 |
A1 |
|
Risk Category |
ECGC
Classification |
|
Insignificant |
A1 |
|
Low Risk |
A2 |
|
Moderate Low Risk |
B1 |
|
Moderate Risk |
B2 |
|
Moderate High Risk |
C1 |
|
High Risk |
C2 |
|
Very High Risk |
D |
New Zealand ECONOMIC
OVERVIEW
Over the past
20 years the government has transformed New Zealand from an agrarian economy
dependent on concessionary British market access to a more industrialized, free
market economy that can compete globally. This dynamic growth has boosted real
incomes - but left behind some at the bottom of the ladder - and broadened and
deepened the technological capabilities of the industrial sector. Per capita
income rose for ten consecutive years until 2007 in purchasing power parity
terms, but fell in 2008-09. Debt-driven consumer spending drove robust growth
in the first half of the decade, helping fuel a large balance of payments
deficit that posed a challenge for economic managers. Inflationary pressures
caused the central bank to raise its key rate steadily from January 2004 until
it was among the highest in the OECD in 2007-08; international capital inflows
attracted to the high rates further strengthened the currency and housing
market, however, aggravating the current account deficit. The economy fell into
recession before the start of the global financial crisis and contracted for
five consecutive quarters in 2008-09. In line with global peers, the central
bank cut interest rates aggressively and the government developed fiscal
stimulus measures. The economy pulled out of recession late in 2009, and
achieved 2-3% per year growth in 2010-13. Nevertheless, key trade sectors
remain vulnerable to weak external demand. The government plans to raise
productivity growth and develop infrastructure, while reining in government
spending.
|
Source : CIA |
CORPORATE DETAILS
|
Verified
Address |
|
Subject name |
Registered address |
SUMMARY DETAILS
|
Report
Summary |
|
Date registered 200,000 employees (Wesfarmers
Group) |
Paid-up capital |
CREDIT RISK OUTLOOK
|
Credit Risk Interpretation |
|
Credit risk rating |
|
|
Subject’s
Credit Risk Analysis |
|
Country risk |
Organisation structure |
STATUTORY DETAILS
|
Registry
Information |
|
Date registered |
Statutory status |
BOARD OF MANAGEMENT
|
Key
Personnel |
|
Name |
|
BOARD OF DIRECTORS
|
Appointments |
|
Name |
Staff employed |
|
Other
Appointments |
|
Auditor |
|
SHARE CAPITAL
|
Composition |
|
Authorized capital |
Paid-up capital |
OWNERSHIP / SHAREHOLDERS
|
Composition |
|
How listed |
|
CORPORATE AFFILIATIONS AND RELATED COMPANIES
|
Structure |
|
Company name |
Remarks on corporate affiliations and related companies |
BANK AND MORTGAGES
|
Bank
Details |
|
Name of bank |
Comments |
|
Mortgages |
|
None reported. |
|
|
Legal
Filings |
|
Bankruptcy filings |
Tax liens |
FINANCIAL STATISTICS
|
Description |
|
Financial statement source |
Currency of financial statement |
|
Concise
Financial Data |
Consolidation
style |
Consolidated |
Consolidated |
Group
Consolidated |
|
|
Currency |
New
Zealand, Dollar (NZD) |
New
Zealand, Dollar (NZD) |
Australia
Dollar (AUD) |
|
|
Date
of financial year end |
30/06/13 |
30/06/12 |
30/06/13 |
|
|
Length
of financial accounts |
12 months |
12 months |
12 months |
|
|
Sales
turnover / Revenue / Income |
228,900,263.00 |
208,607,228.00 |
59,832,000,000.00 |
|
|
Gross
profit |
101,108,964.00 |
83,893,358.00 |
|
|
|
Profit
/ Loss before tax |
27,304,615.00 |
14,623,023.00 |
3,226,000,000.00 |
|
|
Net
income / loss |
19,659,852.00 |
8,998,874.00 |
2,261,000,000.00 |
|
|
Non-current
assets |
247,810,644.00 |
208,931,369.00 |
32,569,000,000.00 |
|
|
Property,
plant and equipment |
12,442,350.00 |
13,684,201.00 |
10,164,000,000.00 |
|
|
Current
assets |
63,838,661.00 |
65,129,446.00 |
10,586,000,000.00 |
|
|
Inventories |
41,050,107.00 |
36,509,917.00 |
5,047,000,000.00 |
|
|
Cash
and cash equivalents |
20,910,702.00 |
18,079,229.00 |
1,333,000,000.00 |
|
|
Accounts
receivable |
1,877,852.00 |
2,249,973.00 |
2,341,000,000.00 |
|
|
Total
assets |
311,649,305.00 |
274,060,815.00 |
43,155,000,000.00 |
|
|
Current
liabilities |
39,729,897.00 |
21,607,522.00 |
9,572,000,000.00 |
|
|
Non-current
liabilities |
2,077,224.00 |
2,270,961.00 |
7,561,000,000.00 |
|
|
Accounts
payable |
29,024,694.00 |
17,064,091.00 |
5,999,000,000.00 |
|
|
Total
liabilities |
41,807,121.00 |
23,878,483.00 |
17,133,000,000.00 |
|
|
Share
equity |
269,842,184.00 |
250,182,332.00 |
26,022,000,000.00 |
|
|
Retained
earnings |
266,144,339.00 |
246,484,487.00 |
2,375,000,000.00 |
|
|
Reserves |
3,696,045.00 |
3,696,045.00 |
383,000,000.00 |
|
Remarks |
|
The consolidated financial
statement above relates to the Subject and its only subsidiary CGNZ Finance
Limited. |
BUSINESS DETAILS
|
Operational Details |
|
Main activities Products and services |
|
Purchases |
|
Local |
International |
|
Sales |
|
Local |
International |
|
Business
Facilities and Assets |
|
Premises |
Branches |
SUMMARIZED COUNTRY RISK
|
Gross
Domestic Products (GDP) and Economic Overview |
|
Central bank |
Public debt (general Government gross debt as percentage (%) of
GDP) |
|
Trade
and Competitiveness Overview |
|
Total exports |
Major export partners |
|
Country
and Population Overview |
|
Total population |
Currency |
PAYMENT OUTLOOK
|
Purchases
Term |
|
Local |
International |
|
Sales
Term |
|
Local |
|
|
Trade
Reference / Payment Behaviour |
|
Comments |
|
|
Investigation
Note |
|
Sources |
|
Attachments |
|
Attachments |
KEY FINANCIAL RATIOS
|
For
financial year end |
30/06/13 |
30/06/12 |
. |
|
Profitability |
. |
. |
. |
|
Gross profit (loss) margin (%) |
44.17 |
40.22 |
|
|
Pre-tax profit (loss) margin (%) |
11.93 |
11.93 |
|
|
Net profit (loss) margin (%) |
8.59 |
4.31 |
|
|
Earnings per share (currency based on financial statement) |
10,922.14 |
4,999.37 |
|
|
Return
on Invested Capital |
. |
. |
. |
|
Return on assets (%) |
6.31 |
3.28 |
|
|
Return on equity (%) |
7.29 |
3.60 |
|
|
Liquidity |
. |
. |
. |
|
Current ratio |
1.61 |
3.01 |
|
|
Quick ratio |
0.57 |
1.32 |
|
|
Cash ratio |
0.33 |
0.28 |
|
|
Accounts receivable turnover ratio (times) |
121.89 |
92.72 |
|
|
Accounts payable turnover ratio (times) |
7.89 |
12.22 |
|
|
Collection period (days) |
2.99 |
3.94 |
|
|
Payment period (days) |
46.28 |
29.86 |
|
|
Inventory turnover ratio (times) |
5.58 |
5.71 |
|
|
Inventory conversion period (days) |
65.46 |
63.88 |
|
|
Asset
Management |
. |
. |
. |
|
Fixed asset turnover ratio (times) |
18.40 |
15.24 |
|
|
Asset turnover ratio (times) |
0.73 |
0.76 |
|
|
Capital
Structure and Solvency |
. |
. |
. |
|
Total debt to asset ratio (%) |
13.41 |
8.71 |
|
|
Total debt to equity ratio (%) |
15.49 |
9.54 |
|
|
Non-current debt to equity ratio (%) |
0.77 |
0.91 |
|


FOREIGN EXCHANGE RATES
|
Currency |
Unit
|
Indian Rupees |
|
US Dollar |
1 |
Rs.60.33 |
|
UK Pound |
1 |
Rs.103.18 |
|
Euro |
1 |
Rs.81.58 |
INFORMATION DETAILS
|
Analysis Done by
: |
RAS |
|
|
|
|
Report Prepared
by : |
MNL |
RATING EXPLANATIONS
|
RATING |
STATUS |
PROPOSED CREDIT LINE |
|
|
>86 |
Aaa |
Possesses an extremely sound financial base with the strongest
capability for timely payment of interest and principal sums |
Unlimited |
|
71-85 |
Aa |
Possesses adequate working capital. No caution needed for credit
transaction. It has above average (strong) capability for payment of interest
and principal sums |
Large |
|
56-70 |
A |
Financial & operational base are regarded healthy. General
unfavourable factors will not cause fatal effect. Satisfactory capability for
payment of interest and principal sums |
Fairly Large |
|
41-55 |
Ba |
Overall operation is considered normal. Capable to meet normal
commitments. |
Satisfactory |
|
26-40 |
B |
Capability to overcome financial difficulties seems comparatively
below average. |
Small |
|
11-25 |
Ca |
Adverse factors are apparent. Repayment of interest and principal sums
in default or expected to be in default upon maturity |
Limited with
full security |
|
<10 |
C |
Absolute credit risk exists. Caution needed to be exercised |
Credit not
recommended |
|
-- |
NB |
New Business |
-- |
This score serves as a reference to assess SC’s credit risk
and to set the amount of credit to be extended. It is calculated from a
composite of weighted scores obtained from each of the major sections of this
report. The assessed factors and their relative weights (as indicated through
%) are as follows:
Financial
condition (40%) Ownership
background (20%) Payment
record (10%)
Credit history
(10%) Market trend
(10%) Operational
size (10%)
This report is issued at your request without any
risk and responsibility on the part of MIRA INFORM PRIVATE LIMITED (MIPL)
or its officials.