MIRA
INFORM REPORT
|
Report Date : |
21.07.2014 |
|
|
|
|
Tel. No.: |
66 2 832 1000 |
|
Fax No.: |
66 2 832 1159 |
IDENTIFICATION DETAILS
|
Name : |
HOME PRODUCT CENTER
PUBLIC COMPANY LIMITED |
|
|
|
|
Registered Office : |
96/27 MOO 9, T.
BANGKHEN, A. MUANG, NONTHABURI 11000 |
|
|
|
|
Country : |
|
|
|
|
|
Financials (as on) : |
31.12.2013 |
|
|
|
|
Date of Incorporation : |
1995 |
|
|
|
|
Com. Reg. No.: |
0107544000043 |
|
|
|
|
Legal Form : |
Public Limited Company |
|
|
|
|
Line of Business : |
Subject is engaged in
retail business,
distributing and providing
wide ranges of
products related to
construction, decoration, renovation
and refurbishment of
residence and building. |
|
|
|
|
No. of Employees : |
8148 |
RATING & COMMENTS
|
MIRA’s Rating : |
Ba |
|
RATING |
STATUS |
PROPOSED CREDIT LINE |
|
|
41-55 |
Ba |
Overall operation is considered normal. Capable to meet normal
commitments. |
Satisfactory |
|
Status : |
Satisfactory |
|
Payment Behaviour : |
No Complaints |
|
Litigation : |
Clear |
NOTES :
Any query related to this report can be made
on e-mail : infodept@mirainform.com
while quoting report number, name and date.
ECGC Country Risk Classification List – March 31, 2014
|
Country Name |
Previous Rating (31.12.2013) |
Current Rating (31.03.2014) |
|
Thailand |
B1 |
B1 |
|
Risk Category |
ECGC
Classification |
|
Insignificant |
A1 |
|
Low Risk |
A2 |
|
Moderately Low Risk |
B1 |
|
Moderate Risk |
B2 |
|
Moderately High Risk |
C1 |
|
High Risk |
C2 |
|
Very High Risk |
D |
THAILAND - ECONOMIC OVERVIEW
With a well-developed infrastructure,
a free-enterprise economy, generally pro-investment policies, and strong export
industries, Thailand achieved steady growth due largely to industrial and
agriculture exports - mostly electronics, agricultural commodities, automobiles
and parts, and processed foods. Unemployment, at less than 1% of the labor
force, stands as one of the lowest levels in the world, which puts upward
pressure on wages in some industries. Thailand also attracts nearly 2.5 million
migrant workers from neighboring countries. The Thai government in 2013
implemented a nation-wide 300 baht ($10) per day minimum wage policy and
deployed new tax reforms designed to lower rates on middle-income earners. The
Thai economy has weathered internal and external economic shocks in recent
years. The global economic recession severely cut Thailand's exports, with most
sectors experiencing double-digit drops. In late 2011 Thailand's recovery was
interrupted by historic flooding in the industrial areas in Bangkok and its
five surrounding provinces, crippling the manufacturing sector. The government
approved flood mitigation projects worth $11.7 billion, which were started in
2012, to prevent similar economic damage, and an additional $75 billion for
infrastructure over the following seven years. This was expected to lead to an
economic upsurge but growth has remained slow, in part due to ongoing political
unrest and resulting uncertainties. Spending on infrastructure will require
re-approval once a new government is seated.
|
Source
: CIA |
Company Name
HOME PRODUCT
CENTER PUBLIC COMPANY
LIMITED
SUMMARY
BUSINESS ADDRESS : 96/27
MOO 9, T. BANGKHEN,
A. MUANG,
NONTHABURI 11000,
THAILAND
TELEPHONE : [66] 2832-1000
FAX : [66] 2832-1400
E-MAIL ADDRESS : info@homepro.co.th
REGISTRATION ADDRESS : SAME AS BUSINESS
ADDRESS
ESTABLISHED : 1995
REGISTRATION NO. : 0107544000043 [Former : BOR MOR
JOR. 665]
TAX ID NO. : 3011607091
CAPITAL REGISTERED : BHT.
10,959,900,988
CAPITAL PAID-UP : BHT.
10,959,456,991
FISCAL YEAR CLOSING DATE : DECEMBER 31
LEGAL STATUS : PUBLIC LIMITED
COMPANY
EXECUTIVE : MR. KHUNAWUT THUMPOMKUL,
THAI
MANAGING DIRECTOR
NO. OF STAFF : 8,148
LINES OF BUSINESS : CONSTRUCTION AND
HOME DECORATIVE
PRODUCTS
RETAIL BUSINESS
CORPORATE PROFILE
OPERATING TREND : STABLE
PRESENT SITUATION : OPERATING NORMALLY
REPUTATION : GOOD
WITH NORMAL BUSINESS
ENGAGEMENT
MANAGEMENT STANDARD : MANAGEMENT
WITH GOOD PERFORMANCE
HISTORY
The subject was
established on June
27, 1995 originally as
a private limited company, under
the name “Home
Products Center Company
Limited” by Thai
groups, in order to operate
a retail business
of construction and
home decorative products,
under the shop
name “HOME PRO”.
On May 29,
2001, subject changed its
style to be
public company, named HOME PRODUCT
CENTER PUBLIC COMPANY
LIMITED, and listed
on the Stock Exchange of
Thailand on October 30,
2001.
As at December
31, 2013, “HOMPRO”
shop was operated
64 branches, consists
of 21 branches in
Bangkok and 43 branches in
provincial. The subject
currently employs 8,148
staff.
The subject’s registered
address is 96/27 Moo 9,
T. Bangkhen, A. Muang, Nonthaburi
11000, and this
is the subject’s
current operation address.
THE BOARD
OF DIRECTORS
|
Name |
|
Nationality |
Age |
|
|
|
|
|
|
Mr. Pong Sarasin |
|
Thai |
87 |
|
Mr. Anant Asavabhokhin |
[x] |
Thai |
64 |
|
Mr. Naporn Sunthornchitcharoen |
[x] |
Thai |
56 |
|
Mr. Joompol Meesook |
[x] |
Thai |
65 |
|
Mrs. Suwanna Buddhaprasart |
[x] |
Thai |
59 |
|
Mr. Achawin Asavabhokin |
|
Thai |
- |
|
Mr. Manit Udomkunatum |
[x] |
Thai |
69 |
|
Mr. Rutt Phanijpand |
|
Thai |
67 |
|
Mr. Apilas Osatananda |
|
Thai |
80 |
|
Mr. Khunawut Thumpomkul |
[x] [-] |
Thai |
57 |
|
Mr. Thaveevat Tatiyamaneekul |
|
Thai |
69 |
|
Mr. Chanin Roonsamrarn |
|
Thai |
67 |
AUTHORIZED PERSON
Two of the mentioned directors [x] can jointly sign on behalf of the
subject with company’s
affixed. In case
of contact to
government sector, the
mentioned director [-]
can sign on
behalf of the
subject with company’s
affixed.
MANAGEMENT
Mr. Khunawut Thumpomkul is
the Managing Director.
He is Thai
nationality with the
age of 57 years old.
Mr. Weerapun Ungsumalee is
the Senior Vice
President Operation.
He is Thai
nationality.
Ms. Jarusopha Thumkathikanon is
the Senior Vice
President Merchandising -
Soft Line.
She is Thai
nationality.
Ms. Siriwan Paimsethasin is
the Senior Vice
President Merchandising -
Hard Line.
She is Thai
nationality.
Mrs. Jariya Sorathorn is the
Senior Vice President
Merchandising-Home Electric product.
She is Thai
nationality.
Ms. Tharathip Trimankhong is
the Senior Vice
President International Merchandising.
She is Thai
nationality.
Mr. Chaiyuth Karunyasopon is the
Senior Vice President
Supply Chain.
He is Thai
nationality.
Mr. Vathanyu Visuthikosol is
the Senior Vice
President Business Development.
He is Thai
nationality.
Mr. Anuchar Jitjaturunt is
the Senior Vice
President International Business.
He is Thai
nationality.
Mr. Nat Jarlitchana is the
Senior Vice President
Marketing.
He is Thai nationality.
Ms. Supada Chamod is
the Senior Vice
President Information and
Communication Technology. She
is Thai nationality.
Mr. Nitat Aroontippaitoon is the
Senior Vice President
Human Resource and
Loss Prevention. He
is Thai nationality.
Ms. Wannee Juntamongkol is the
Senior Vice President
Accounting and Finance.
She is Thai
nationality.
BUSINESS OPERATIONS
The subject is engaged in retail
business, distributing and providing
wide ranges of
products related to
construction, decoration, renovation
and refurbishment of
residence and building,
under the name
“HOMEPRO”. The subject
currently has over
60,000 product items,
which are divided
into 7 groups
comprising:
·
Construction
and Home improvement
Group
·
Bathroom
and Sanitary Group
·
Kitchen & Home
Electric Appliance Group
·
Lighting & Electrical Group
·
Bedding & Decorative Products
Group
·
Home
Care Service Group
·
Quick
Service Group
Subject also provide
consulting service of
construction.
PURCHASE
The products are
purchased from both domestic
and overseas suppliers
in France, Japan, Republic of China,
Taiwan, United Kingdom,
Germany, Korea, United States
of America, Italy and
etc.
MAJOR SUPPLIERS
Siam Sanitary Ware
Industry Co., Ltd. : Thailand
Thai Ceramic Co.,
Ltd. : Thailand
TOA Paint [Thailand]
Co., Ltd. : Thailand
American Standard B & K [Thailand] Public
Company limited :
Thailand
SALES
The products are
sold locally by
retail to end-users,
through the “HOMEPRO”
shop with a
total of 64
branches, which 21
branches in Bangkok
and 43 in
provincial, such as
Nonthaburi, Chiangmai,
Phisanuloke, Udon Thani, Chonburi,
Khon Kaen, Pattaya [Chonburi],
Rayong, Phuket, Hadyai
[Songkhla], Hua Hin [Prachuabkirikhan], Samui [Suratthani], Ubonratchathani, Sakolnakorn,
Suphanburi, Samutprakarn, Samutsakorn,
Burirum and etc.
REVENUE STRUCTURE
[Company and
Subsidiaries]
[unit : million Baht]
|
|
2013 |
2012 |
||
|
Products |
Amount |
% |
Amount |
% |
|
|
|
|
|
|
|
1. Retail Sales
Income |
|
|
|
|
|
- Hard line |
32,246.0 |
75.3 |
28,049.1 |
75.9 |
|
- Soft line |
7,010.4 |
16.4 |
5,936.9 |
16.1 |
|
2 Project Sales
Income |
675.7 |
1.6 |
555.6 |
1.4 |
|
3. Income From Subsidiary |
179.5 |
0.4 |
- |
- |
|
Total Sale Income |
40,111.6 |
93.7 |
34,541.6 |
93.4 |
|
Other Income |
2,718.6 |
6.3 |
2,422.7 |
6.6 |
|
Total Revenue |
42,830.2 |
100.0 |
36,969.3 |
100.0 |
SUBSIDIARY
Market Village
Co., Ltd.
Business Type : Management
service of “Hua Hin
Market Village” Plaza
Investment : The
subject holds 99.99%
of the company’s
shares.
Home Product
Center [Malaysia] Sdn. Bhd.
Business Type : Home
products retail business
Investment : The
subject holds 100%
of the company’s
shares.
Mega Home
Center Co., Ltd.
Business Type : Wholesale
and retail distributor
of construction equipment
and home products
Investment : The
subject holds 99.99%
of the company’s
shares.
DC Service
Center Co., Ltd.
Business Type : Depot
and transportation management
operator
Investment : The
subject holds 99.99%
of the company’s
shares.
LITIGATION
Bankruptcy and
Receivership
There are no
litigation on bankruptcy
and receivership cases
filed against the
subject found at
Legal Execution Department
for the past
five years.
Others
There are no
legal suits filed
against the subject
according for the
past two years.
CREDIT
Sales are by
cash or on
the credit term
of 30 days.
Local bills are
paid by cash
or on the
credits term of
30-60 days.
Imports are by
L/C at sight
or T/T.
BANKING
Bangkok Bank Public
Co., Ltd.
Kasikornbank Public Co.,
Ltd.
Citibank N.A.
Krung Thai Bank
Public Co., Ltd.
The Siam Commercial
Bank Public Co.,
Ltd.
TMB Bank Public
Co., Ltd.
EMPLOYMENT
The subject employs
8,148 staff as
the followings:
Head office :
1,910 staff
Branch office
: 6,238 staff
LOCATION DETAILS
The premise is owned for
administrative office at the heading
address. Premise is located
in commercial/residential area.
Warehouse is located
at A. Wangnoi,
Ayutthaya province.
COMMENT
During the past
three years, the
subject has constantly
grown with its
focus on the
core business as
retailer of construction
and related products.
It has continued
expanding with increasing number
of branches to
64 in 2014.
Subject also has
a good business
growth after massive
floods recovery in the
late of 2011.
The subject has
grown vigorously with variety
of DIY products
that served consumers a
modern lifestyle.
FINANCIAL INFORMATION
The capital was
initially registered at Bht. 275,000,000 divided
into 2,750,000 shares
of Bht. 100 each.
The latest registered
capital was increased
to Bht. 10,959,900,988 divided
into
10,959,900,988 shares of
Bht. 1 each, with
a current paid-up
capital of Bht.
10,959,456,991.
THE SHAREHOLDERS
LISTED WERE : [as at
April 23, 2014]
at Bht. 9,589,847,893 of capitalization
|
NAME |
HOLDING |
% |
|
|
|
|
|
Land and Houses
Public Company Limited |
2,899,078,024 |
30.23 |
|
Quality Houses Public
Company Limited |
1,895,962,255 |
19.77 |
|
Mr. Niti Osathanukroh |
453,115,661 |
4.73 |
|
Mr. Manit Udomkunatum |
295,306,666 |
3.08 |
|
AIA Company Limited-DI-LIFE |
231,571,215 |
2.41 |
|
Mr. Jun Wanawit |
205,835,091 |
2.15 |
|
Thai NVDR Co.,
Ltd. |
163,477,638 |
1.70 |
|
Chase Nominees Limited
1 |
152,775,858 |
1.59 |
|
Mr. Khunawut Thumpomkul |
138,248,643 |
1.44 |
|
Sarasin Co., Ltd. |
122,177,688 |
1.28 |
|
Other shareholders |
3,032,299,154 |
31.62 |
Total Shareholders : 39,614
NAME OF AUDITOR
& CERTIFIED PUBLIC
ACCOUNTANT NO. :
Ms. Kingkarn Asawarangsarit No.
4496
Ernst & Yiung Office Limited
BALANCE SHEET
[BAHT]
The latest financial figures published
as at December
31, 2013, 2012 &
2011 were:
ASSETS
|
Current Assets |
2013 |
2012 [Restated] |
2011 |
|
|
|
|
|
|
Cash and cash
equivalents |
687,177,529 |
1,227,886,946 |
1,933,407,325 |
|
Trade and other
receivable |
1,409,121,568 |
1,243,809,293 |
994,643,442 |
|
Short-term loan to
related party |
654,000,000 |
- |
- |
|
Inventories |
5,975,585,660 |
5,352,537,668 |
4,382,496,277 |
|
Value added tax
receivable |
111,049,680 |
64,832,096 |
- |
|
Other Current Assets
|
257,635,354 |
170,125,438 |
105,569,926 |
|
|
|
|
|
|
Total Current Assets
|
9,094,569,791 |
8,059,191,441 |
7,416,116,970 |
|
Investment in subsidiary |
536,049,023 |
14,839,230 |
14,839,230 |
|
Investment properties |
1,552,260,414 |
1,376,270,428 |
1,095,982,555 |
|
Property, plant and
equipment |
21,889,395,714 |
14,843,364,454 |
10,809,357,985 |
|
Computer software |
197,922,516 |
189,566,568 |
189,250,267 |
|
Leasehold rights |
1,462,399,898 |
1,180,659,436 |
1,059,396,440 |
|
Property foreclosed |
3,229,639 |
3,229,639 |
3,229,639 |
|
Rental guarantee deposits |
54,994,552 |
59,671,007 |
51,920,849 |
|
Deferred tax assets |
76,367,137 |
67,376,182 |
- |
|
Other non-current assets
|
3,023,380 |
2,541,366 |
2,833,938 |
|
Total Assets |
34,870,212,064 |
25,796,709,751 |
20,642,927,873 |
LIABILITIES &
SHAREHOLDERS’ EQUITY [BAHT]
|
Current
Liabilities |
2013 |
2012 [Restated] |
2011 |
|
|
|
|
|
|
Short-term loans from financial institutions |
1,360,000,000 |
- |
- |
|
Trade and other
payable |
10,064,221,123 |
8,054,841,860 |
7,261,162,764 |
|
Current portion of
liabilities under financial lease
agreements |
4,991,050 |
5,967,599 |
3,719,951 |
|
Short-term loan from
related party |
90,000,000 |
90,000,000 |
90,000,000 |
|
Current portion of
long-term loans |
500,000,000 |
300,000,000 |
- |
|
Current portion of
debentures |
- |
1,700,000,000 |
300,000,000 |
|
Accrued income tax |
326,597,490 |
362,382,491 |
438,008,219 |
|
Value added tax
payable |
- |
- |
41,122,577 |
|
Advances received from
customers |
702,053,114 |
721,318,326 |
768,900,638 |
|
Other current liabilities |
352,857,344 |
403,826,844 |
269,789,349 |
|
|
|
|
|
|
Total Current Liabilities |
13,400,720,121 |
11,638,337,120 |
9,172,703,498 |
|
Liabilities under financial
lease agreements, net
of current portion |
11,892,624 |
16,823,654 |
8,419,531 |
|
Long-term loans, net of current portion |
1,600,000,000 |
1,200,000,000 |
- |
|
Debentures, net of
current portion |
6,300,000,000 |
2,300,000,000 |
2,700,000,000 |
|
Provision for employee
benefit |
88,038,184 |
80,958,206 |
91,352,448 |
|
Rental received in
advance |
434,612,162 |
456,202,670 |
477,850,356 |
|
Other non-current liabilities |
301,722,859 |
212,072,482 |
87,084,304 |
|
Total Liabilities |
22,136,985,950 |
15,904,394,132 |
12,537,410,137 |
|
|
2013 |
2012 [Restated] |
2011 |
|
|
|
|
|
|
Shareholders' Equity |
|
|
|
|
|
|
|
|
|
Registered Share
capital 9,589,847,893 ordinary
shares of Baht 1
each [31 December 2012:
7,054,971,235 ordinary shares
of Baht 1
each] [31 December
2011 : 5,881,394,685 ordinary shares
of Baht 1
each |
9,589,847,896 |
7,054,971,235 |
5,881,394,685 |
|
|
|
|
|
|
Issued and
fully paid-up |
|
|
|
|
9,589,550,988 ordinary
shares of Baht 1
each [31 December 2012 : 7,041,430,018 ordinary shares
of Baht 1
each |
9,589,550,988 |
7,041,430,018 |
5,836,721,415 |
|
Share Premium |
646,323,076 |
646,066,296 |
636,329,511 |
|
Retained Earnings: Appropriated for
statutory reserve |
706,780,000 |
550,800,000 |
417,700,000 |
|
Unappropriated |
1,790,572,050 |
1,654,019,305 |
1,214,766,810 |
|
Total Shareholders' Equity |
12,733,226,114 |
9,892,315,619 |
8,105,517,736 |
|
Total Liabilities & Shareholders' Equity |
34,870,212,064 |
25,796,709,751 |
20,642,927,873 |
PROFIT &
LOSS ACCOUNT
|
Revenue |
2013 |
2012 [Restated] |
2011 |
|
|
|
|
|
|
Sales income |
39,933,592,781 |
34,542,733,391 |
28,364,672,553 |
|
Rental and service
income |
818,927,200 |
740,135,756 |
676,849,056 |
|
Other income |
1,768,910,716 |
1,560,608,200 |
1,377,906,725 |
|
Total Revenues |
42,521,430,697 |
36,843,477,347 |
30,419,428,334 |
|
Expenses |
|
|
|
|
|
|
|
|
|
Cost of sales |
29,231,935,933 |
25,559,391,314 |
21,073,977,405 |
|
Selling expenses |
7,908,539,846 |
6,693,149,084 |
5,289,569,134 |
|
Administrative expenses |
1,142,037,614 |
960,110,743 |
925,857,609 |
|
Other expenses |
49,805,655 |
24,715,382 |
78,773,855 |
|
Total Expenses |
38,332,319,048 |
33,237,366,523 |
27,368,178,003 |
|
|
|
|
|
|
Profit before Financial Cost & Income
Tax |
4,189,111,649 |
3,606,110,824 |
3,051,250,331 |
|
Financial Cost |
[278,503,818] |
[148,867,157] |
[119,743,814] |
|
Profit before Income
Tax |
3,910,607,831 |
3,457,243,667 |
2,931,506,517 |
|
Income Tax |
[790,677,518] |
[805,693,822] |
[914,692,318] |
|
|
|
|
|
|
Net Income for
The Year |
3,119,930,313 |
2,651,549,845 |
2,016,814,199 |
FINANCIAL ANALYSIS
|
ITEM |
UNIT |
2013 |
2012 |
2011 |
|
|
|
|
|
|
|
LIQUIDITY RATIO |
|
|
|
|
|
CURRENT RATIO |
TIMES |
0.68 |
0.69 |
0.81 |
|
QUICK RATIO |
TIMES |
0.21 |
0.21 |
0.32 |
|
|
|
|
|
|
|
ACTIVITY RATIO |
|
|
|
|
|
FIXED ASSETS TURNOVER |
TIMES |
1.82 |
2.33 |
2.62 |
|
TOTAL ASSETS TURNOVER |
TIMES |
1.15 |
1.34 |
1.37 |
|
INVENTORY CONVERSION PERIOD |
DAYS |
74.61 |
76.44 |
75.90 |
|
INVENTORY TURNOVER |
TIMES |
4.89 |
4.78 |
4.81 |
|
RECEIVABLES CONVERSION PERIOD |
DAYS |
12.88 |
13.14 |
12.80 |
|
RECEIVABLES TURNOVER |
TIMES |
28.34 |
27.77 |
28.52 |
|
PAYABLES CONVERSION PERIOD |
DAYS |
125.67 |
115.03 |
125.76 |
|
CASH CONVERSION CYCLE |
DAYS |
(38.17) |
(25.45) |
(37.06) |
|
|
|
|
|
|
|
PROFITABILITY RATIO |
|
|
|
|
|
COST OF GOODS SOLD |
% |
73.20 |
73.99 |
74.30 |
|
SELLING & ADMINISTRATION |
% |
22.66 |
22.16 |
21.91 |
|
INTEREST |
% |
0.70 |
0.43 |
0.42 |
|
GROSS PROFIT MARGIN |
% |
33.28 |
32.67 |
32.95 |
|
NET PROFIT MARGIN BEFORE EX. ITEM |
% |
10.49 |
10.44 |
10.76 |
|
NET PROFIT MARGIN |
% |
7.81 |
7.68 |
7.11 |
|
RETURN ON EQUITY |
% |
24.50 |
26.80 |
24.88 |
|
RETURN ON ASSET |
% |
8.95 |
10.28 |
9.77 |
|
EARNING PER SHARE |
BAHT |
0.33 |
0.38 |
0.35 |
|
|
|
|
|
|
|
LEVERAGE RATIO |
|
|
|
|
|
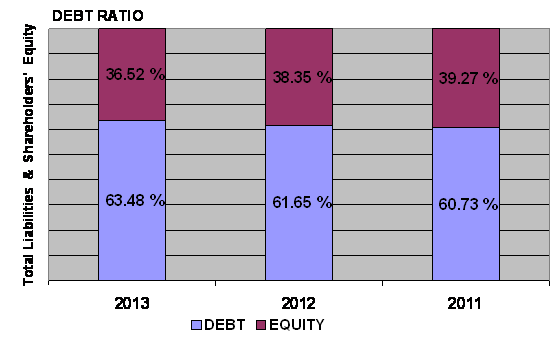
DEBT RATIO |
TIMES |
0.63 |
0.62 |
0.61 |
|
DEBT TO EQUITY RATIO |
TIMES |
1.74 |
1.61 |
1.55 |
|
TIME INTEREST EARNED |
TIMES |
15.04 |
24.22 |
25.48 |
|
|
|
|
|
|
|
ANNUAL GROWTH |
|
|
|
|
|
SALES GROWTH |
% |
15.61 |
21.78 |
|
|
OPERATING PROFIT |
% |
16.17 |
18.18 |
|
|
NET PROFIT |
% |
17.66 |
31.47 |
|
|
FIXED ASSETS |
% |
47.47 |
37.32 |
|
|
TOTAL ASSETS |
% |
35.17 |
24.97 |
|
ANNUAL GROWTH :
EXCELLENT
An annual sales growth is 15.61%. Turnover has increased from THB
34,542,733,391.00 in 2012 to THB 39,933,592,781.00 in 2013. While net profit
has increased from THB
PROFITABILITY:
EXCELLENT

PROFITABILITY
RATIO
|
Gross Profit Margin |
33.28 |
Impressive |
Industrial Average |
22.93 |
|
Net Profit Margin |
7.81 |
Impressive |
Industrial Average |
2.62 |
|
Return on Assets |
8.95 |
Impressive |
Industrial Average |
5.69 |
|
Return on Equity |
24.50 |
Impressive |
Industrial Average |
16.34 |
Gross Profit Margin used to assess a firm's financial health by
revealing the proportion of money left over from revenues after accounting for
the cost of goods sold. Gross profit margin serves as the source for paying
additional expenses and future savings. Gross Profit Margin is 33.28%. When compared with the industry
average, the ratio of the company was higher, indicated that company was more
profitable than the same industry.
Net Profit Margin is the indicator of the company's efficiency in that
net profit takes into consideration all expenses of the company. A low profit
margin indicates a low margin of safety, higher risk that a decline in sales
will erase profits and result in a net loss. Net Profit Margin ratio is 7.81%,
higher figure when compared with those of its average competitors in the same
industry, indicated that business was an efficient operator in a dominant position within its industry.
Return on Assets measures how efficiently profits are being generated
from the assets employed in the business when compared with the ratios of firms
in a similar business. A low ratio in comparison with industry averages
indicates an inefficient use of business assets. Return on Assets ratio is
8.95%, higher figure when compared with those of its average competitors in the
same industry, indicated that business was an efficient profit in a dominant position within its industry.
Return on Equity indicates how profitable a company is by comparing its
net income to its average shareholders' equity, ROE measures how much the
shareholders earned for their investment in the company. Return on Equity ratio
is 24.5%, higher figure when compared with those of its average competitors in
the same industry, indicated that business was an efficient profit in a dominant position within its industry.
Trend of the average competitors in the same industry for last 5 years
Return on Assets Uptrend
Return on Equity Uptrend
LIQUIDITY:
ACCEPTABLE

LIQUIDITY RATIO
|
Current Ratio |
0.68 |
Risky |
Industrial Average |
1.66 |
|
Quick Ratio |
0.21 |
|
|
|
|
Cash Conversion Cycle |
(38.17) |
|
|
|
The Current Ratio is to ascertain whether a company's short-term assets
are readily available to pay off its short-term liabilities. The company's figure
is 0.68 times in 2013, decrease from 0.69 times, then the company may not be
efficiently using its current assets. When compared with the industry average,
the ratio of the company was lower.
The Quick Ratio is a liquidity indicator that further refines the
current ratio by measuring the amount of the most liquid current assets there
are to cover current liabilities. The company's figure is 0.21 times in 2013,
same figure as
in 2012, then the company has not
enough current assets that presumably can be quickly converted to cash for pay
financial obligations.
The Cash Conversion Cycle measures the number of days a company's cash
is tied up in the production and sales process of its operations and the
benefit from payment terms from its creditors. It meant the company could
survive when no cash inflow was received from sale for -39 days.
Trend of the average competitors in the same industry for last 5 years
Current Ratio Uptrend
LEVERAGE:
IMPRESSIVE

LEVERAGE RATIO
|
Debt Ratio |
0.63 |
Impressive |
Industrial Average |
0.82 |
|
Debt to Equity Ratio |
1.74 |
Acceptable |
Industrial Average |
2.24 |
|
Times Interest Earned |
15.04 |
Impressive |
Industrial Average |
- |
Debt to Equity Ratio a measurement of how much suppliers, lenders, creditors
and obligors have committed to the company versus what the shareholders have
committed. A higher the percentage means that the company is using less equity
and has stronger leverage position.
Times Interest Earned measuring a company's ability to meet its debt
obligations. Ratio is 15.05 higher than 1, so the company can pay interest
expenses on outstanding debt.
Debt Ratio shows the proportion of a company's assets which are financed
through debt. The company's figure is 0.63 greater than 0.5, most of the
company's assets are financed through debt.
Trend of the average competitors in the same industry for last 5 years
Debt Ratio Uptrend
Times Interest Earned Stable
ACTIVITY:
SATISFACTORY

ACTIVITY RATIO
|
Fixed Assets Turnover |
1.82 |
Impressive |
Industrial Average |
- |
|
Total Assets Turnover |
1.15 |
Deteriorated |
Industrial Average |
2.83 |
|
Inventory Conversion Period |
74.61 |
|
|
|
|
Inventory Turnover |
4.89 |
Acceptable |
Industrial Average |
6.78 |
|
Receivables Conversion Period |
12.88 |
|
|
|
|
Receivables Turnover |
28.34 |
Impressive |
Industrial Average |
7.54 |
|
Payables Conversion Period |
125.67 |
|
|
|
The company's Account Receivable Ratio is calculated as 28.34 and
Inventory Turnover in Days Ratio indicates the liquidity of inventory.
It estimates the number of days that it will take to sell the current
inventory. Inventory is particularly sensitive to change in business
activities. The inventory turnover in days has decreased from 76 days at the
end of 2012 to 75 days at the end of 2013. This represents a positive trend.
And Inventory turnover has increased from 4.78 times in year 2012 to 4.89 times
in year 2013.
The company's Total Asset Turnover is calculated as 1.15 times and 1.34
times in 2013 and 2012 respectively. This ratio is determined by dividing total
assets into total sales turnover. The ratio measures the activity of the assets
and the ability of the firm to generate sales through the use of the assets.
Trend of the average competitors in the same industry for last 5 years
Fixed Assets Turnover Stable
Total Assets Turnover Uptrend
Inventory Turnover Uptrend
Receivables Turnover Uptrend
FOREIGN EXCHANGE RATES
|
Currency |
Unit
|
Indian Rupees |
|
US Dollar |
1 |
Rs.60.33 |
|
|
1 |
Rs.103.18 |
|
Euro |
1 |
Rs.81.58 |
INFORMATION DETAILS
|
Analysis Done by
: |
KAR |
|
|
|
|
Report Prepared
by : |
TPT |
RATING EXPLANATIONS
|
RATING |
STATUS |
PROPOSED CREDIT LINE |
|
|
>86 |
Aaa |
Possesses an extremely sound financial base with the strongest
capability for timely payment of interest and principal sums |
Unlimited |
|
71-85 |
Aa |
Possesses adequate working capital. No caution needed for credit
transaction. It has above average (strong) capability for payment of interest
and principal sums |
Large |
|
56-70 |
A |
Financial & operational base are regarded healthy. General
unfavourable factors will not cause fatal effect. Satisfactory capability for
payment of interest and principal sums |
Fairly Large |
|
41-55 |
Ba |
Overall
operation is considered normal. Capable to meet normal commitments. |
Satisfactory |
|
26-40 |
B |
Capability to overcome financial difficulties seems comparatively below
average. |
Small |
|
11-25 |
Ca |
Adverse factors are apparent. Repayment of interest and principal sums
in default or expected to be in default upon maturity |
Limited with
full security |
|
<10 |
C |
Absolute credit risk exists. Caution needed to be exercised |
Credit not
recommended |
|
-- |
NB |
New Business |
-- |
This score serves as a reference to assess SC’s credit risk and
to set the amount of credit to be extended. It is calculated from a composite
of weighted scores obtained from each of the major sections of this report. The
assessed factors and their relative weights (as indicated through %) are as
follows:
Financial
condition (40%) Ownership
background (20%) Payment
record (10%)
Credit history
(10%) Market trend
(10%) Operational
size (10%)
This report is issued at your request without any
risk and responsibility on the part of MIRA INFORM PRIVATE LIMITED (MIPL)
or its officials.