MIRA
INFORM REPORT
|
Report Date : |
22.07.2014 |
IDENTIFICATION DETAILS
|
Name : |
BANGCHAK BIOFUEL COMPANY LIMITED |
|
|
|
|
Registered Office : |
28 Moo 9, T. Bangkrasan, A. Bangpa-In, Pranakorn SRI Ayuthaya 13160, |
|
|
|
|
Country : |
|
|
|
|
|
Financials (as on) : |
31.12.2013 |
|
|
|
|
Date of Incorporation : |
12.03.2008 |
|
|
|
|
Com. Reg. No.: |
0105551029246 |
|
|
|
|
Legal Form : |
Private Limited Company |
|
|
|
|
Line of Business : |
Subject is engaged
in manufacturing and
distributing of bio-fuel
products, specialized in Bio-diesel [B100] and Glycerin. |
|
|
|
|
No. of Employees |
102 |
RATING & COMMENTS
|
MIRA’s Rating : |
A |
|
RATING |
STATUS |
PROPOSED CREDIT LINE |
|
|
56-70 |
A |
Financial & operational base are regarded healthy. General
unfavourable factors will not cause fatal effect. Satisfactory capability for
payment of interest and principal sums |
Fairly Large |
|
Status : |
Good |
|
Payment Behaviour : |
Regular |
|
Litigation : |
Clear |
NOTES :
Any query related to this report can be made
on e-mail : infodept@mirainform.com
while quoting report number, name and date.
ECGC Country Risk Classification List – March 31, 2014
|
Country Name |
Previous Rating (31.12.2013) |
Current Rating (31.03.2014) |
|
Thailand |
B1 |
B1 |
|
Risk Category |
ECGC
Classification |
|
Insignificant |
A1 |
|
Low Risk |
A2 |
|
Moderate Low Risk |
B1 |
|
Moderate Risk |
B2 |
|
Moderate High Risk |
C1 |
|
High Risk |
C2 |
|
Very High Risk |
D |
THAILAND ECONOMIC OVERVIEW
With a well-developed infrastructure, a free-enterprise economy, generally pro-investment policies, and strong export industries, Thailand achieved steady growth due largely to industrial and agriculture exports - mostly electronics, agricultural commodities, automobiles and parts, and processed foods. Unemployment, at less than 1% of the labor force, stands as one of the lowest levels in the world, which puts upward pressure on wages in some industries. Thailand also attracts nearly 2.5 million migrant workers from neighboring countries. The Thai government in 2013 implemented a nation-wide 300 baht ($10) per day minimum wage policy and deployed new tax reforms designed to lower rates on middle-income earners. The Thai economy has weathered internal and external economic shocks in recent years. The global economic recession severely cut Thailand's exports, with most sectors experiencing double-digit drops. In late 2011 Thailand's recovery was interrupted by historic flooding in the industrial areas in Bangkok and its five surrounding provinces, crippling the manufacturing sector. The government approved flood mitigation projects worth $11.7 billion, which were started in 2012, to prevent similar economic damage, and an additional $75 billion for infrastructure over the following seven years. This was expected to lead to an economic upsurge but growth has remained slow, in part due to ongoing political unrest and resulting uncertainties. Spending on infrastructure will require re-approval once a new government is seated
|
Source
: CIA |
Company name
BANGCHAK
BIOFUEL COMPANY LIMITED
SUMMARY
BUSINESS
ADDRESS : 28
MOO 9, T. BANGKRASAN, A. BANGPA-IN,
PRANAKORN SRI
AYUTHAYA 13160,
THAILAND
TELEPHONE : [66] 35
276-500
FAX :
[66] 35
276-549
E-MAIL
ADDRESS : bangchakbiofuel@gmail.com
REGISTRATION
ADDRESS : SAME
AS BUSINESS ADDRESS
ESTABLISHED
: 2008
REGISTRATION
NO. : 0105551029246
TAX
ID NO. : 3032992039
CAPITAL REGISTERED : BHT. 281,500,000
CAPITAL PAID-UP : BHT.
281,500,000
SHAREHOLDER’S PROPORTION : THAI
: 100%
FISCAL YEAR CLOSING DATE : DECEMBER 31
LEGAL
STATUS : PRIVATE LIMITED
COMPANY
EXECUTIVE : MR. BUNDIT SAPIANCHAI,
THAI
MANAGING DIRECTOR
NO.
OF STAFF : 102
LINES
OF BUSINESS : BIOFUEL PRODUCTS
MANUFACTURER AND
DISTRIBUTOR
CORPORATE PROFILE
OPERATING
TREND : STABLE
PRESENT
SITUATION : OPERATING NORMALLY
REPUTATION : GOOD
WITH NORMAL BUSINESS
ENGAGEMENT
MANAGEMENT
STANDARD : MANAGEMENT WITH
GOOD PERFORMANCE
HISTORY
The
subject was established
on March 12, 2008
as a private
limited company under
the registered name
BANGCHAK BIOFUEL COMPANY
LIMITED, by Thai group,
with the business
objective to manufacture
and distribute bio-fuel
products to domestic
market. It currently employs 102 staff.
The
subject is a
joint venture between
Bangchak Petroleum Public
Company Limited and
UAC Global Public Company Limited, Thailand.
The
subject’s registered address
is 28 Moo
9, T. Bangkrasan, A. Bangpa-in,
Pranakorn Sri Ayuthaya
13160, and this
is the subject’s
current operation address.
THE
BOARD OF DIRECTOR
|
Name |
|
Nationality |
Age |
|
|
|
|
|
|
Mr. Vichien Usanachote |
[x] |
Thai |
58 |
|
Mr. Wattana Opanonamata |
[x] |
Thai |
58 |
|
Mr. Kitti Chevakate |
|
Thai |
59 |
|
Mr. Surachai Kositsereewong |
[x] |
Thai |
52 |
|
Mr. Chatchapol Prasopchoke |
|
Thai |
54 |
|
Mr. Bundit Sapianchai |
[x] |
Thai |
50 |
AUTHORIZED PERSON
Any two of
the above mentioned
directors [x] can jointly
sign or anyone
of the directors
[x] can jointly
sign with anyone
of the rest
directors on behalf
of the subject
with company’s affixed.
MANAGEMENT
Mr. Bundit Sapianchai is
the Managing Director.
He is Thai nationality with
the age of 50
years old.
Mr. Bundit Hansapaiboon is
the Deputy Managing Director & Production Manager.
He is Thai nationality.
Mr. Prasit Tantavoranart is
the Sales & Marketing
Manager.
He is Thai nationality.
Ms. Suwanna Chuanchai is
the Financial &
Accounting Manager.
She is Thai nationality.
BUSINESS OPERATIONS
The subject
is engaged in
manufacturing and distributing
of bio-fuel products,
specialized in Bio-diesel [B100]
and Glycerin [Purity 80%].
PRODUCTION CAPACITY
Bio-diesel
[B100] : 100,000
tons/annum
Glycerin [Purity
80%] : 10,000
tons/annum
TRADE NAME
“BANGCHAK BIOFUEL”
PURCHASE
Raw materials mainly
chemical and palm
oil are purchased
from suppliers both
domestic and overseas,
in Malaysia, Singapore
and Germany.
MAJOR
SUPPLIER
Bangchak
Petroleum Public Company
Limited : Thailand
SALES [LOCAL]
80% of the products is sold
locally by wholesale to
Bangchak Petroleum Public
Company Limited, the
remaining 20% is
supplied to general
industrial plants.
SUBSIDIARY AND AFFILIATED
COMPANY
The subject is
not found to
have any subsidiary
or affiliated company
here in Thailand.
LITIGATION
Bankruptcy and Receivership
There are no
litigation on bankruptcy
and receivership cases
filed against the
subject found at
Legal Execution Department
for the past
five years.
Others
There are no
legal suits filed
against the subject
for the past
two years.
CREDIT
Sales are by
cash or on
the credits term
of 30-60 days.
Local bills are
paid by cash
or on the
credits term of
30-60 days.
Imports are by
T/T.
BANKING
Bangkok
Bank Public Co.,
Ltd.
Kasikornbank
Public Co., Ltd.
EMPLOYMENT
The
subject currently employs 102
office staff and
factory workers.
LOCATION
DETAILS
The
premise is owned for
administrative office, factory
and warehouse on
81,000
square
meters of land
at the heading
address. Premise is
located in provincial.
COMMENT
The
subject was
founded in 2008 to process
and deliver of environmentally-friendly
on all levels renewable
bio-fuel products. As such,
the plant has been designed
to keep energy consumptions to
a minimum, and
also recycles water and
convert by-products from biodiesel process
to be used again.
As
part of the quality control (Quality Assurance), the subject provided a quality
control system throughout the
cycle from the raw
material stage, monitor
the reaction and final process
that ensure delivering
a standard quality
products to the
customer.
FINANCIAl INFORMATION
The
capital was registered
at Bht. 281,500,000 divided
into 2,815,000 shares of
Bht. 100 each
with fully paid.
THE
SHAREHOLDERS LISTED WERE
: [as at
April 23, 2014]
|
NAME |
HOLDING |
% |
|
|
|
|
|
Bangchak Petroleum Public
Company Limited Nationality: Thai Address : 555/1
Vibhavadi Rangsit Road,
Chatuchak,
Bangkok |
1,970,495 |
70.00 |
|
UAC Global Public
Company Limited Nationality: Thai Address : 1 TP
& T Building, Vibhavadi
Rangsit Road, Chatuchak,
Bangkok |
844,498 |
30.00 |
|
Mr. Kitti Chevakate Nationality: Thai Address : 189
Prachuen Road, Bangsue, Bangkok |
1 |
- |
|
Mr. Chatchapol Prasopchoke Nationality: Thai Address : 1031
Chransanitwong Road, Thaphra,
Bangkokyai, Bangkok |
1 |
- |
|
Mr. Kanes Wisarutpong Nationality: Thai Address :
1294-1296 Songwad Road,
Samphantawong, Bangkok |
1 |
- |
|
Mr. Chokechai Asawarangsarit Nationality: Thai Address : 9/117 Soi
Ramindra 40, Buengkum,
Bangkok |
1 |
- |
|
Mrs. Saowapap Sumeksri Nationality: Thai Address : 82/242 Moo 12, Minburi,
Bangkok |
1 |
- |
|
Mr. Chaiyapong Yaowapak Nationality: Thai Address : 17/257
Pattanakarn 54 Road,
Suanluang, Bangkok |
1 |
- |
|
Ms. Pakavadee Chanyaphet Nationality: Thai Address : 91/442-443
Moo 11, Ramindra
Road,
Klongkum, Buengkum, Bangkok |
1 |
- |
Total Shareholders : 9
Share Structure [as
at April 23,
2014]
|
Nationality |
Shareholders |
No. of Share |
% Shares |
|
|
|
|
|
|
Thai |
9 |
2,815,000 |
100.00 |
|
Foreign |
- |
- |
- |
|
Total |
9 |
2,815,000 |
100.00 |
NAME OF AUDITOR
& CERTIFIED PUBLIC
ACCOUNTANT NO. :
Mr. Wairoj Chindamaneepitak
No. 3565
BALANCE SHEET [BAHT]
The
latest financial figures
published for December 31,
2013, 2012 &
2011 were:
ASSETS
|
Current Assets |
2013 |
2012 |
2011 |
|
|
|
|
|
|
Cash and Cash Equivalents |
130,790,032 |
159,692,369 |
96,402,558 |
|
Trade Accounts Receivable |
318,016,944 |
151,771,457 |
168,902,866 |
|
Other Receivable |
3,379,152 |
5,951,588 |
2,972,447 |
|
Inventories |
273,444,572 |
247,551,665 |
206,756,028 |
|
Other Current Assets
|
220,035 |
260,104 |
40,068 |
|
|
|
|
|
|
Total Current Assets
|
725,850,735 |
565,227,183 |
475,073,967 |
|
|
|
|
|
|
Fixed Assets |
768,812,694 |
806,879,260 |
801,961,459 |
|
Intangible Assets |
1,615,297 |
103,854 |
102,340 |
|
Deferred Income Tax Assets |
179,425 |
116,578 |
- |
|
Other Non-current Assets |
2,355,140 |
3,415,809 |
4,476,477 |
|
Total Assets |
1,498,813,291 |
1,375,742,684 |
1,281,614,243 |
LIABILITIES &
SHAREHOLDERS' EQUITY [BAHT]
|
Current
Liabilities |
2013 |
2012 |
2011 |
|
|
|
|
|
|
Trade Accounts Payable |
301,478,977 |
295,566,299 |
191,251,539 |
|
Other Payable |
16,728,086 |
14,586,758 |
18,472,549 |
|
Current Portion of Long-term
Loans from Financial Institutions |
133,864,547 |
119,694,796 |
101,363,070 |
|
Current Portion of
Financial Lease Contract Liabilities |
431,608 |
541,300 |
541,300 |
|
Accrued Income Tax |
3,091,148 |
- |
- |
|
Other Current Liabilities |
7,005,987 |
6,893,616 |
10,232,519 |
|
|
|
|
|
|
Total Current Liabilities |
462,600,353 |
437,282,769 |
321,860,977 |
|
|
|
|
|
|
Long-term Loans from Financial Institutions |
202,372,529 |
336,237,076 |
458,166,740 |
|
Financial Lease Contract Liabilities |
597,425 |
1,152,180 |
1,734,823 |
|
Obligation for Employee
Benefits |
758,463 |
547,239 |
353,927 |
|
Total Liabilities |
666,328,770 |
775,219,264 |
782,116,467 |
|
|
|
|
|
|
Shareholders' Equity |
|
|
|
|
|
|
|
|
|
Share capital : Baht 100
par value authorized, issued
and fully paid share
capital 2,815,000 shares |
281,500,000 |
281,500,000 |
281,500,000 |
|
|
|
|
|
|
Capital Paid |
281,500,000 |
281,500,000 |
281,500,000 |
|
Premium on Share Capital |
26,601,750 |
26,601,750 |
26,601,750 |
|
Retained Earning Appropriated for Statutory
Reserve |
17,671,793 |
12,620,511 |
12,620,511 |
|
Unappropriated |
506,710,978 |
279,801,159 |
178,775,515 |
|
Total Shareholders' Equity |
832,484,521 |
600,523,420 |
499,497,776 |
|
Total Liabilities &
Shareholders' Equity |
1,498,813,291 |
1,375,742,684 |
1,281,614,243 |
PROFIT &
LOSS ACCOUNT
|
Revenue |
2013 |
2012 |
2011 |
|
|
|
|
|
|
Sales Income |
4,400,888,273 |
4,442,783,821 |
2,500,307,541 |
|
Investment Income |
628,324 |
640,776 |
832,212 |
|
Other Income |
14,855,218 |
1,233,057 |
228,339 |
|
Total Revenues |
4,416,371,815 |
4,444,657,654 |
2,501,368,092 |
|
Expenses |
|
|
|
|
|
|
|
|
|
Cost of Goods
Sold |
4,092,796,192 |
4,282,558,901 |
2,362,979,678 |
|
Selling Expenses |
4,496,051 |
3,905,411 |
2,323,615 |
|
Administrative Expenses |
32,568,258 |
25,882,306 |
26,330,534 |
|
Total Expenses |
4,129,860,501 |
4,312,346,618 |
2,391,633,827 |
|
Profit before Financial
Cost & Income Tax |
286,511,314 |
132,311,036 |
109,734,265 |
|
Financial Cost |
[21,778,386] |
[29,922,863] |
[35,507,610] |
|
Profit before Income Tax |
264,732,928 |
102,388,173 |
74,226,655 |
|
Income Tax |
[4,621,827] |
[1,362,529] |
[1,897] |
|
Net Profit / [Loss] |
260,111,101 |
101,025,644 |
74,224,758 |
FINANCIAL ANALYSIS
|
ITEM |
UNIT |
2013 |
2012 |
2011 |
|
|
|
|
|
|
|
LIQUIDITY RATIO |
|
|
|
|
|
CURRENT RATIO |
TIMES |
1.57 |
1.29 |
1.48 |
|
QUICK RATIO |
TIMES |
0.98 |
0.73 |
0.83 |
|
|
|
|
|
|
|
ACTIVITY RATIO |
|
|
|
|
|
FIXED ASSETS TURNOVER |
TIMES |
5.72 |
5.51 |
3.12 |
|
TOTAL ASSETS TURNOVER |
TIMES |
2.94 |
3.23 |
1.95 |
|
INVENTORY CONVERSION PERIOD |
DAYS |
24.39 |
21.10 |
31.94 |
|
INVENTORY TURNOVER |
TIMES |
14.97 |
17.30 |
11.43 |
|
RECEIVABLES CONVERSION PERIOD |
DAYS |
26.38 |
12.47 |
24.66 |
|
RECEIVABLES TURNOVER |
TIMES |
13.84 |
29.27 |
14.80 |
|
PAYABLES CONVERSION PERIOD |
DAYS |
26.89 |
25.19 |
29.54 |
|
CASH CONVERSION CYCLE |
DAYS |
23.88 |
8.38 |
27.05 |
|
|
|
|
|
|
|
PROFITABILITY
RATIO |
|
|
|
|
|
COST OF GOODS SOLD |
% |
93.00 |
96.39 |
94.51 |
|
SELLING & ADMINISTRATION |
% |
0.84 |
0.67 |
1.15 |
|
INTEREST |
% |
0.49 |
0.67 |
1.42 |
|
GROSS PROFIT MARGIN |
% |
7.35 |
3.65 |
5.53 |
|
NET PROFIT MARGIN BEFORE EX. ITEM |
% |
6.51 |
2.98 |
4.39 |
|
NET PROFIT MARGIN |
% |
5.91 |
2.27 |
2.97 |
|
RETURN ON EQUITY |
% |
31.25 |
16.82 |
14.86 |
|
RETURN ON ASSET |
% |
17.35 |
7.34 |
5.79 |
|
EARNING PER SHARE |
BAHT |
92.40 |
35.89 |
26.37 |
|
|
|
|
|
|
|
LEVERAGE RATIO |
|
|
|
|
|
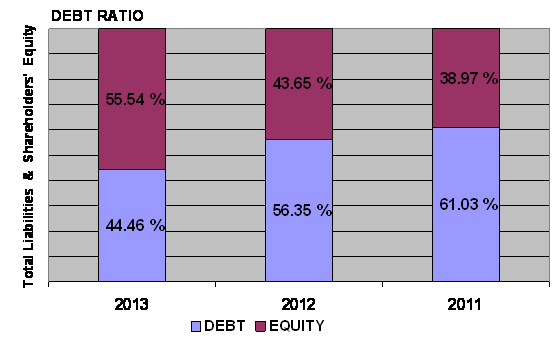
DEBT RATIO |
TIMES |
0.44 |
0.56 |
0.61 |
|
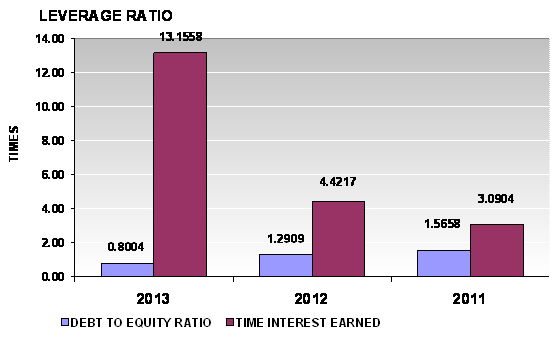
DEBT TO EQUITY RATIO |
TIMES |
0.80 |
1.29 |
1.57 |
|
TIME INTEREST EARNED |
TIMES |
13.16 |
4.42 |
3.09 |
|
|
|
|
|
|
|
ANNUAL GROWTH |
|
|
|
|
|
SALES GROWTH |
% |
(0.94) |
77.69 |
|
|
OPERATING PROFIT |
% |
116.54 |
20.57 |
|
|
NET PROFIT |
% |
157.47 |
36.11 |
|
|
FIXED ASSETS |
% |
(4.72) |
0.61 |
|
|
TOTAL ASSETS |
% |
8.95 |
7.34 |
|
ANNUAL GROWTH :
SATISFACTORY
An annual sales growth is -0.94%. Turnover has decreased from THB 4,442,783,821.00
in 2012 to THB 4,400,888,273.00 in 2013. While net profit has increased from
THB 101,025,644.00 in 2012 to THB 260,111,101.00 in 2013. And total assets has
increased from THB 1,375,742,684.00 in 2012 to THB 1,498,813,291.00 in 2013.
PROFITABILITY :
EXCELLENT

PROFITABILITY
RATIO
|
Gross Profit Margin |
7.35 |
Impressive |
Industrial
Average |
1.04 |
|
Net Profit Margin |
5.91 |
Impressive |
Industrial
Average |
1.09 |
|
Return on Assets |
17.35 |
Impressive |
Industrial
Average |
1.55 |
|
Return on Equity |
31.25 |
Impressive |
Industrial
Average |
2.03 |
Gross Profit Margin used to assess a firm's financial health by
revealing the proportion of money left over from revenues after accounting for the
cost of goods sold. Gross profit margin serves as the source for paying
additional expenses and future savings. The
company’s figure is 7.35%. When
compared with the industry average, the ratio of the company was higher,
indicated that company was more profitable than the same industry.
Net Profit Margin is the indicator of the company's efficiency in that
net profit takes into consideration all expenses of the company. A low profit margin
indicates a low margin of safety, higher risk that a decline in sales will
erase profits and result in a net loss. The
company’s figure is 5.91%, higher figure
when compared with those of its
average competitors in the same industry, indicated that business was an
efficient operator in a dominant
position within its industry.
Return on Assets measures how efficiently profits are being generated
from the assets employed in the business when compared with the ratios of firms
in a similar business. A low ratio in comparison with industry averages
indicates an inefficient use of business assets. Return on Assets ratio is
17.35%, higher figure when compared with those of its average competitors in
the same industry, indicated that business was an efficient profit in a dominant position within its industry.
Return on Equity indicates how profitable a company is by comparing its
net income to its average shareholders' equity, ROE measures how much the
shareholders earned for their investment in the company. Return on Equity ratio
is 31.25%, higher figure when compared with those of its average competitors in
the same industry, indicated that business was an efficient profit in a dominant position within its industry.
Trend of the
average competitors in the same industry for last 5 years
Return on Assets Uptrend
Return on Equity Downtrend
LIQUIDITY :
ACCEPTABLE

LIQUIDITY RATIO
|
Current Ratio |
1.57 |
Acceptable |
Industrial
Average |
2.58 |
|
Quick Ratio |
0.98 |
|
|
|
|
Cash Conversion Cycle |
23.88 |
|
|
|
The Current Ratio is to ascertain whether a company's short-term assets
are readily available to pay off its short-term liabilities. The company's figure
is 1.57 times in 2013, increased from 1.29 times, then it is generally
considered to have good short-term financial strength. When compared with the
industry average, the ratio of the company was lower.
The Quick Ratio is a liquidity indicator that further refines the
current ratio by measuring the amount of the most liquid current assets there
are to cover current liabilities. The company's figure is 0.98 times in 2013,
increased from 0.73 times, by excluding inventory, the company may have problems
meeting current liabilities.
The Cash Conversion Cycle measures the number of days a company's cash
is tied up in the production and sales process of its operations and the
benefit from payment terms from its creditors. It meant the company could
survive when no cash inflow was received from sale for 24 days.
Trend of the
average competitors in the same industry for last 5 years
Current Ratio Uptrend
LEVERAGE :
IMPRESSIVE
LEVERAGE RATIO
|
Debt Ratio |
0.44 |
Acceptable |
Industrial
Average |
0.18 |
|
Debt to Equity Ratio |
0.80 |
Impressive |
Industrial
Average |
0.22 |
|
Times Interest Earned |
13.16 |
Impressive |
Industrial
Average |
- |
Debt to Equity Ratio a measurement of how much suppliers, lenders, creditors
and obligors have committed to the company versus what the shareholders have
committed. A lower the percentage means that the company is using less leverage
and has a stronger equity position.
Times Interest Earned measuring a company's ability to meet its debt
obligations. Ratio is 13.16 higher than 1, so the company can pay interest
expenses on outstanding debt.
Debt Ratio shows the proportion of a company's assets which are financed
through debt. The company's figure is 0.44 less than 0.5, most of the company's
assets are financed through equity.
Trend of the
average competitors in the same industry for last 5 years
Debt Ratio Downtrend
Times Interest Earned Stable
ACTIVITY : EXCELLENT
ACTIVITY RATIO
|
Fixed Assets Turnover |
5.72 |
Impressive |
Industrial
Average |
- |
|
Total Assets Turnover |
2.94 |
Impressive |
Industrial
Average |
1.43 |
|
Inventory Conversion Period |
24.39 |
|
|
|
|
Inventory Turnover |
14.97 |
Impressive |
Industrial
Average |
6.86 |
|
Receivables Conversion Period |
26.38 |
|
|
|
|
Receivables Turnover |
13.84 |
Impressive |
Industrial
Average |
10.90 |
|
Payables Conversion Period |
26.89 |
|
|
|
The company's Account Receivable Ratio is calculated as 13.84 and 29.27
in 2013 and 2012 respectively. This ratio measures the efficiency of the
company in managing its trade debtors to generate revenue. A lower ratio may
indicate over extension and collection problems. Conversely, a higher ratio may
indicate an overtly stringent policy. In this case, the company's A/R ratio in
2013 decreased from 2012. This would suggest the company had deteriorated in
the management of its debt collections.
Inventory Turnover in Days Ratio indicates the liquidity of inventory.
It estimates the number of days that it will take to sell the current
inventory. Inventory is particularly sensitive to change in business
activities. The inventory turnover in days has increased from 21 days at the
end of 2012 to 24 days at the end of 2013. This represents a negative trend.
And Inventory turnover has decreased from 17.3 times in year 2012 to 14.97
times in year 2013.
The company's Total Asset Turnover is calculated as 2.94 times and 3.23
times in 2013 and 2012 respectively. This ratio is determined by dividing total
assets into total sales turnover. The ratio measures the activity of the assets
and the ability of the firm to generate sales through the use of the assets.
Trend of the
average competitors in the same industry for last 5 years
Fixed Assets Turnover Stable
Total Assets Turnover Uptrend
Inventory Turnover Uptrend
Receivables Turnover Uptrend
FOREIGN EXCHANGE RATES
|
Currency |
Unit
|
Indian Rupees |
|
US Dollar |
1 |
Rs.60.19 |
|
|
1 |
Rs.102.87 |
|
Euro |
1 |
Rs.81.48 |
INFORMATION DETAILS
|
Analysis Done by
: |
SUM |
|
|
|
|
Report Prepared
by : |
NIS |
RATING EXPLANATIONS
|
RATING |
STATUS |
PROPOSED CREDIT LINE |
|
|
|
>86 |
Aaa |
Possesses an extremely sound financial base with the strongest
capability for timely payment of interest and principal sums |
Unlimited |
|
|
71-85 |
Aa |
Possesses adequate working capital. No caution needed for credit
transaction. It has above average (strong) capability for payment of interest
and principal sums |
Large |
|
|
56-70 |
A |
Financial &
operational base are regarded healthy. General unfavourable factors will not
cause fatal effect. Satisfactory capability for payment of interest and principal
sums |
Fairly Large |
|
|
41-55 |
Ba |
Overall operation is considered normal. Capable to meet normal
commitments. |
Satisfactory |
|
|
26-40 |
B |
Capability to overcome financial difficulties seems comparatively
below average. |
Small |
|
|
11-25 |
Ca |
Adverse factors are apparent. Repayment of interest and principal sums
in default or expected to be in default upon maturity |
Limited with
full security |
|
|
<10 |
C |
Absolute credit risk exists. Caution needed to be exercised |
Credit not
recommended |
|
|
-- |
NB |
New Business |
-- |
|
This score serves as a reference to assess SC’s credit risk
and to set the amount of credit to be extended. It is calculated from a composite
of weighted scores obtained from each of the major sections of this report. The
assessed factors and their relative weights (as indicated through %) are as
follows:
Financial
condition (40%) Ownership
background (20%) Payment
record (10%)
Credit history
(10%) Market trend
(10%) Operational
size (10%)
This report is issued at your request without any
risk and responsibility on the part of MIRA INFORM PRIVATE LIMITED (MIPL)
or its officials.