MIRA
INFORM REPORT
|
Report Date : |
26.07.2014 |
IDENTIFICATION DETAILS
|
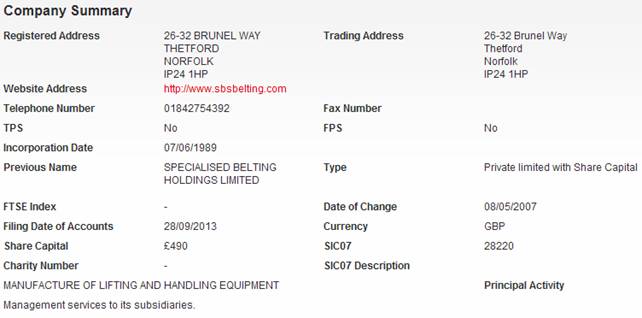
Name : |
Specilised Belting Supplies LIMITED |
|
|
|
|
Formerly Known As : |
SPECIALISED BELTING HOLDINGS LIMITED |
|
|
|
|
Registered Office : |
|
|
|
|
|
Country : |
|
|
|
|
|
Financials (as on) : |
31.12.2012 |
|
|
|
|
Date of Incorporation : |
07.06.1989 |
|
|
|
|
Com. Reg. No.: |
02393041 |
|
|
|
|
Legal Form : |
Private limited with share capital |
|
|
|
|
Line of Business : |
Manufacturer of lifting and handling equipment |
|
|
|
|
No. of Employees |
52 |
RATING & COMMENTS
|
MIRA’s Rating : |
B |
|
RATING |
STATUS |
PROPOSED CREDIT LINE |
|
|
26-40 |
B |
Capability to overcome financial difficulties seems comparatively
below average. |
Small |
|
Status : |
Moderate |
|
Payment Behaviour : |
Slow but correct |
|
Litigation : |
Clear |
NOTES :
Any query related to this report can be made
on e-mail : infodept@mirainform.com
while quoting report number, name and date.
ECGC Country Risk Classification List – March 31, 2014
|
Country Name |
Previous Rating (31.12.2013) |
Current Rating (31.03.2014) |
|
|
A1 |
A1 |
|
Risk Category |
ECGC
Classification |
|
Insignificant |
A1 |
|
Low Risk |
A2 |
|
Moderate Low Risk |
B1 |
|
Moderate Risk |
B2 |
|
Moderate High Risk |
C1 |
|
High Risk |
C2 |
|
Very High Risk |
D |
The
|
Source
: CIA |
Company name and address
Company Name Specilised Belting Supplies LIMITED
Company Number 02393041
DIRECTORS/MANAGEMENT
Current Directors
|
Name |
Date of Birth |
13/01/1969 |
|
|
Officers Title |
Mr |
Nationality |
German |
|
Present Appointments |
1 |
Function |
Director |
|
Appointment Date |
01/06/2012 |
|
|
|
Address |
Clausthalstr.2, |
||
|
Other Actions |
|
||
Previous Director/Company
Secretaries
|
Name |
Current Directorships |
Previous Directorships |
|
4 |
2 |
|
|
4 |
2 |
|
|
1 |
3 |
|
|
5 |
4 |
|
|
1 |
1 |
|
|
3 |
3 |
|
|
3 |
2 |
|
|
0 |
3 |
NEGATIVE INFORMATION
CCJ
|
Total Number of Exact CCJs - |
Total Value of Exact CCJs - |
||
|
Total Number of Possible CCJs - |
Total Value of Possible CCJs - |
||
|
Total Number of Satisfied CCJs - |
Total Value of Satisfied CCJs - |
||
|
Total Number of Writs - |
- |
|
|
Exact CCJ Details
|
No CCJs found |
Possible CCJs Details
|
There are no possible CCJ details |
Writ Details
|
No writs found |
SHARE & SHARE CAPITAL
INFORMATION
Top 20 Shareholders
|
Name |
Currency |
Share Count |
Share Type |
Nominal Value |
% of Total Share Count |
|
CONTITECH |
GBP |
490 |
ORDINARY |
1 |
100 |
PAYMENT INFORMATION
Payment Trend
Improving
GROUP STRUCTURE & AFFILIATED COMPANIES
Statistics
|
Group |
2 companies |
|
Linkages |
|
|
Countries |
Summary
|
Holding Company |
- |
|
Ownership Status |
Wholly Owned |
|
Ultimate Holding Company |
CONTITECH |
Group structure
|
Company Name |
|
Registered Number |
Latest Key Financials |
Consol. Accounts |
Turnover |
|
|
|
N/A |
- |
- |
|
|
|
02393041 |
31.12.2012 |
N |
£5,991,685 |
FINANCIAL INFORMATION
Trade Debtors / Bad Debt Summary
Total Number of Documented Trade
1
Total Value of Documented Trade
£12,826
Profit & Loss
|
Date Of Accounts |
31/12/12 |
(%) |
31/12/11 |
(%) |
31/12/10 |
(%) |
31/12/09 |
(%) |
31/12/08 |
|
Weeks |
52 |
(%) |
52 |
(%) |
52 |
(%) |
52 |
(%) |
52 |
|
Currency |
GBP |
(%) |
GBP |
(%) |
GBP |
(%) |
GBP |
(%) |
GBP |
|
Consolidated A/cs |
N |
(%) |
N |
(%) |
N |
(%) |
N |
(%) |
N |
|
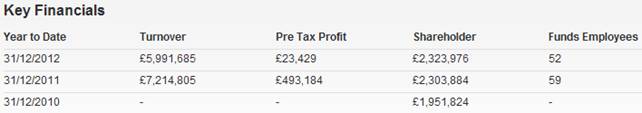
Turnover |
£5,991,685 |
-17% |
£7,214,805 |
- |
- |
- |
- |
- |
- |
|
Export |
- |
- |
- |
- |
- |
- |
- |
- |
- |
|
Cost of Sales |
- |
- |
- |
- |
- |
- |
- |
- |
- |
|
Gross Profit |
- |
- |
- |
- |
- |
- |
- |
- |
- |
|
Wages & Salaries |
£1,540,520 |
-6.4% |
£1,646,474 |
- |
- |
- |
- |
- |
- |
|
Directors Emoluments |
£90,190 |
-54.9% |
£199,947 |
- |
- |
- |
- |
- |
- |
|
Operating Profit |
£50,123 |
-90.4% |
£520,818 |
- |
- |
- |
- |
- |
- |
|
Depreciation |
£174,748 |
-4.4% |
£182,731 |
32.2% |
£138,196 |
-9.1% |
£152,085 |
0.9% |
£150,741 |
|
Audit Fees |
£9,000 |
28.6% |
£7,000 |
- |
- |
- |
- |
- |
- |
|
Interest Payments |
£26,694 |
-3.4% |
£27,634 |
- |
- |
- |
- |
- |
- |
|
Pre Tax Profit |
£23,429 |
-95.2% |
£493,184 |
- |
- |
- |
- |
- |
- |
|
Taxation |
-£3,337 |
97.6% |
-£141,124 |
- |
- |
- |
- |
- |
- |
|
Profit After Tax |
£20,092 |
-94.3% |
£352,060 |
- |
- |
- |
- |
- |
- |
|
Dividends Payable |
- |
- |
- |
- |
- |
- |
- |
- |
- |
|
Retained Profit |
£20,092 |
-94.3% |
£352,060 |
- |
- |
- |
- |
- |
- |
Balance Sheet
|
Date Of Accounts |
31/12/12 |
(%) |
31/12/11 |
(%) |
31/12/10 |
(%) |
31/12/09 |
(%) |
31/12/08 |
|
Tangible Assets |
£2,277,000 |
-2.6% |
£2,337,507 |
5.4% |
£2,217,703 |
0.2% |
£2,212,692 |
-2.5% |
£2,269,410 |
|
Intangible Assets |
0 |
- |
0 |
- |
0 |
- |
0 |
- |
0 |
|
Total Fixed Assets |
£2,277,000 |
-2.6% |
£2,337,507 |
5.4% |
£2,217,703 |
0.2% |
£2,212,692 |
-2.5% |
£2,269,410 |
|
Stock |
£839,929 |
-40.5% |
£1,410,957 |
46.7% |
£961,990 |
39% |
£691,925 |
-2.8% |
£711,698 |
|
Trade Debtors |
£1,166,764 |
-21.3% |
£1,482,099 |
-1.3% |
£1,502,246 |
35.5% |
£1,108,993 |
-32.8% |
£1,649,505 |
|
Cash |
£323,048 |
-33.8% |
£488,040 |
350.7% |
£108,295 |
-69.1% |
£350,253 |
118.9% |
£160,010 |
|
Other Debtors |
£224,652 |
18.5% |
£189,626 |
- |
0 |
- |
0 |
- |
0 |
|
Miscellaneous Current Assets |
0 |
- |
0 |
- |
0 |
- |
0 |
- |
0 |
|
Total Current Assets |
£2,554,393 |
-28.5% |
£3,570,722 |
38.8% |
£2,572,531 |
19.6% |
£2,151,171 |
-14.7% |
£2,521,213 |
|
Trade Creditors |
£373,630 |
-77.4% |
£1,651,851 |
17.9% |
£1,401,320 |
20.1% |
£1,166,872 |
12.5% |
£1,036,870 |
|
Bank Loans & Overdrafts |
£275,426 |
59.8% |
£172,330 |
14.8% |
£150,107 |
108.5% |
£71,980 |
-86.5% |
£532,143 |
|
Other Short Term Finance |
£449,171 |
999.9% |
£15,899 |
66.9% |
£9,526 |
-33.1% |
£14,234 |
239% |
£4,199 |
|
Miscellaneous Current Liabilities |
£194,578 |
-47% |
£366,981 |
- |
0 |
- |
0 |
- |
0 |
|
Total Current Liabilities |
£1,292,805 |
-41.4% |
£2,207,061 |
41.4% |
£1,560,953 |
24.6% |
£1,253,086 |
-20.3% |
£1,573,212 |
|
Bank Loans & Overdrafts and LTL |
£1,490,038 |
-5.1% |
£1,569,614 |
10% |
£1,427,564 |
0.9% |
£1,414,945 |
-31% |
£2,051,780 |
|
Other Long Term Finance |
£20,577 |
-38.2% |
£33,309 |
5.8% |
£31,474 |
- |
0 |
-100% |
£14,234 |
|
Total Long Term Liabilities |
£1,214,612 |
-13.1% |
£1,397,284 |
9.4% |
£1,277,457 |
-4.9% |
£1,342,965 |
-11.6% |
£1,519,637 |
Capital & Reserves
|
Date Of Accounts |
31/12/12 |
(%) |
31/12/11 |
(%) |
31/12/10 |
(%) |
31/12/09 |
(%) |
31/12/08 |
|
Called Up Share Capital |
£490 |
- |
£490 |
- |
£490 |
- |
£490 |
- |
£490 |
|
P & L Account Reserve |
£2,323,486 |
0.9% |
£2,303,394 |
18% |
£1,951,334 |
10.4% |
£1,767,322 |
4.1% |
£1,697,284 |
|
Revaluation Reserve |
- |
- |
- |
- |
- |
- |
- |
- |
- |
|
Sundry Reserves |
- |
- |
- |
- |
- |
- |
- |
- |
- |
|
Shareholder Funds |
£2,323,976 |
0.9% |
£2,303,884 |
18% |
£1,951,824 |
10.4% |
£1,767,812 |
4.1% |
£1,697,774 |
Other Financial Items
|
Date Of Accounts |
31/12/12 |
(%) |
31/12/11 |
(%) |
31/12/10 |
(%) |
31/12/09 |
(%) |
31/12/08 |
|
Net Worth |
£2,323,976 |
0.9% |
£2,303,884 |
18% |
£1,951,824 |
10.4% |
£1,767,812 |
4.1% |
£1,697,774 |
|
Working Capital |
£1,261,588 |
-7.5% |
£1,363,661 |
34.8% |
£1,011,578 |
12.6% |
£898,085 |
-5.3% |
£948,001 |
|
Total Assets |
£4,831,393 |
-18.2% |
£5,908,229 |
23.3% |
£4,790,234 |
9.8% |
£4,363,863 |
-8.9% |
£4,790,623 |
|
Total Liabilities |
£2,507,417 |
-30.4% |
£3,604,345 |
27% |
£2,838,410 |
9.3% |
£2,596,051 |
-16.1% |
£3,092,849 |
|
Net Assets |
£2,323,976 |
0.9% |
£2,303,884 |
18% |
£1,951,824 |
10.4% |
£1,767,812 |
4.1% |
£1,697,774 |
Miscellaneous
|
Date Of Accounts |
31/12/12 |
(%) |
31/12/11 |
(%) |
31/12/10 |
(%) |
31/12/09 |
(%) |
31/12/08 |
|
Contingent Liability |
NO |
- |
NO |
- |
NO |
- |
NO |
- |
NO |
|
Capital Employed |
£3,538,588 |
-4.4% |
£3,701,168 |
14.6% |
£3,229,281 |
3.8% |
£3,110,777 |
-3.3% |
£3,217,411 |
|
Number of Employees |
52 |
-11.9% |
59 |
- |
- |
- |
- |
- |
- |
|
Auditors |
LOVEWELL BLAKE LLP |
||||||||
|
Auditor Comments |
The audit report contains no adverse comments |
||||||||
|
Bankers |
BARCLAYS BANK PLC |
||||||||
|
Bank Branch Code |
20-69-85 |
||||||||
Ratios
|
Date Of Accounts |
31/12/12 |
31/12/11 |
31/12/10 |
31/12/09 |
31/12/08 |
|
Pre-tax profit margin % |
0.39 |
6.84 |
- |
- |
- |
|
Current ratio |
1.98 |
1.62 |
1.65 |
1.72 |
1.60 |
|
Sales/Net Working Capital |
4.75 |
5.29 |
- |
- |
- |
|
Gearing % |
64.10 |
68.10 |
73.10 |
80 |
120.90 |
|
Equity in % |
48.10 |
39 |
40.70 |
40.50 |
35.40 |
|
Creditor Days |
22.69 |
83.33 |
- |
- |
- |
|
Debtor Days |
70.88 |
74.77 |
- |
- |
- |
|
Liquidity/Acid Test |
1.32 |
0.97 |
1.03 |
1.16 |
1.15 |
|
Return On Capital Employed % |
0.66 |
13.32 |
- |
- |
- |
|
Return On Total Assets Employed % |
0.48 |
8.34 |
- |
- |
- |
|
Current Debt Ratio |
0.55 |
0.95 |
0.79 |
0.70 |
0.92 |
|
Total Debt Ratio |
1.07 |
1.56 |
1.45 |
1.46 |
1.82 |
|
Stock Turnover Ratio % |
14.01 |
19.55 |
- |
- |
- |
|
Return on Net Assets Employed % |
1 |
21.40 |
- |
- |
- |
Creditor Details
|
|
Total Number |
Total Value |
|
Trade Creditors |
0 |
- |
|
No Creditor Data |
Trade Debtors / Bad Debt Detail
|
|
Total Number
of Documented Trade |
Total Value
of Documented Trade |
|
Trade Debtors |
1 |
£12,826 |
|
Company Name |
Amount |
Statement Date |
|
£12,826 |
23/07/2010 |
FOREIGN EXCHANGE RATES
N/a
ADDITIONAL INFORMATION
Enquiries Trend
|
There have been 53 enquiries in the last 12 months. |
|
There are an average of 4 reports taken each month. |
Current Company
Secretary
|
Name |
Date of Birth |
- |
|
|
Officers Title |
Mr |
Nationality |
|
|
Present Appointments |
1 |
Function |
Company Secretary |
|
Appointment Date |
18/03/2013 |
|
|
|
Address |
|
||
Status History
|
No Status History found |
Event History
|
Date |
Description |
|
10/10/2013 |
New Accounts Filed |
|
10/10/2013 |
New Accounts Filed |
|
27/07/2013 |
Annual Returns |
|
21/03/2013 |
New Company Secretary Mr B. Mills appointed |
|
02/01/2013 |
New Board Member Mr M. Welp appointed |
|
13/12/2012 |
Ms C.P. Toft has left the board |
|
13/12/2012 |
Mr S.G. Farmer has left the board |
|
13/12/2012 |
Mr G. Toft has left the board |
|
13/12/2012 |
Mrs G.A. Lord has left the board |
|
13/12/2012 |
Mr P.J. Lord has resigned as company secretary |
|
13/12/2012 |
Mr P.J. Lord has left the board |
|
24/07/2012 |
Annual Returns |
|
28/06/2012 |
New Accounts Filed |
|
11/10/2011 |
New Accounts Filed |
|
11/10/2011 |
New Accounts Filed |
Previous Company Names
|
Date |
Previous Name |
|
08/05/2007 |
SPECIALISED BELTING HOLDINGS LIMITED |
|
09/08/1989 |
CRANVEME LIMITED |
NOTES & COMMENTS
Commentary
|
No exact match CCJs are recorded against the company. |
|
|
Sales in the latest trading period decreased 17% on the previous
trading period. |
|
|
Net Worth increased by 0.9% during the latest trading
period. |
|
|
A 18.2% decline in Total Assets occurred during the latest
trading period. |
|
|
Pre-tax profits decreased by 95.2% compared to the previous
trading period. |
|
|
The company saw a decrease in their Cash Balance of 33.8%
during the latest trading period. |
|
|
The audit report contains no adverse comments. |
|
|
No recent changes in directorship are recorded. |
|
|
The company is part of a group. |
|
|
The company was established over 24 years ago. |
|
FOREIGN EXCHANGE RATES
|
Currency |
Unit
|
Indian Rupees |
|
US Dollar |
1 |
Rs.60.14 |
|
|
1 |
Rs.102.22 |
|
Euro |
1 |
Rs.81.02 |
INFORMATION DETAILS
|
Analysis Done by
: |
RAS |
|
|
|
|
Report Prepared
by : |
|
RATING EXPLANATIONS
|
RATING |
STATUS |
PROPOSED CREDIT LINE |
|
|
|
>86 |
Aaa |
Possesses an extremely sound financial base with the strongest capability
for timely payment of interest and principal sums |
Unlimited |
|
|
71-85 |
Aa |
Possesses adequate working capital. No caution needed for credit
transaction. It has above average (strong) capability for payment of interest
and principal sums |
Large |
|
|
56-70 |
A |
Financial & operational base are regarded healthy. General
unfavourable factors will not cause fatal effect. Satisfactory capability for
payment of interest and principal sums |
Fairly Large |
|
|
41-55 |
Ba |
Overall operation is considered normal. Capable to meet normal
commitments. |
Satisfactory |
|
|
26-40 |
B |
Capability to
overcome financial difficulties seems comparatively below average. |
Small |
|
|
11-25 |
Ca |
Adverse factors are apparent. Repayment of interest and principal sums
in default or expected to be in default upon maturity |
Limited with
full security |
|
|
<10 |
C |
Absolute credit risk exists. Caution needed to be exercised |
Credit not
recommended |
|
|
-- |
NB |
New Business |
-- |
|
This score serves as a reference to assess SC’s credit risk
and to set the amount of credit to be extended. It is calculated from a composite
of weighted scores obtained from each of the major sections of this report. The
assessed factors and their relative weights (as indicated through %) are as
follows:
Financial
condition (40%) Ownership
background (20%) Payment
record (10%)
Credit history
(10%) Market trend
(10%) Operational
size (10%)
This report is issued at your request without any
risk and responsibility on the part of MIRA INFORM PRIVATE LIMITED (MIPL)
or its officials.